. 2024 Aug 12;14(1):18701.
doi: 10.1038/s41598-024-69275-w.

Antibiotic resistance gene dynamics in the commensal infant gut microbiome over the first year of life

Affiliations

Antibiotic resistance gene dynamics in the commensal infant gut microbiome over the first year of life

Pål Trosvik et al. Sci Rep. .

Abstract

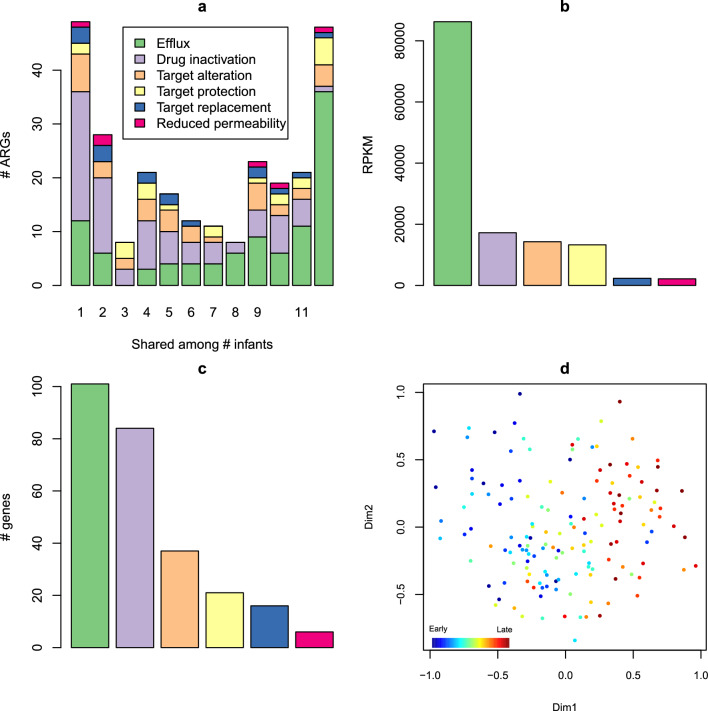
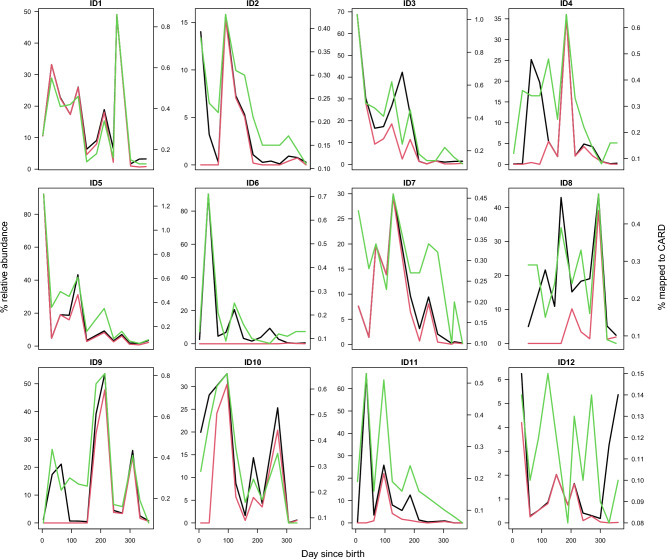
Colonization of the infant gut is an important developmental process characterized by high carriage of antimicrobial resistance genes (ARGs) and high abundances of pathobionts. The horizontal transfer of ARGs to pathogenic bacteria represents a major public health concern. However, there is still a paucity of longitudinal studies surveilling ARGs in healthy infant guts at high temporal resolution. Furthermore, we do not yet have a clear view of how temporal variation in ARG carriage relates to the dynamics of specific bacterial populations, as well as community virulence potential. Here, we performed deep shotgun metagenomic sequencing of monthly fecal samples from a cohort of 12 infants, covering the first year of life to interrogate the infant gut microbiome for ARG content. We further relate ARG dynamics to the dynamics of taxa, virulence potential, as well as the potential for ARG mobilization. We identify a core resistome dominated by efflux systems typically associated with Enterobacteriaceae. Overall ARG carriage declined over the first year of life and showed strong contemporaneous correlation with the population dynamics of Proteobacteria. Furthermore, the majority of ARGs could be further mapped to metagenome-assembled genomes (MAGs) classified to this phylum. We were able to assign a large number of ARGs to E. coli by correlating the temporal dynamics of individual genes with species dynamics, and we show that the temporal dynamics of ARGs and virulence factors are highly correlated, suggesting close taxonomic associations between these two gene classes. Finally, we identify ARGs linked with various categories of mobile genetic elements, demonstrating preferential linkage among mobility categories and resistance to different drug classes. While individual variation in ARG carriage is substantial during infancy there is a clear reduction over the first year of life. With few exceptions, ARG abundances closely track the dynamics of pathobionts and community virulence potential. These findings emphasize the potential for development of resistant pathogens in the developing infant gut, and the importance of effective surveillance in order to detect such events.

Keywords: Antibiotic resistance genes; Gut; Infant; Metagenome; Microbiome; Mobile genetic elements; Temporal dynamics; Virulence.


Conflict of interest statement

The authors declare no competing interests.

Figures

Figure 1
Figure 1
The core resistome is dominated by efflux systems and shows an overall time trend over the first year of life. (a) Pan and core resistome. The colored stacked bar segments represent the number of genes in each mechanistic category. Five genes (out of 260) had a dual mechanistic classification, and those genes were counted to both categories (e.g. both efflux and permeability), so that the height of a bar is not in all cases an entirely accurate reflection of the actual gene count. In category 1 the number of genes is actually 47 but comes out as 49 in the chart. In categories 9 and 10 the actual numbers are 22 and 18, but come out as 23 and 19, respectively. The size of the core genome is 47, but comes out as 48. (b) Efflux mechanisms ranked by mapping rate. (c) Efflux mechanisms ranked by the number of genes classified to each category. (d) NMDS model of ARG profiles in all samples. Dots are color coded according to day of sampling after birth, indicated on the colored bar at the bottom left, with dark blue indicating samples collected close to the day of birth and dark red samples collected close to the first birthday. Figure S2 shows the same plot with the dots color coded to indicate the identity of each infant.
Figure 2
Figure 2
Beta-lactam antibiotics were the most predominant drug class to which resistance was observed. The bars indicate the main classes of antibiotics ranked according to normalized abundance (RPKM = reads per kilobase of reference sequence per million sample reads). The beta-lactam class is the sum of the sub-classes carbapenem, penam, penem, cephalosporin, cephamycin and monobactam.
Figure 3
Figure 3
The infants showed highly individual temporal trajectories with respect to carriage of ARGs conferring resistance to various classes of antibiotics. Time trajectories of ARGs in all 12 infants in the cohort. The y-axes indicate normalized ARG abundances in RPKM. Abundances are broken down into the 18 identified main drug classes. ARGs conferring resistance to multiple drugs are counted multiple times. The drug classes are ordered by total abundance across all infants, from bottom to top. The x-axis is common to all panels.
Figure 4
Figure 4
The percentage of reads mapped to the CARD database and ARG diversity decreased over the first year of life. (a) Percentage of sequence reads mapping to the CARD database plotted against day after birth. (b) Diversity of ARGs over time, as measured by Shannon entropy. The trend lines represent generalized additive models, with five degrees of freedom for the regression spline in order to accommodate significant non-linearities in the predictor-response relationships. The grey shaded areas represent 95% confidence intervals. The dots are color coded according to individual provenance of samples as indicated in (a). Both models are highly significant (p < 0.001). For (a) estimated degrees of freedom (edf) is 1, indicating a linear relationship. For (b) edf = 1.9, indicating some non-linearity.
Figure 5
Figure 5
The percentage of sequence reads mapped to CARD correlated with relative abundances of Proteobacteria and E. coli in particular. Relative abundances of Proteobacteria (black lines) and E. coli (red lines) are indicated on the left side y-axes. Percentages of sequence reads (green lines) mapped to CARD are indicated on the right side axes. See Table 3 for correlations.
Figure 6
Figure 6
Contigs with co-localized ARGs and MGEs decreased in abundance over time. (a) Percentage of potentially mobile ARGs from the total pool of ARGs annotated on contigs, grouped by mobility category. Generalized additive models are fitted on the distance between annotated ARG and nearest MGE in kilobase pair (Kbp) against the percentage of mobilizable ARGs. Shaded areas represent 95% confidence intervals and are color coded by MGE category. The models for Mobile ARGS, Plasmids and Phage are highly significant (p < 0.001), the models for IGE, CE and IS are not significant. (b,c) Relative abundance of mobile ARG contigs plotted against day after birth. The trend lines represent generalized additive models. Both models predict a significant linear downward trend. The grey shaded bands represent 95% confidence intervals. The dots are color coded according to individual provenance of samples as indicated in (b). (b) Includes all potential mobile ARG contigs irrespective of the distance between ARG and MGE, while (c) only includes ARGs localized within 10 Kbp of an MGE.
Figure 7
Figure 7
Resistance mechanism profiles within MGE categories differed significantly from the total pool of MGE-linked ARGs. (a) Proportion of ARG resistance mechanisms per mobility type with < 10 Kb distance between ARGs and MGEs. The number at the bottom of each bar represents the total number of ARGs within the indicated MGE category. (b) Counts of ARG resistance mechanisms from (a). ARGs annotated on the same contig with several MGEs are shown in each MGE category. ARGs with multiple resistance mechanisms are counted multiple times. Corresponding Wilcoxon test results per resistance mechanism per MGE category are found in Table S12.

References

    1. Milani, C. et al. The first microbial colonizers of the human gut: Composition, activities, and health implications of the infant gut microbiota. Microbiol. Mol. Biol. Rev.81(4), 10–1128 (2017). 10.1128/MMBR.00036-17 - DOI - PMC - PubMed
    1. Tamburini, S., Shen, N., Wu, H. C. & Clemente, J. C. The microbiome in early life: Implications for health outcomes. Nat. Med.22(7), 713–722 (2016). 10.1038/nm.4142 - DOI - PubMed
    1. De Muinck, E. J. & Trosvik, P. Individuality and convergence of the infant gut microbiota during the first year of life. Nat. Commun.10.1038/s41467-018-04641-7 (2018). 10.1038/s41467-018-04641-7 - DOI - PMC - PubMed
    1. Xiao, L. W., Wang, J. F., Zheng, J. Y., Li, X. Q. & Zhao, F. Q. Deterministic transition of enterotypes shapes the infant gut microbiome at an early age. Genome Biol.10.1186/s13059-021-02463-3 (2021). 10.1186/s13059-021-02463-3 - DOI - PMC - PubMed
    1. Yatsunenko, T. et al. Human gut microbiome viewed across age and geography. Nature486(7402), 222–227 (2012). 10.1038/nature11053 - DOI - PMC - PubMed

Substances

LinkOut - more resources