. 2024 Aug 12;14(1):18724.
doi: 10.1038/s41598-024-69749-x.

Nephron specific ATP6AP2 knockout increases urinary excretion of fatty acids and decreases renal cortical megalin expression

Affiliations

Nephron specific ATP6AP2 knockout increases urinary excretion of fatty acids and decreases renal cortical megalin expression

Silas A Culver et al. Sci Rep. .

Abstract

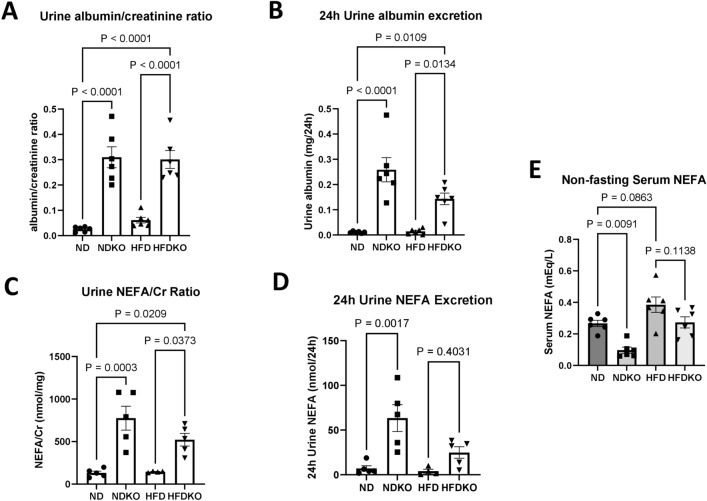
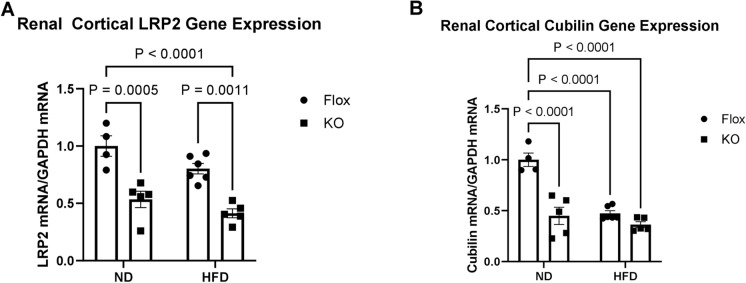
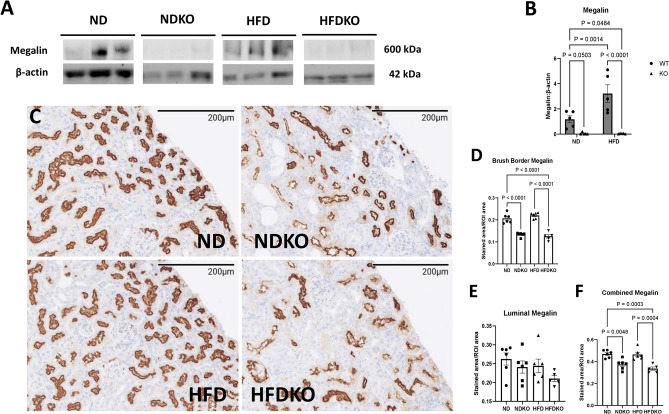
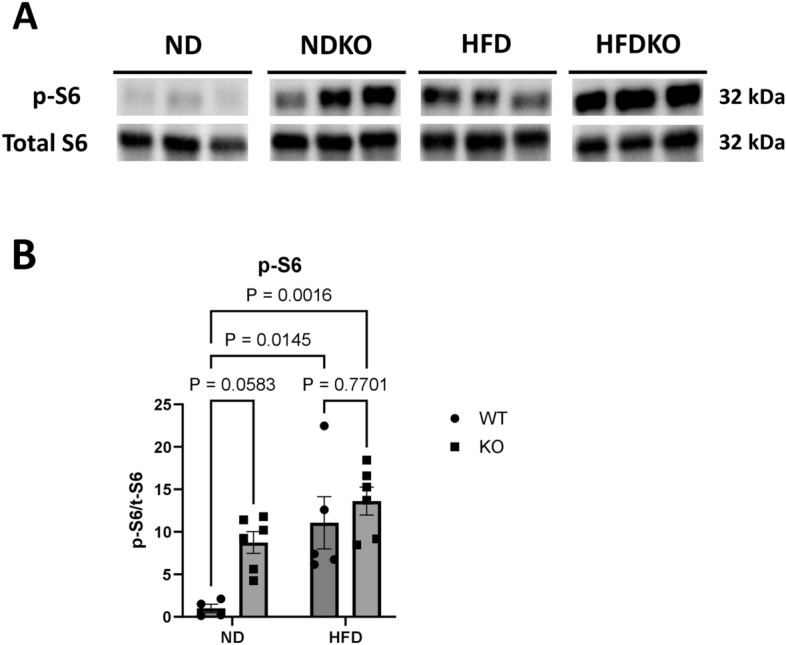
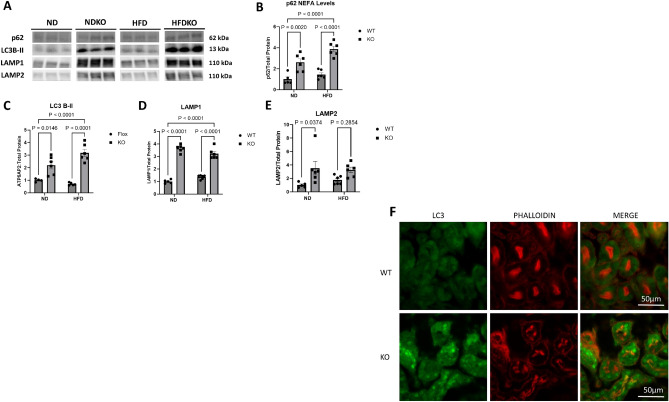
ATP6AP2 knockout in the renal nephron impairs receptor-mediated endocytosis, increasing urinary albumin and glucose excretion and impairing weight gain. Nonesterified fatty acids (NEFA) in urine are bound to albumin and reabsorbed in the proximal tubule through receptor-mediated endocytosis by the megalin-cubilin complex. We hypothesized that ATP6AP2 knockout increases urinary NEFA excretion through a reduction in megalin. Ten-week-old male C57BL/6 mice with nephron specific inducible ATP6AP2 knockout and noninduced controls were fed either normal diet (ND 12% fat) or high fat diet (HFD 45% fat) for 6 months. ATP6AP2 knockout significantly increased urine albumin:creatinine ratio in both ND and HFD fed mice while normalized urine NEFA concentration increased 489% and 259% in ND and HFD knockout mice compared to respective controls. Knockout decreased renal cortical megalin mRNA by 47% on ND and 49% on HFD while megalin protein expression decreased by 36% and 44% respectively. At the same time, markers of mTOR activity were increased while autophagy was impaired. Our results indicate that nephron specific ATP6AP2 knockout increases urinary NEFA excretion in the setting of impaired receptor-mediated endocytosis. Further investigation should determine whether ATP6AP2 contributes to obesity related ectopic lipid deposition in the proximal tubule.

Keywords: (pro)renin receptor; ATP6AP2; Kidney; Lipid; Obesity.


Conflict of interest statement

The authors declare no competing interests.

Figures

Figure 1
Figure 1
Urine albumin and NEFA excretion. Obtained after 6 months of ND vs HFD in mice with and without ATP6AP2 knockout. (A) Urine albumin to creatinine ratio. N = 6 for all groups, (B) 24-h urine albumin excretion N = 6 for all groups, (C) urine NEFA concentration normalized to urine creatinine. N = 5 for all groups, (D) 24-h urine NEFA excretion. N = 5 for all groups. (E) Serum NEFA levels under random fed conditions. N = 6 for all groups. Data presented as mean ± SEM.
Figure 2
Figure 2
Renal cortical LRP2 and cubilin mRNA expression. In mice with and without ATP6AP2 knockout after 6 months on ND vs HFD. (A) RT-PCR for LRP2 mRNA normalized to GAPDH mRNA in renal cortical tissue. ND (N = 4), NDKO (N = 5), HFD (N = 6), HFDKO (N = 5). (B) RT-PCR for Cubilin mRNA normalized to GAPDH mRNA in renal cortical tissue. ND (N = 4), NDKO (N = 5), HFD (N = 6), HFDKO (N = 5). Data presented as mean ± SEM and normalized to ND.
Figure 3
Figure 3
Renal cortical megalin expression. (A) Representative Western Blot images of bands for megalin and β-actin. (B) Quantitation of megalin signal normalized to β-actin. ND (N = 5), NDKO (N = 5), HFD (N = 5), HFDKO (N = 5). (C) Representative light microscopy images of kidney immunohistochemistry for megalin from each treatment group. (D) Quantitation of proximal tubule brush border (dark brown) staining expressed as average stained area per region of interest (ROI) area based on analysis of 6 ROIs per section. (E) Quantitation of proximal tubule luminal (light brown) staining expressed as average stained area per region of interest (ROI) area based on analysis of 6 ROIs per section. (F) Quantitation of combined brush border and luminal staining expressed as average stained area per region of interest (ROI) area based on analysis of 6 ROIs per section. Number of mice per treatment group ND (N = 6), NDKO (N = 6), HFD (N = 6), HFDKO (N = 5). Data presented as mean ± SEM.
Figure 4
Figure 4
Renal cortical p-S6 expression. (A) Representative bands from Western Blot of p-S6 and total-S6 with samples taken from mice with and without ATP6AP2 knockout on ND v. HFD groups after 6 months. (B) p-S6 signal normalized to total-S6. ND (N = 5), NDKO (N = 6), HFD (N = 6), HFDKO (N = 6) Data presented as mean ± SEM.
Figure 5
Figure 5
Renal cortical expression of autophagy markers. (A) Representative bands from Western Blot of p62, LC3B-II, LAMP1, and LAMP2. (B) p62 signal normalized to total protein. (C) LC3B-II signal normalized to total protein. (D) LAMP1 signal normalized to total protein. (E) LAMP2 signal normalized to total protein. ND (N = 5), NDKO (N = 6), HFD (N = 6), HFDKO (N = 6). Data presented as mean ± SEM. (F) Confocal microscopy of immunofluorescence for LC3B in renal cortex of ND and NDKO mice. Green color represents positive staining for LC3B and red staining represents positive staining for proximal tubule marker phalloidin. See originally produced, full-length blots in Supplementary Figures.

References

    1. Fryar, C. D., Carrol, M. D., & Afful, J. Prevalence of Overweight, Obesity, and Severe Obesity among Adults Aged 20 and over: United States, 1960–1962 through 2017–2018 (2020).
    1. Iseki, K. et al. Body mass index and the risk of development of end-stage renal disease in a screened cohort. Kidney Int.65, 1870–1876 (2004). 10.1111/j.1523-1755.2004.00582.x - DOI - PubMed
    1. Hsu, C., McCulloch, C. E., Iribarren, C., Darbinian, J. & Go, A. S. Body mass index and risk for end-stage renal disease. Ann. Intern. Med.144, 21–28 (2006). 10.7326/0003-4819-144-1-200601030-00006 - DOI - PubMed
    1. de Vries, A. P. J. et al. Fatty kidney: Emerging role of ectopic lipid in obesity-related renal disease. Lancet Diabetes Endocrinol.2, 417–426 (2014). 10.1016/S2213-8587(14)70065-8 - DOI - PubMed
    1. Izquierdo-Lahuerta, A., Martínez-García, C. & Medina-Gómez, G. Lipotoxicity as a trigger factor of renal disease. J. Nephrol.29, 603–610 (2016). 10.1007/s40620-016-0278-5 - DOI - PubMed

MeSH terms

Substances

LinkOut - more resources