. 2024 Aug 12;7(1):977.
doi: 10.1038/s42003-024-06564-0.

Building a learnable universal coordinate system for single-cell atlas with a joint-VAE model

Affiliations

Building a learnable universal coordinate system for single-cell atlas with a joint-VAE model

Haoxiang Gao et al. Commun Biol. .

Abstract

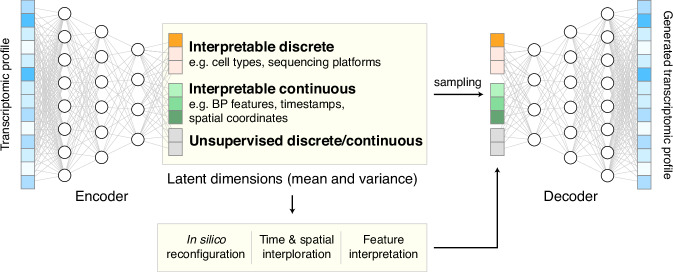
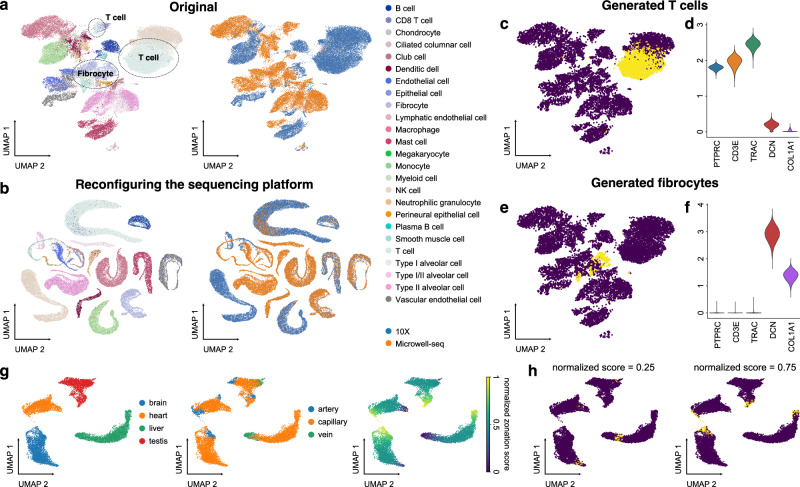
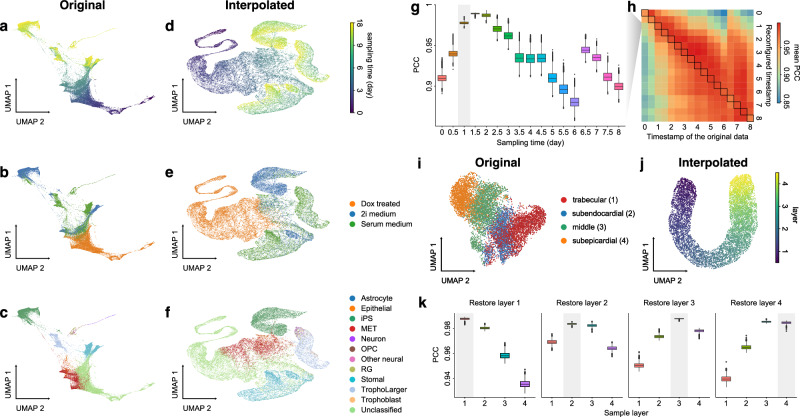
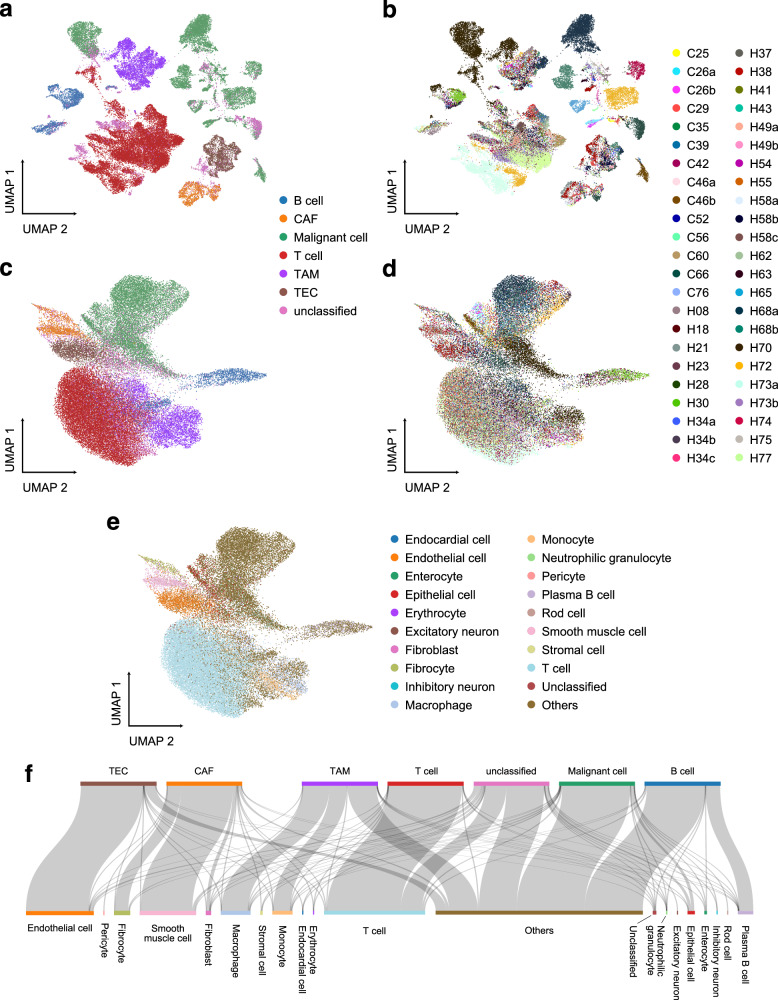
A universal coordinate system that can ensemble the huge number of cells and capture their heterogeneities is of vital importance for constructing large-scale cell atlases as references for molecular and cellular studies. Studies have shown that cells exhibit multifaceted heterogeneities in their transcriptomic features at multiple resolutions. This nature of complexity makes it hard to design a fixed coordinate system through a combination of known features. It is desirable to build a learnable universal coordinate model that can capture major heterogeneities and serve as a controlled generative model for data augmentation. We developed UniCoord, a specially-tuned joint-VAE model to represent single-cell transcriptomic data in a lower-dimensional latent space with high interpretability. Each latent dimension can represent either discrete or continuous feature, and either supervised by prior knowledge or unsupervised. The latent dimensions can be easily reconfigured to generate pseudo transcriptomic profiles with desired properties. UniCoord can also be used as a pre-trained model to analyze new data with unseen cell types and thus can serve as a feasible framework for cell annotation and comparison. UniCoord provides a prototype for a learnable universal coordinate framework to enable better analysis and generation of cells with highly orchestrated functions and heterogeneities.


Conflict of interest statement

The authors declare no competing interests.

Figures

Fig. 1
Fig. 1. The schematic diagram of UniCoord.
The encoder transforms the transcriptomic profile of a single cell into a low-dimensional latent space. The decoder samples from the latent space and transformed the sample into a generated transcriptomic profile. The latent dimensions can either be interpretable (supervised) or unsupervised, and can either be discrete or continuous. The latent dimensions can be reconfigured to generate pseudo transcriptomic profiles with desired properties.
Fig. 2
Fig. 2. In silico reconfiguration with UniCoord generates cells with designated features.
a UMAP plots showing the original hECA lung cells colored by cell types (left) or sequencing platforms (right). b UMAP plots showing the generated hECA lung cells with the sequencing platform reconfigured into “10X”, colored by cell types (left) and original sequencing platforms (right). c The UMAP plot of original cells (blue) and cells with the cell type reconfigured into T cells (yellow). d Expression levels of T-cell and fibrocyte markers in cells with the cell type reconfigured into T cells. e The UMAP plot of original cells (blue) and cells with the cell type reconfigured into fibrocytes (yellow). f Expression levels of T-cell and fibrocyte markers in cells with the cell type reconfigured into fibrocytes. g Vascular endothelial cells from four mouse organs, colored by tissues (left), vessel types (middle), or normalized artery-capillary-vein zonation scores (right). The zonation scores were normalized to be between 0 and 1. h UMAP plots of original cells (blue) and cells with zonation scores reconfigured into different values (yellow). For both models, all genes in the dataset were adopted to perform the experiments, and the number of unsupervised latent dimensions was set as 50. a, b All genes were used for visualization. c, e, g, h Highly variable genes (HVGs) were used for visualization. c, e, h For each generated cell, we calculated its nearest neighbor in the original dataset for visualization.
Fig. 3
Fig. 3. UniCoord interpolated discrete timestamps or spatial coordinates into continuous trajectories.
ac Mouse iPSC reprogramming data visualized by the low-dimensional visualization provided by the original study, cells colored by sampling days (a), treatments (b), and cell types (c). df UniCoord-interpolated mouse iPSC reprogramming data, cells colored by continuous sampling time (d), treatments (e), or cell types (f). Dox doxycycline, iPS induced pluripotent stem cells, MET cells undergoing a mesenchymal-to-epithelial transition, OPC oligodendrocyte precursor cells, RG radial glial cells. g PCCs between the restored data of day 1 and the mean gene expression of the original data. h Mean PCCs between restored data of each timestamp and the mean gene expression of the original data. g, h Data of a timestamp were excluded, and then the unclassified cells of this timestamp were restored by reconfiguring the timestamp of all other unclassified cells as this timestamp. Cells in days 0–8 were restored and compared in this experiment. i, j UMAP plots showing real (i) and interpolated (j) CMs from the left ventricle. The corresponding layer number was shown in the legend of (i). For both models, all genes in the dataset were adopted to perform the experiments, and the number of unsupervised latent dimensions was set as 50. HVGs were used for visualization all UMAP plots. k PCCs between restored data and the mean gene expression of the original data. Data of each sample layer are excluded, respectively, and then restored by reconfiguring cells of all other sample layers. The reconfigured target timestamp/sample layer is shaded in gray in (g, k).
Fig. 4
Fig. 4. Analyze HCC data using the UniCoord model pretrained by hECA data.
a, b The UMAP plot showing the landscape of the HCC dataset, represented by PCA. Cells are colored by cell types (a) or sample IDs (b). ce The UMAP plot showing the landscape of the HCC dataset, represented by the pretrained UniCoord model. Cells are colored by cell types (c), sample IDs (d), and UniCoord-predicted cell types (e). f The relations between original labels (top) and cell types predicted by UniCoord (bottom). Protein coding genes in the dataset were adopted to perform the experiments. All genes were used for visualization all UMAP plots.

Similar articles

Cited by

References

    1. Zeng, H. What is a cell type and how to define it? Cell185, 2739–2755 (2022). 10.1016/j.cell.2022.06.031 - DOI - PMC - PubMed
    1. Regev, A. et al. The Human Cell Atlas. eLife6, e27041 (2017). 10.7554/eLife.27041 - DOI - PMC - PubMed
    1. HuBMAP Consortium et al. The human body at cellular resolution: the NIH Human Biomolecular Atlas Program. Nature574, 187–192 (2019). 10.1038/s41586-019-1629-x - DOI - PMC - PubMed
    1. Chen, S. et al. hECA: The cell-centric assembly of a cell atlas. iScience25, 104318 (2022). 10.1016/j.isci.2022.104318 - DOI - PMC - PubMed
    1. Trapnell, C. et al. The dynamics and regulators of cell fate decisions are revealed by pseudotemporal ordering of single cells. Nat. Biotechnol.32, 381–386 (2014). 10.1038/nbt.2859 - DOI - PMC - PubMed

Publication types

LinkOut - more resources