

Optical coherence tomography quantifies gradient refractive index and mechanical stiffness gradient across the human lens
- PMID: 39134623
- PMCID: PMC11319654
- DOI: 10.1038/s43856-024-00578-9
Optical coherence tomography quantifies gradient refractive index and mechanical stiffness gradient across the human lens
Abstract
Background: As a key element of ocular accommodation, the inherent mechanical stiffness gradient and the gradient refractive index (GRIN) of the crystalline lens determine its deformability and optical functionality. Quantifying the GRIN profile and deformation characteristics in the lens has the potential to improve the diagnosis and follow-up of lenticular disorders and guide refractive interventions in the future.
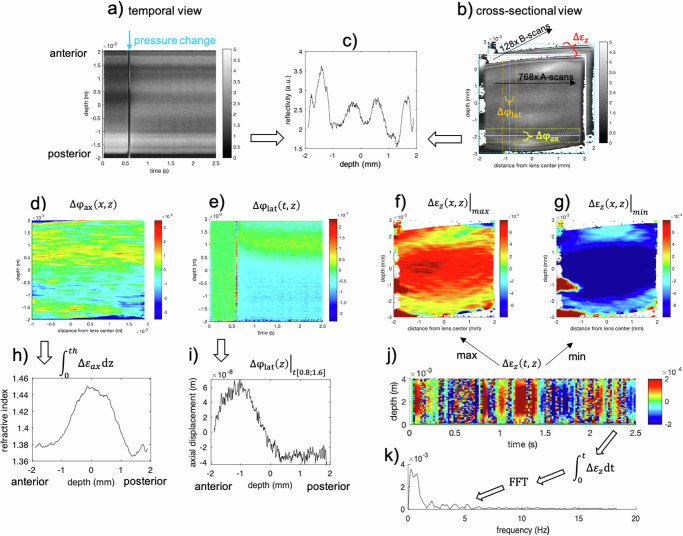
Methods: Here, we present a type of optical coherence elastography able to examine the mechanical characteristics of the human crystalline lens and the GRIN distribution in vivo. The concept is demonstrated in a case series of 12 persons through lens displacement and strain measurements in an age-mixed group of human subjects in response to an external (ambient pressure modulation) and an intrinsic (micro-fluctuations of accommodation) mechanical deformation stimulus.
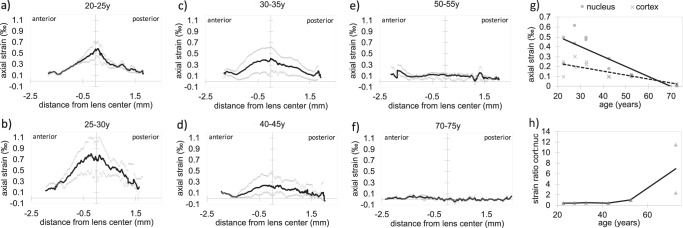
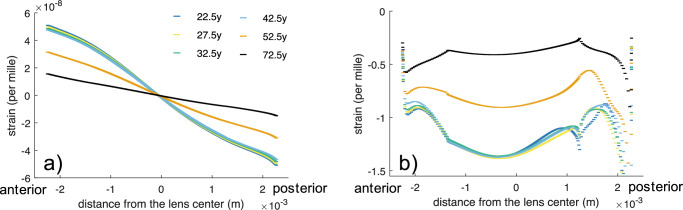
Results: Here we show an excellent agreement between the high-resolution strain map retrieved during steady-state micro-fluctuations and earlier reports on lens stiffness in the cortex and nucleus suggesting a 2.0 to 2.3 times stiffer cortex than the nucleus in young lenses and a 1.0 to 7.0 times stiffer nucleus than the cortex in the old lenses.
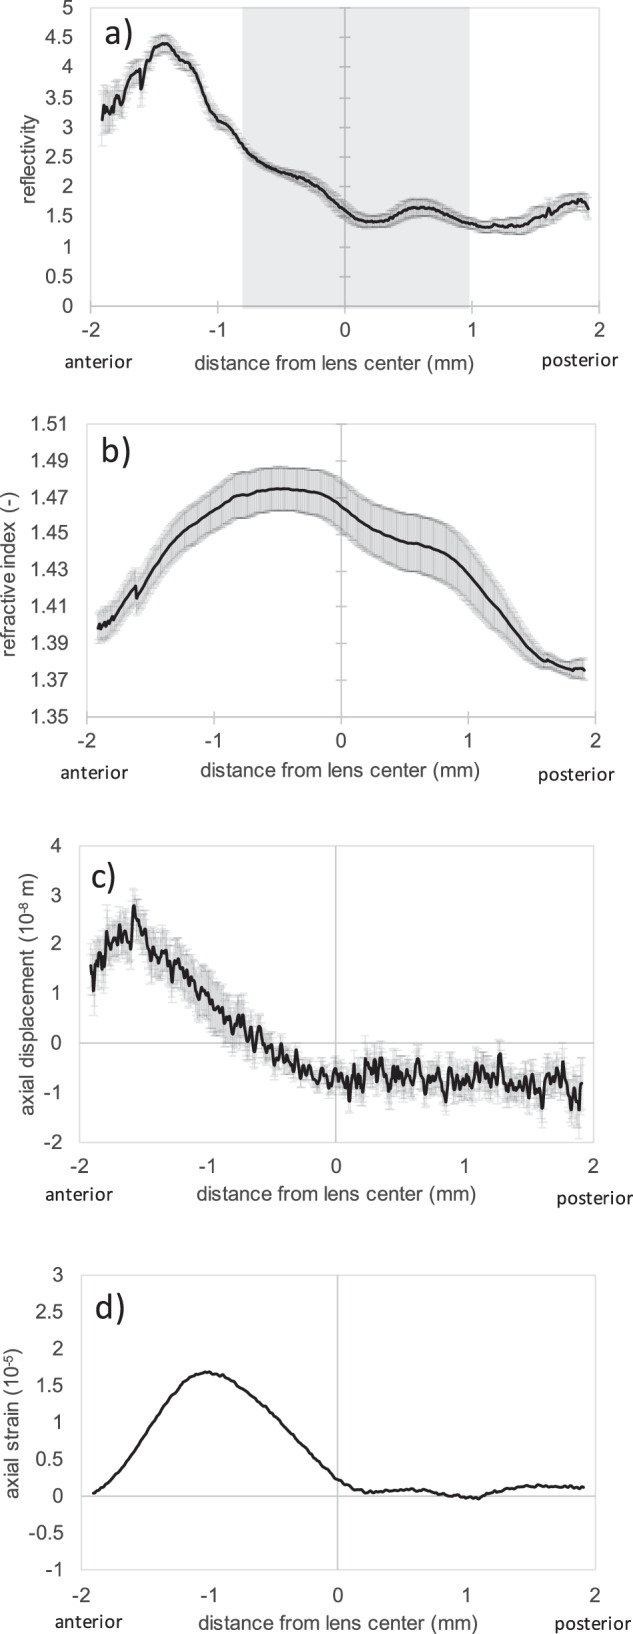
Conclusions: Optical coherence tomography is suitable to quantify the internal stiffness and refractive index distribution of the crystalline lens in vivo and thus might contribute to reveal its inner working mechanism. Our methodology provides new routes for ophthalmic pre-surgical examinations and basic research.
Plain language summary
The lens of the eye changes in shape to enable objects at different distances from the eye to be seen clearly. Loss of ability to change the eyes’ focus occurs during aging. We have developed a new way to image the eye that assesses how different lens regions change their shape. We evaluated our approach on twelve people of different ages and showed that those who were older had a stiffer lens, particularly in the central part of the lens. Further development and testing of our method could enable it to be used to both improve routine eye assessments as well as enable more research into how the eye works.
© 2024. The Author(s).
Conflict of interest statement
The author S.K. declares the following competing interest: Funding (research support: equipment from Heidelberg Engineering), Patent application (METHOD AND APPARATUS FOR INVESTIGATING A SAMPLE, EP19193554.3). All other authors declare no competing interests.
Figures

Similar articles
-
Crystalline lens gradient refractive index distribution in the guinea pig.Ophthalmic Physiol Opt. 2020 May;40(3):308-315. doi: 10.1111/opo.12667. Ophthalmic Physiol Opt. 2020. PMID: 32338776
-
Dynamic in vivo mapping of the gradient refractive index and strain distribution of the human lens under accommodative stress.Exp Eye Res. 2025 Jun;255:110332. doi: 10.1016/j.exer.2025.110332. Epub 2025 Mar 11. Exp Eye Res. 2025. PMID: 40081752
-
Off-axis optical coherence tomography imaging of the crystalline lens to reconstruct the gradient refractive index using optical methods.Biomed Opt Express. 2019 Jun 26;10(7):3622-3634. doi: 10.1364/BOE.10.003622. eCollection 2019 Jul 1. Biomed Opt Express. 2019. PMID: 31360608 Free PMC article.
-
The role of the lens in refractive development of the eye: animal models of ametropia.Exp Eye Res. 2008 Jul;87(1):3-8. doi: 10.1016/j.exer.2008.03.001. Epub 2008 Mar 18. Exp Eye Res. 2008. PMID: 18405895 Review.
-
Regulation of lens water content: Effects on the physiological optics of the lens.Prog Retin Eye Res. 2023 Jul;95:101152. doi: 10.1016/j.preteyeres.2022.101152. Epub 2022 Dec 5. Prog Retin Eye Res. 2023. PMID: 36470825 Review.
Cited by
-
In vivo changes in the gradient of refractive index distribution in the accommodating human lens.Exp Eye Res. 2025 Sep;258:110483. doi: 10.1016/j.exer.2025.110483. Epub 2025 Jun 10. Exp Eye Res. 2025. PMID: 40505712 Free PMC article.
-
The Clinical Usefulness of Evaluating the Lens and Intraocular Lenses Using Optical Coherence Tomography: An Updated Literature Review.J Clin Med. 2024 Nov 22;13(23):7070. doi: 10.3390/jcm13237070. J Clin Med. 2024. PMID: 39685529 Free PMC article. Review.
References
Grants and funding
LinkOut - more resources
Full Text Sources
Research Materials
