. 2024 Dec;23(12):1748-1758.
doi: 10.1038/s41563-024-01971-4. Epub 2024 Aug 12.

Substrates mimicking the blastocyst geometry revert pluripotent stem cell to naivety

Affiliations

Substrates mimicking the blastocyst geometry revert pluripotent stem cell to naivety

Xun Xu et al. Nat Mater. 2024 Dec.

Abstract

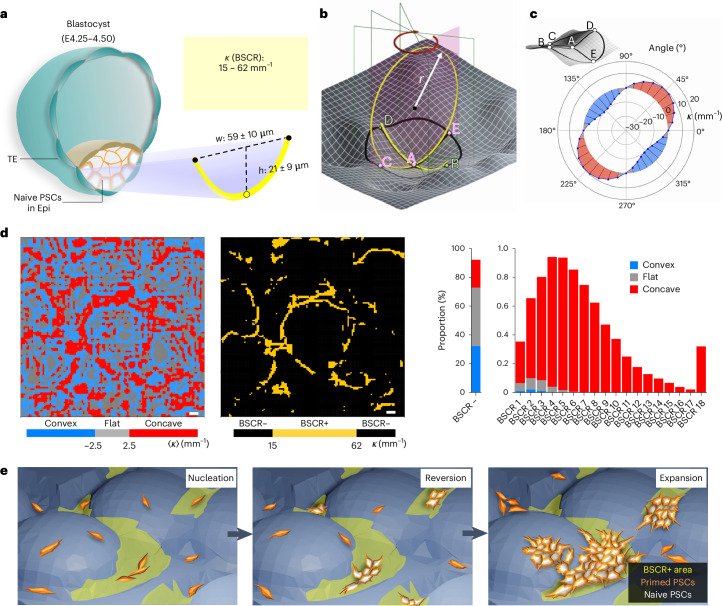
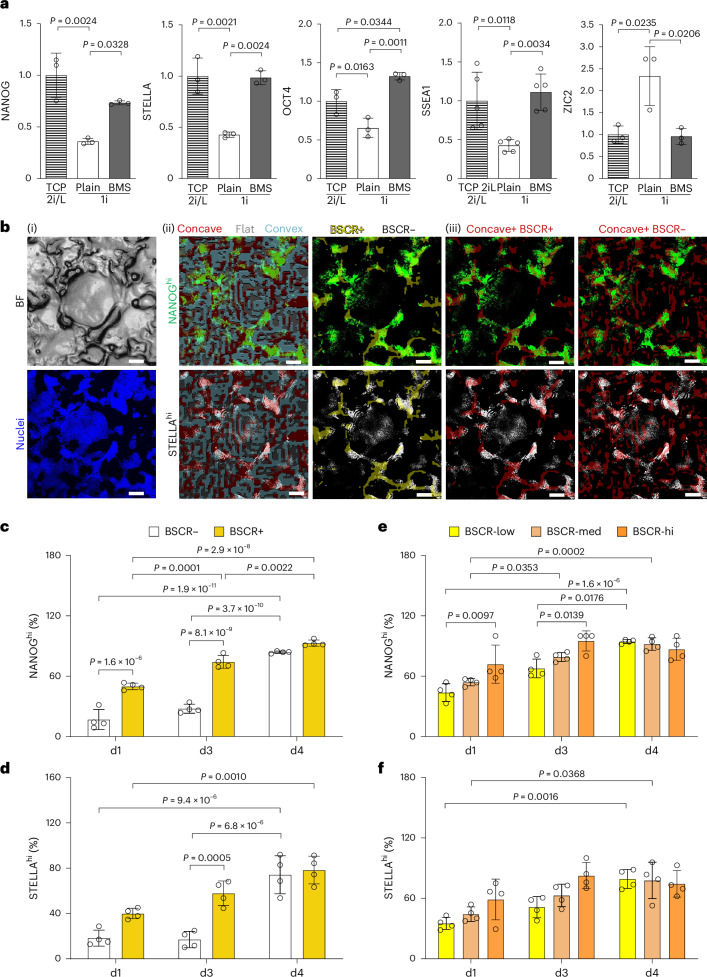
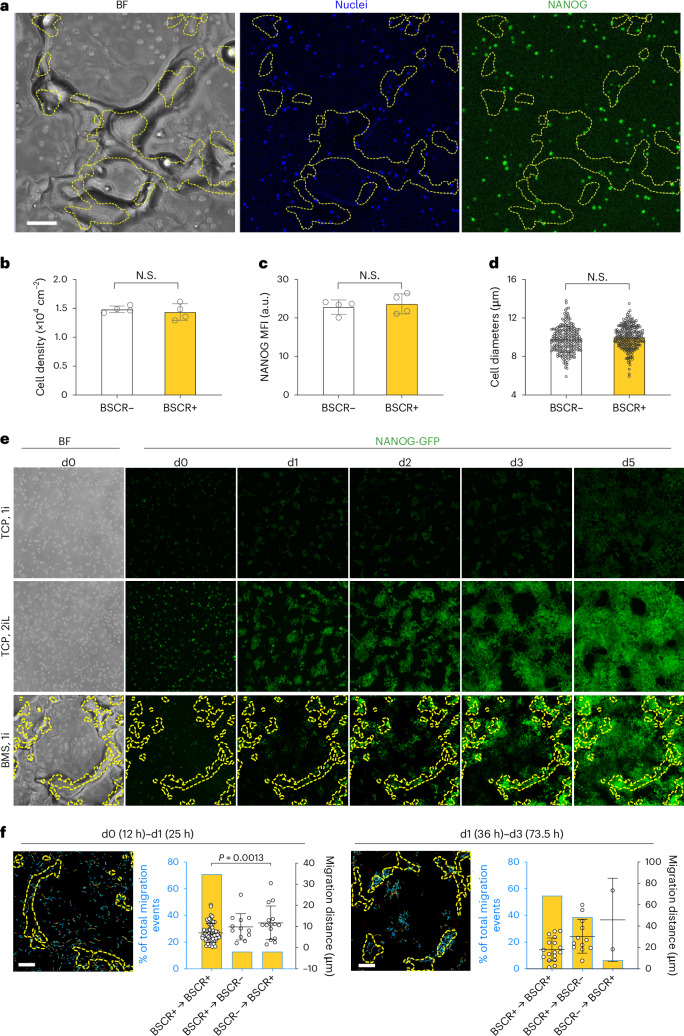
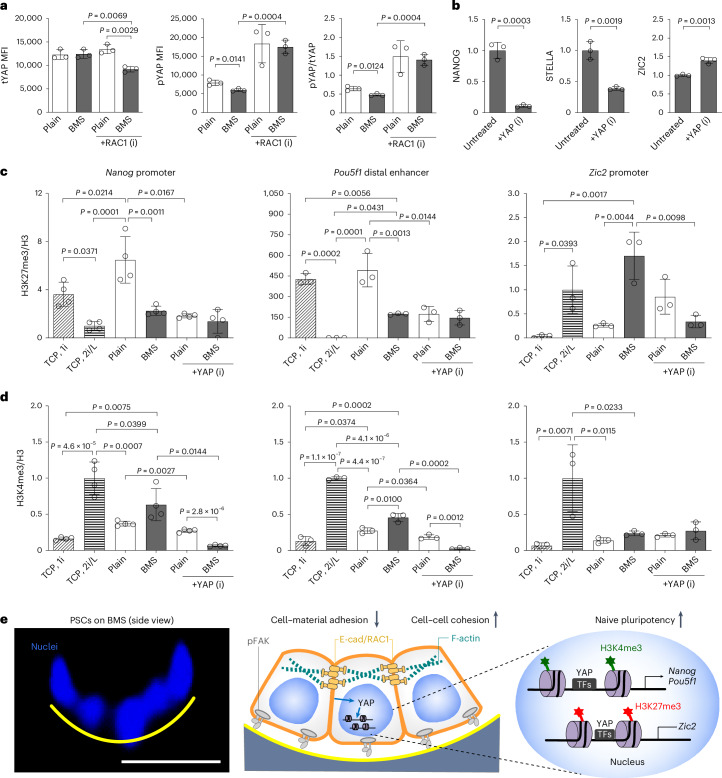
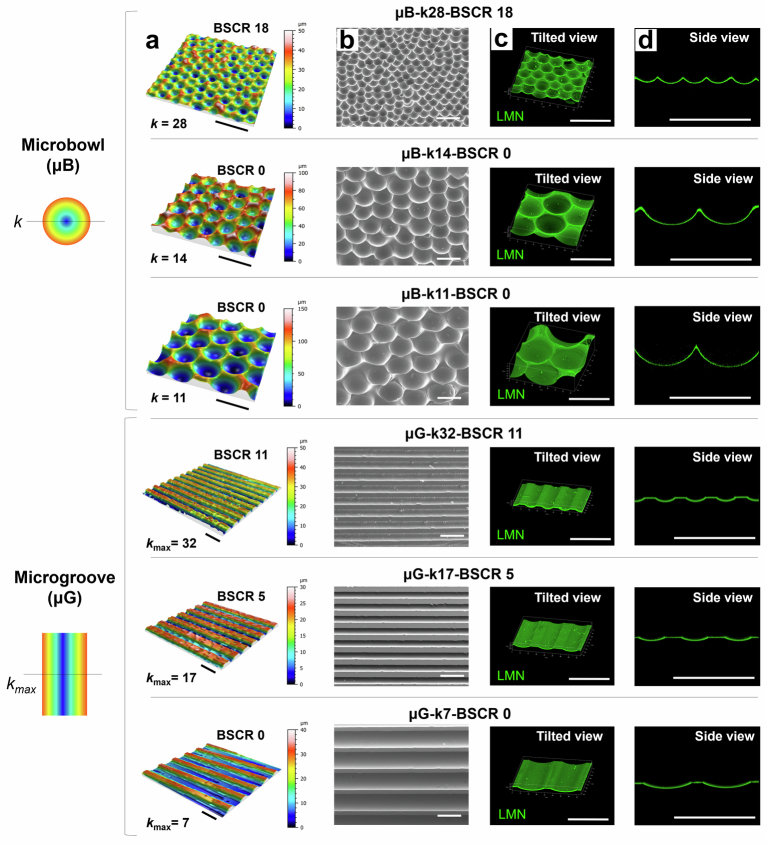
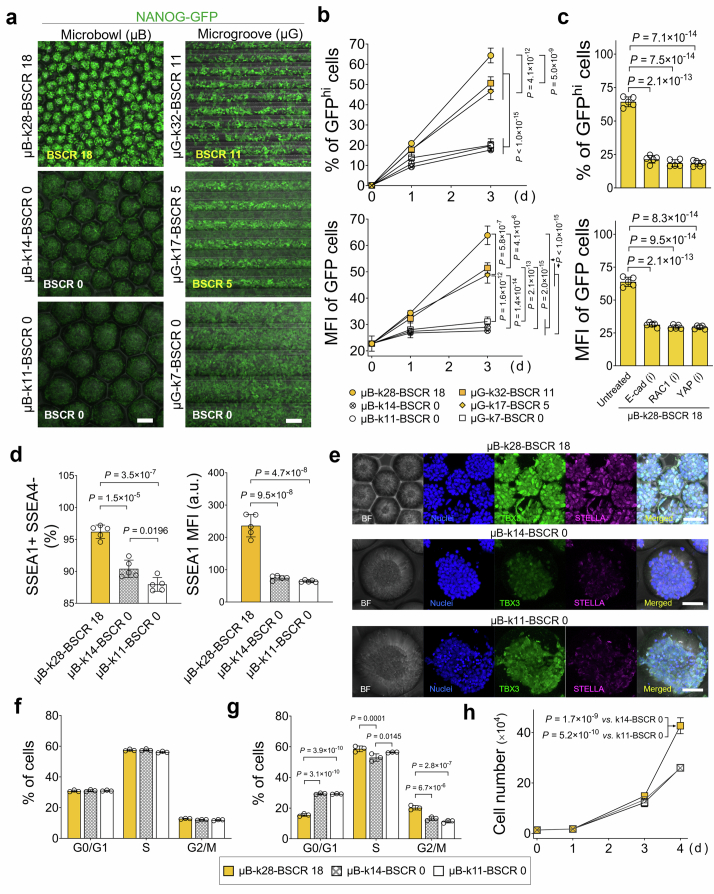
Naive pluripotent stem cells have the highest developmental potential but their in vivo existence in the blastocyst is transient. Here we report a blastocyst motif substrate for the in vitro reversion of mouse and human pluripotent stem cells to a naive state. The substrate features randomly varied microstructures, which we call motifs, mimicking the geometry of the blastocyst. Motifs representing mouse-blastocyst-scaled curvature ranging between 15 and 62 mm-1 were the most efficient in promoting reversion to naivety, as determined by time-resolved correlative analysis. In these substrates, apical constriction enhances E-cadherin/RAC1 signalling and activates the mechanosensitive nuclear transducer YAP, promoting the histone modification of pluripotency genes. This results in enhanced levels of pluripotency transcription factor NANOG, which persist even after cells are removed from the substrate. Pluripotent stem cells cultured in blastocyst motif substrates display a higher development potential in generating embryoid bodies and teratomas. These findings shed light on naivety-promoting substrate design and their large-scale implementation.


Conflict of interest statement

Competing interests: A.L. and K.K. are inventors of a patent (WO 2011/054601 (A1)), related to cell culture inserts. X.X., Weiwei Wang and N.M. are inventors on a provisional patent application (EP 24160389.3 and 24161228.2) covering the biophysical methods for naivety reversion. The remaining authors declare no competing interests.

Figures

Fig. 1
Fig. 1. Design and motif analysis of BMS.
a, Schematic of a mouse blastocyst (preimplantation; E4.25–E4.50). The outer layer of nPSCs experiences curvatures in the BSCR (yellow curve), measured from the Epi–TE interface. bd, Computational analysis of BMS surface topographical features. b, Scaled three-point approach for evaluating the curvature κ, which was analysed in 18 directions for each point using a scale length (CE) of 60 µm, similar to the width of the Epi. c, Representative example model showing the curvature value of the given point A in 18 directions. d, Left: each point on the topographical surface was allocated a motif according to the mean curvature 〈κ〉: convex (〈κ〉 ≤ –2.5 mm–1, blue), flat (–2.5 mm–1 < 〈κ〉 < 2.5 mm–1, grey), concave (〈κ〉 ≥ 2.5 mm–1, red). Middle: the BSCR+ area (yellow) included points where κ was within the BSCR in at least one direction. Right: proportion of points with different BSCR counts on BMS, correlated with the convex, flat and concave motifs. e, Schematic of the overlaid topographical maps of BMS with time-resolved cell images to evaluate the reversion and expansion of PSCs. Source data
Fig. 2
Fig. 2. BMS boosts the naivety of PSCs through BSCR motif.
a, Levels of naive pluripotent markers NANOG, STELLA, OCT4, SSEA1 and primed marker ZIC2 in day-5 PSCs on different substrates. Positive control (TCP, 2i/L) for the naive state was set as 1 (NANOG, STELLA, OCT4 and ZIC2: n = 3 biologically independent experiments; SSEA1, n = 5 biologically independent experiments). Data are presented as means ± s.d.; statistical significance was calculated via a one-way ANOVA with Bonferroni’s multiple comparisons test. b, Representative BMS topographical map and PSC image. Cells were stained on day 3 with Hoechst 33342 to visualize the nuclei of the whole population (blue), whereas the NANOGhi (green) and STELLAhi (white) cells were filtered out to show the naive population. Bright-field (BF) image of BMS and nuclei staining of PSCs (i); naive PSCs overlaid with BMS motif map (ii): concave (red), convex (cyan), flat (grey), BSCR+ (yellow) and BSCR– (black). Naive PSC distribution in BSCR+ and BSCR– areas in the concave region (iii). Scale bars, 100 μm. cf, Percentage of nPSCs (NANOGhi and STELLAhi) out of the total cells on the indicated motifs was analysed over time to elucidate the effect of BSCR (c and d) and BSCR counts (e and f) on PSC naivety. BSCR-low, BSCR-med and BSCR-hi represent BSCR counts of 1–6, 7–12 and 13–18, respectively (n = 4 biologically independent experiments; data are presented as means ± s.d.; statistical significance was calculated via a two-way ANOVA with Bonferroni’s multiple comparisons test, for effects of BSCR and time). Source data
Fig. 3
Fig. 3. BSCR elicits in situ naivety reversion of PSCs.
ad, Early-stage cell–BMS interaction was examined 9 h after cell seeding. Representative bright-field, nuclei and NANOG staining images (a) and quantitative analysis of cell distribution (b), MFI of NANOG (c) and size (d) of PSCs, located inside and outside the BSCR areas. Scale bars, 100 μm (cell density and NANOG: n = 4; cell size: ncell = 220 and 228 for the BSCR– and BSCR+ groups, respectively; data are presented as means ± s.d.; statistical significance was calculated via a two-tailed Student’s t-test; N.S., non-significance). e, Dynamics of the NANOG-GFP expression of PSCs. Cells cultured on TCP with 1i and 2i/L media were used as negative and positive controls of naivety, respectively. Images represent the results from three independent experiments. Scale bar, 100 μm. f, Migration of PSCs (left: whole population; right: NANOG-GFPhi nPSCs) inside the BSCR+ area and crossing over the BSCR border on BMS in the indicated time frames. Images were recorded within 60 min (left) and 90 min (right) intervals. Scale bars, 100 μm (ncell = 93 and ncell = 31 for d0–d1 and d1–d3 cell tracking; data are presented as means ± s.d.; statistical significance was calculated via a one-way ANOVA with Bonferroni’s multiple comparisons test). The outlines of the BSCR+ areas were illustrated with dashed yellow lines. Source data
Fig. 4
Fig. 4. BMS reverts PSCs to naive state via E-cad/RAC1 signalling.
a,b, Representative immunofluorescence images of F-actin (red) (a) and E-cad (orange) (b) in PSC colonies on BMS: top view (xy plane) and side view (xz plane; optical cross section from the top view along the dotted white lines) (cell nuclei were stained with DAPI; images represent the results from three independent experiments). Scale bar, 50 µm. ce, Quantification of E-cad expression using flow cytometry (c), active RAC1 (d) and FAK (e) activity (Y397-phosphorylated FAK (pFAK)/total FAK (tFAK) ratio) with ELISA, for PSCs on plain substrate and BMS (n = 3 biologically independent experiments; data are presented as means ± s.d.; statistical significance was calculated via a two-tailed Student’s t-test). f, Level of NANOG, STELLA and ZIC2 in day-5 PSCs on BMSs with and without E-cad, RAC1 and FAK inhibition. The value of untreated PSCs was set as 1 (n = 3 biologically independent experiments; data are presented as means ± s.d.; statistical significance was calculated via a one-way ANOVA with Bonferroni’s multiple comparisons). g, Dynamic changes in NANOG-GFP in PSCs growing on BMS for 5 days with and without E-cad and RAC1 inhibition. Scale bar, 100 μm. h, Fraction of nPSCs (GFPhi) out of the total GFP+ cells on different motifs over time, with and without inhibitor treatment. The result was expressed as a ratio of areas covered by GFPhi cells and GFP+ cells (n = 3 biologically independent experiments; data are presented as means ± s.d.; statistical significance was calculated via a two-way ANOVA with Bonferroni’s multiple comparisons test, for effects of BSCR and time). I, MFI of GFP in the BSCR+ and BSCR– areas over time (n = 3 biologically independent experiments; data are presented as means ± s.d.; statistical significance was calculated via a two-way ANOVA with Bonferroni’s multiple comparisons test, for effects of BSCR and time). j, Representative time-lapse images showing the inhibition of E-cad/RAC1 signalling abolished the naivety of PSCs inside the BSCR+ area. Images represent the results from three independent experiments. Scale bar, 100 μm. For g and j, the BSCR+ areas are circled with dashed yellow lines. Source data
Fig. 5
Fig. 5. Epigenetic reversion of PSCs to the naive state on BMS mediated by YAP and histone modification.
a, Flow cytometry analysis of total YAP (tYAP), S127-phosphorylated YAP (pYAP) and pYAP/tYAP ratio in PSCs from plain substrate and BMS, with and without RAC1 inhibition (n = 3 biologically independent experiments; data are presented as means ± s.d.; statistical significance was calculated via a two-tailed Student’s t-test for comparing plain versus BMS–PSCs or untreated versus inhibition groups). b, Level of NANOG, STELLA and ZIC2 in day-5 PSCs on BMS with and without YAP inhibition. The level of untreated group was set as 1 (n = 3 biologically independent experiments; data are presented as means ± s.d.; statistical significance was calculated via a two-tailed Student’s t-test). c,d, ChIP PCR analysis of H3K27me3 (c) and H3K4me3 (d) levels at the promoter regions of Nanog and Zic2 and at distal enhancer region of Pou5f1 in the absence and presence of YAP inhibitor. Data were normalized by the total H3 value in each group. Positive control (TCP, 2iL) group was set as 1 (Nanog promoter: n = 4 biologically independent experiments; Pou5f1 distal enhancer and Zic2 promoter: n = 3 biologically independent experiments; data are presented as means ± s.d.; statistical significance was calculated via a one-way ANOVA with Bonferroni’s multiple comparisons test for groups without YAP inhibition and via a two-tailed Student’s t-test for comparing inhibition and the corresponding untreated groups). e, Proposed mechanism for nativity reversion at the epigenetic level. Left: side view of the mouse PSC nuclei in the BSCR+ area (yellow curve). Right: scheme of intracellular and intranuclear signalling events triggered by BSCR. TF, transcription factor. Source data
Fig. 6
Fig. 6. BMS stabilizes naive pluripotency of PSCs.
a, Scheme for analysing the naive pluripotency stability of PSCs preconditioned from substrates. PSCs were preconditioned on plain substrate and BMS for 5 days, followed by reseeding on laminin-coated TCP for monolayer culture, on uncoated TCP for EB formation and by injection for teratoma generation. b, Representative images showing the dynamic change in YAP and E-cad levels in PSCs reseeded on laminin-coated TCP. ce, Quantitative analysis of E-cad levels (c), pYAP levels, tYAP levels, pYAP/tYAP ratio (d) and NANOG levels (e) in plain-Re and BMS-Re PSCs (n = 3 biologically independent experiments; data are presented as means ± s.d.; statistical significance was calculated via a two-way ANOVA with Bonferroni’s multiple comparisons). fh, Size (f), YAP staining (g) and YAP phosphorylation level (h) of EBs, which were formed from reseeded PSCs in uncoated 96-well flat TCPs. EBs grew for 2 days (f) and 3 days (g and h). (f: n = 100 EBs from three biologically independent experiments; data are presented as means ± standard error of the mean; statistical significance was calculated via a two-tailed Student’s t-test; g: scale bar, 100 µm; h: n = 6 biologically independent experiments; data are presented as means ± s.d.; statistical significance was calculated via a two-tailed Student’s t-test; the value of the plain-Re group was set as 1). i, YAP staining of EBs, which were formed by PSCs derived from BMS and plain substrates in a V-bottom culture plate for 5 days to achieve a similar EB diameter. Scale bar, 100 μm. j, Representative images of teratomas formed in mice by the injection of preconditioned PSCs. k, Representative histological images and volume of teratomas derived from injected PSCs. Scale bar, 250 μm. n = 3 biologically independent experiments; data are presented as means ± standard error of the mean; statistical significance was calculated via a two-way ANOVA with Bonferroni’s multiple comparisons test. Source data
Extended Data Fig. 1
Extended Data Fig. 1. Enhanced naivety of PSCs on BMS.
a. Real-time PCR array analysis of naive and primed pluripotent gene expression in PSCs on different substrates. b. Representative fluorescence microscopic image of SSEA1 (green) and nuclei (blue) of PSCs on Plain and BMS substrate (Images represent the results from 6 independent experiments; Scale bar, 100 μm). c. Quantitative analysis of the percentage of SSEA1+/SSEA4– cell population in day-5 PSCs on different substrates (n = 6 biologically independent experiments; Data presented as means ± SD.; Statistical significance was calculated via two-tailed Student’s t test). d. Heat map of real-time PCR array screening of germ layer differentiation associated genes in day-5 PSCs. Percentage of NANOGhi (e) and STELLAhi (f) PSC covered area compared to the whole area of corresponding motifs (n = 4; Statistical significance was calculated via two-way ANOVA with Bonferroni’s multiple comparisons test). g. Analysis of intensity of NANOG in cells located in BSCR+ areas with different counts. h. Comparison of NANOG intensity of PSCs located in Concave+ and Concave- motifs with one out of 18 directions fitting BSCR (BSCR 1) and without BSCR (BSCR 0). i. Quantification of the proportion of NANOGhi cells located at BSCR 0 and BSCR 1 areas in and outside Concave motifs (n = 4 biologically independent experiments; Data presented as means ± SD.; Statistical significance was calculated via two-tailed Student’s t test). Source data
Extended Data Fig. 2
Extended Data Fig. 2. Primed-to-naive reversion of PSCs on BMS.
Representative images and quantitative analysis of PSC necrosis (a) and apoptosis (b) in BSCR+ and BSCR- areas at day 0 (9 h post cell seeding; n = 8 images for necrosis and n = 10 images for apoptosis) and day 3 (n = 10 images for necrosis and n = 5 images for apoptosis; Data presented as means ± SD.; Statistical significance was calculated via two-tailed Student’s t test; N.S. statistically non-significance). c. Detection of NANOG-GFPhi nPSCs on BSCR+ area of BMS from 12 h to 39 h post cell seeding. d. Expansion of NANOG-GFPhi nPSCs from BSCR+ to BSCR- areas. The outlines of BSCR+ areas were illustrated with yellow dash lines. Images in a-d represent the results from 3 independent experiments. Scale bar, 100 μm. Source data
Extended Data Fig. 3
Extended Data Fig. 3. PSC naivety and proliferation activity on different substrates.
Representative fluorescence images of Ki67+ proliferating cells, NANOG-GFPhi naive PSCs in BSCR+ and BSCR- areas of BMS, and on Plain substrate (Images represent the results from 3 independent experiments. Scale bar, 100 μm). The outlines of BSCR+ areas were illustrated with yellow dash lines. 1i-PSCs, Mixed PSCs (Naive:Primed = 1:4 in number) were maintained under primed PSC culture condition in 1i medium. 2i/L-PSCs used as positive control were cultured under naive PSC culture condition in 2i/L medium.
Extended Data Fig. 4
Extended Data Fig. 4. Quantification of PSC naivety and proliferation activity on different substrates.
The NANOG-GFPhi proportion, cell density and percentage of Ki67+ proliferating cells in BSCR + , BSCR- areas of BMS and on Plain substrate within 48 h post cell seeding were quantified based on the fluorescence images from 5 biologically independent experiments (For GFPhi cell analysis over time, 1i-PSCs group: nBSCR+=35, nBSCR-=26, nPlain = 25; Mixed PSCs group: nBSCR+=27, nBSCR-=26, nPlain = 26; 2i/L-PSCs group: n = 25. For cell density analysis, 1i-PSCs group: nBSCR+=44, nBSCR-=32, nPlain = 30; Mixed PSCs group: nBSCR+=33, nBSCR-=33, nPlain = 32; 2i/L-PSCs group: n = 30. For Ki67+ cell analysis, 1i-PSCs group: nBSCR+=35, nBSCR-=26, nPlain = 25; Mixed PSCs group: nBSCR+=27, nBSCR-=27, nPlain = 26; 2i/L-PSCs group: n = 25. Data presented as means ± SD.; Statistical significance was calculated via two-way ANOVA with Bonferroni’s multiple comparisons test, for effect of BSCR; *BSCR+ vs. Plain, #BSCR+ vs. BSCR-). Source data
Extended Data Fig. 5
Extended Data Fig. 5. Topography of microbowl and microgroove substrates.
a. Height map reconstruction of substrates based on optical profilometry analysis. b. Representative scanning electron microscopic images of microstructured substrates. Confocal microscopic images of tilted-view (c) and side-view (d) of laminin-coated microbowls and microgrooves (Images represent the results from 3 independent experiments; Scale bar, 200 μm).
Extended Data Fig. 6
Extended Data Fig. 6. Primed-to-naive reversion and expansion of PSCs on substrates with uniform motifs.
a. Representative confocal microscopic images of NANOG-GFP PSCs on microbowls and microgrooves with different BSCR counts at day 3 after cell seeding (Fluorescence images represent the results from 3 independent experiments; Scale bar, 100 μm). b. Quantification of the area fraction of GFPhi in GFP+ cells and MFI of GFP in PSCs growing on microbowls and microgrooves with different BSCR counts for 3 days (n = 5 biologically independent experiments; Data presented as means ± SD.; Statistical significance was calculated via two-way ANOVA with Bonferroni’s multiple comparisons test, for effects of BSCR and time). c. the area fraction of GFPhi in GFP+ cells and MFI of GFP in day-3 PSCs on BSCR+ microbowls with and without E-cad, RAC1 and YAP inhibition (n = 5 biologically independent experiments; Data presented as means ± SD.; Statistical significance was calculated via one-way ANOVA with Bonferroni’s multiple comparisons). d. Quantification of fraction and MFI of SSEA1+ PSCs on BSCR+ and BSCR- microbowls (n = 5 biologically independent experiments; Data presented as means ± SD.; Statistical significance was calculated via one-way ANOVA with Bonferroni’s multiple comparisons). e. Representative confocal images showing the alteration of TBX3 and STELLA in PSCs on microbowls with different BSCR counts (Images represent the results from 3 independent experiments; Scale bar, 50 μm). Cell cycle progression patterns of day-1 (f) and day-3 (g) PSCs on microbowls with different BSCR counts (n = 3 biologically independent experiments; Data presented as means ± SD.; Statistical significance was calculated via two-way ANOVA with Bonferroni’s multiple comparisons test). h. Expansion curves of PSCs on microbowls with different BSCR counts over time (n = 3 biologically independent experiments; Data presented as means ± SD.; Statistical significance was calculated via two-way ANOVA with Bonferroni’s multiple comparisons test, for effects of BSCR and time). Source data
Extended Data Fig. 7
Extended Data Fig. 7. PSC compaction on BMS.
a. Representative top- and side-view of confocal microscopic images and quantitative analysis showing spatial organization of PSC colonies in crater and channel like areas on BMS. Cell nuclei were stained with DAPI (Data acquired from 9 biologically independent experiments; BSCR+ Crater: n = 9, BSCR+ Channel: n = 90, BSCR- Channel: n = 36; Data presented as means ± SD.; Statistical significance was calculated via one-way ANOVA with Bonferroni’s multiple comparisons test). b. Imaging analysis of cell density, top-view colony area, and flow cytometry analysis of relative cell size (Cell density: ncolony=15 and 20 for Plain and BMS substrate from 10 biologically independent samples; Colony area: n = 8 and 22, ncolony=53 and 91 for Plain and BMS substrate from 10 biologically independent samples, respectively; Cell size: n = 3 biologically independent samples; Data presented as means ± SD.; Statistical significance was calculated via two-tailed Student’s t test; N.S., non-significance). c. The flow cytometry analysis of NANOG of day-5 PSCs on Plain substrates with and without high cell seeding density (5×10⁴ /cm2). TCP, 2i/L control was set as 1 (n = 3 biologically independent experiments; Data presented as means ± SD.; Statistical significance was calculated via one-way ANOVA with Bonferroni’s multiple comparisons test; N.S., non-significance). Representative confocal images and (d) the quantification of pMLC2 level (e) in PSC colonies at BSCR+ and BSCR- areas (Scale bar, 100 μm; ncolony = 19 from 3 biologically independent experiments; Data presented as means ± SD.; Statistical significance was calculated via two-tailed Student’s t test). f. Comparison of pMLC2 levels of cells using flow cytometry (n = 3 biologically independent experiments; Data presented as means ± SD.; Statistical significance was calculated via two-tailed Student’s t test). g. Contractility assay based on the PSCs/collagen gel size measurement. The cells were harvested from Plain and BMS with/without E-cad inhibition (n = 3 biologically independent experiments; Data presented as means ± SD.; Statistical significance was calculated via two-tailed Student’s t test). Source data
Extended Data Fig. 8
Extended Data Fig. 8. Primed-to-naive reversion of human PSCs on BMS.
a. Representative bright field (BF) image and laser scanning microscopic images of human PSCs on BMS at day 5. The nuclei (blue) were stained with Hoechst 33342 to visualize the whole population, and the NANOGhi (green) and STELLAhi (red) cells were filtered out to show the naive population (Images represent the results from 3 independent experiments; Scale bars, 100 μm). b. Flow cytometry analysis of naive markers (CD7, NANOG) and primed markers (CD24, CD57, CD90) of day-8 human PSCs adapted in RSeT medium on TCP (Pos ctrl), on Plain and BMS substrates in IPS-brew medium (n = 3 biologically independent experiments; Data presented as means ± SD.; Statistical significance was calculated via one-way ANOVA with Bonferroni’s multiple comparisons test). c. Flow cytometry analysis of relative cell size (based on FSC-A value) of human PSCs cultured on Plain and BMS surfaces (n = 6 biologically independent experiments; Data presented as means ± SD.; Statistical significance was calculated via two-tailed Student’s t test). d. Quantitative analysis of E-cad+ fractions and E-cad expression levels of cells under different culture conditions (n = 3 biologically independent experiments; Data presented as means ± SD.; Statistical significance was calculated via one-way ANOVA with Bonferroni’s multiple comparisons test). e. The level of NANOG in day-8 human PSCs on BMS with and without E-cad, RAC1 and FAK inhibition. The level of untreated PSCs was set as 1 (n = 3 biologically independent experiments; Data presented as means ± SD.; Statistical significance was calculated via one-way ANOVA with Bonferroni’s multiple comparisons). Source data
Extended Data Fig. 9
Extended Data Fig. 9. YAP activation and cell proliferation in response to culture on a BMS substrate.
a. Real-time PCR array analysis of YAP signaling suppressor and target genes in day-3 PSCs from Plain and BMS substrates. b. The representative flow cytometry dot plots showing the phosphorylated level of AmotL1 (S262) in PSCs in the indicated conditions. c. Percentage of cells in the phases of cell cycle on Plain and BMS substrates (n = 3 biologically independent experiments; Data presented as means ± SD.; Statistical significance was calculated via two-way ANOVA with Bonferroni’s multiple comparisons test). d. Growth curve of PSCs on Plain and BMS substrates, with and without RAC1 inhibition (n = 9 biologically independent experiments; Data presented as means ± SD.; Statistical significance was calculated via two-way ANOVA with Bonferroni’s multiple comparisons test; N.S, non-significance). e. Alkaline phosphatase staining of PSCs on Plain and BMS at indicated time points. Image represents the results from 3 biologically independent experiments. Scale bar, 5 mm. Source data
Extended Data Fig. 10
Extended Data Fig. 10. BMS stabilizes naive pluripotency of PSCs.
a. Morphology of reseeded PSCs pre-conditioned on different substrates. Scale bar, 50 μm. b. Proliferation curves of reseeded PSCs. n = 4 biologically independent experiments; Data presented as means ± SD.; Statistical significance was calculated via two-way ANOVA for main effect of substrate. Western blot analysis of E-cad (c), pYAP (at S127) and tYAP levels (d) in day-3 EBs formed by reseeding PSCs pre-conditioned on Plain (Plain-Re) and BMS (BMS-Re) substrates. GAPDH was used as a loading control. e. Cell cycle progression patterns of day-3 EBs (n = 3 biologically independent experiments; Data presented as means ± SD.; Statistical significance was calculated via two-way ANOVA with Bonferroni’s multiple comparisons test). Source data

References

    1. Nichols, J. & Smith, A. I. Naive and primed pluripotent states. Cell Stem Cell4, 487–492 (2009). - PubMed
    1. Fu, J., Warmflash, A. & Lutolf, M. P. Stem-cell-based embryo models for fundamental research and translation. Nat. Mater.20, 132–144 (2021). - PMC - PubMed
    1. Davidson, K. C., Mason, E. A. & Pera, M. F. The pluripotent state in mouse and human. Development142, 3090–3099 (2015). - PubMed
    1. Weinberger, L., Ayyash, M., Novershtern, N. & Hanna, J. H. Dynamic stem cell states: naive to primed pluripotency in rodents and humans. Nat. Rev. Mol. Cell Biol.17, 155–169 (2016). - PubMed
    1. Dong, C. et al. Derivation of trophoblast stem cells from naive human pluripotent stem cells. eLife9, e52504 (2020). - PMC - PubMed