. 2024 Oct;9(10):2506-2521.
doi: 10.1038/s41564-024-01769-9. Epub 2024 Aug 12.

Staphylococcus aureus adapts to exploit collagen-derived proline during chronic infection

Affiliations

Staphylococcus aureus adapts to exploit collagen-derived proline during chronic infection

Andreacarola Urso et al. Nat Microbiol. 2024 Oct.

Abstract

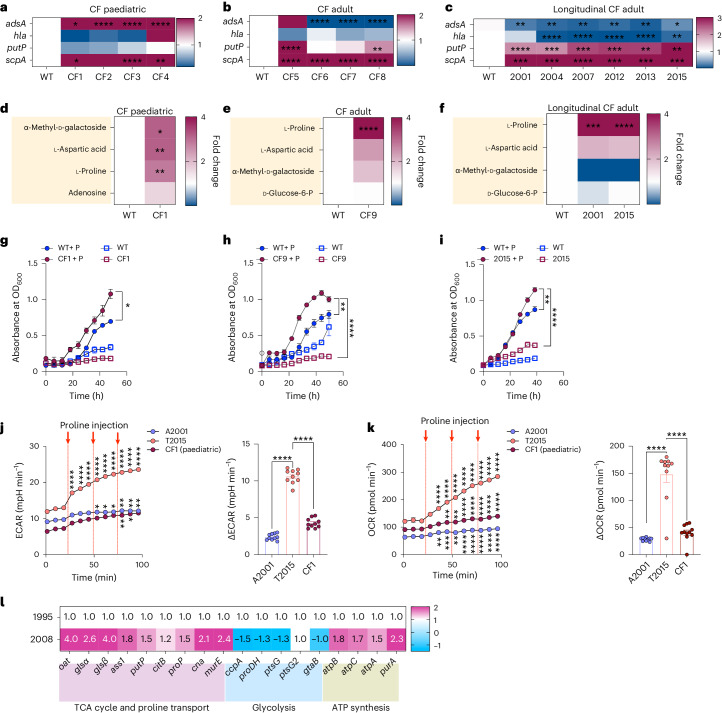
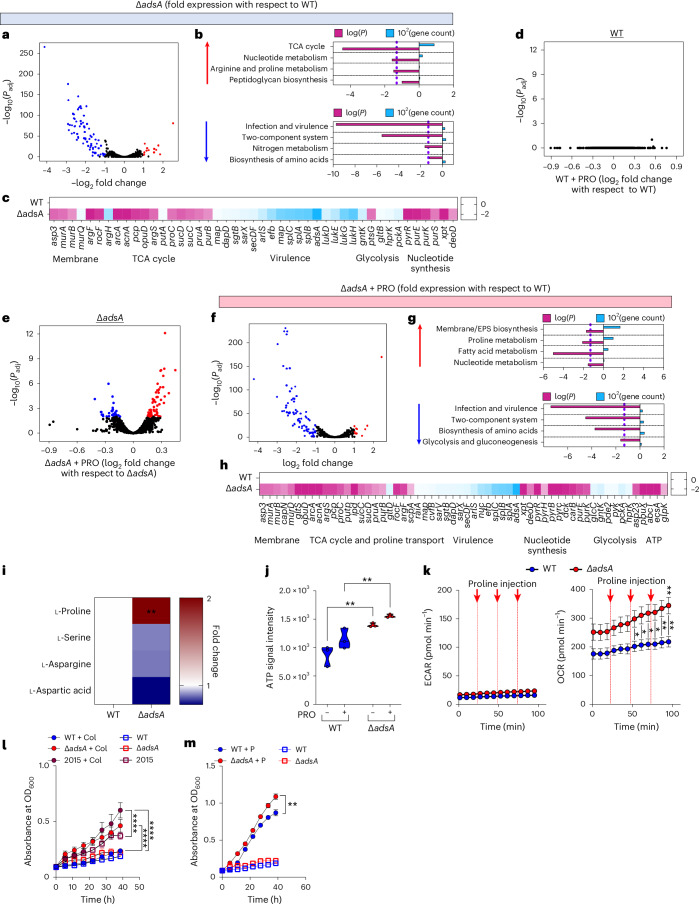
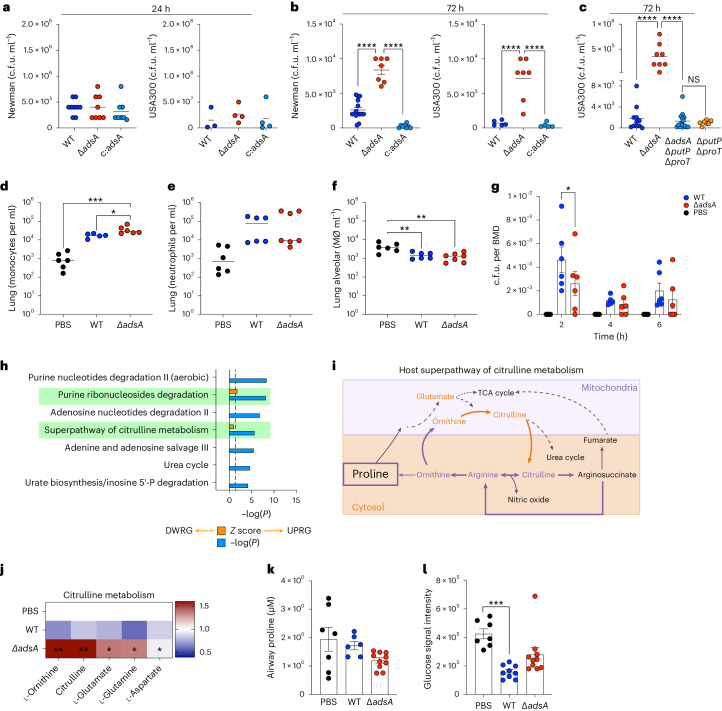
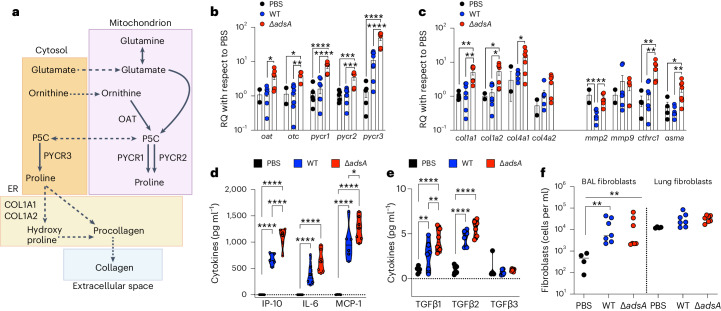
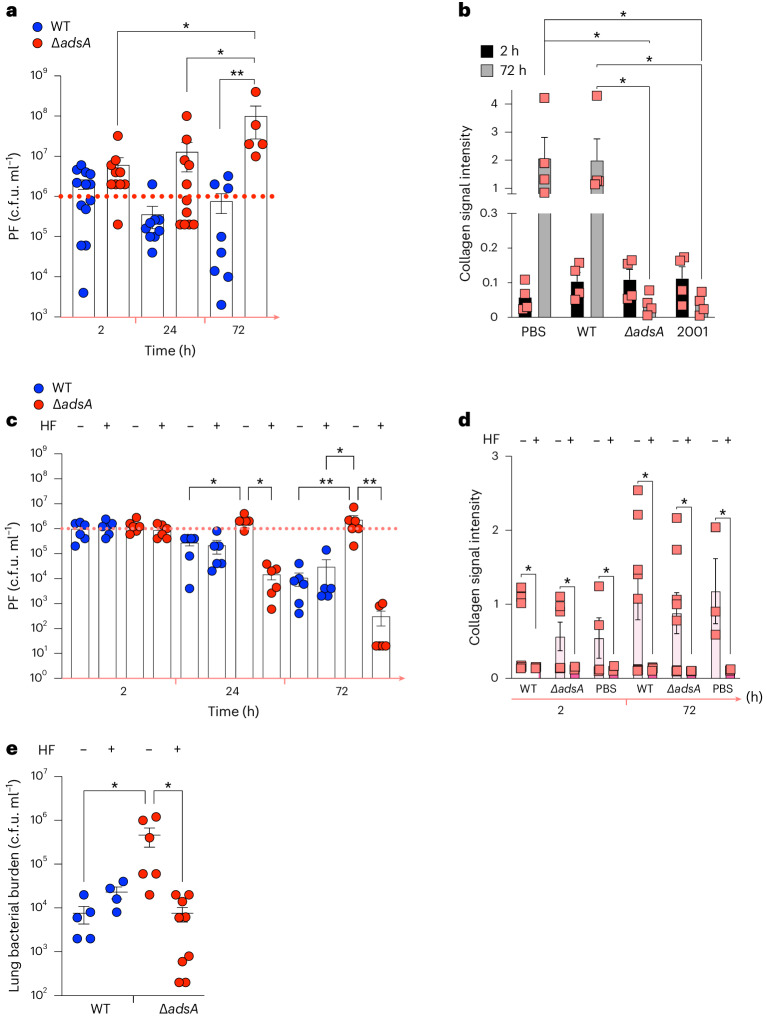
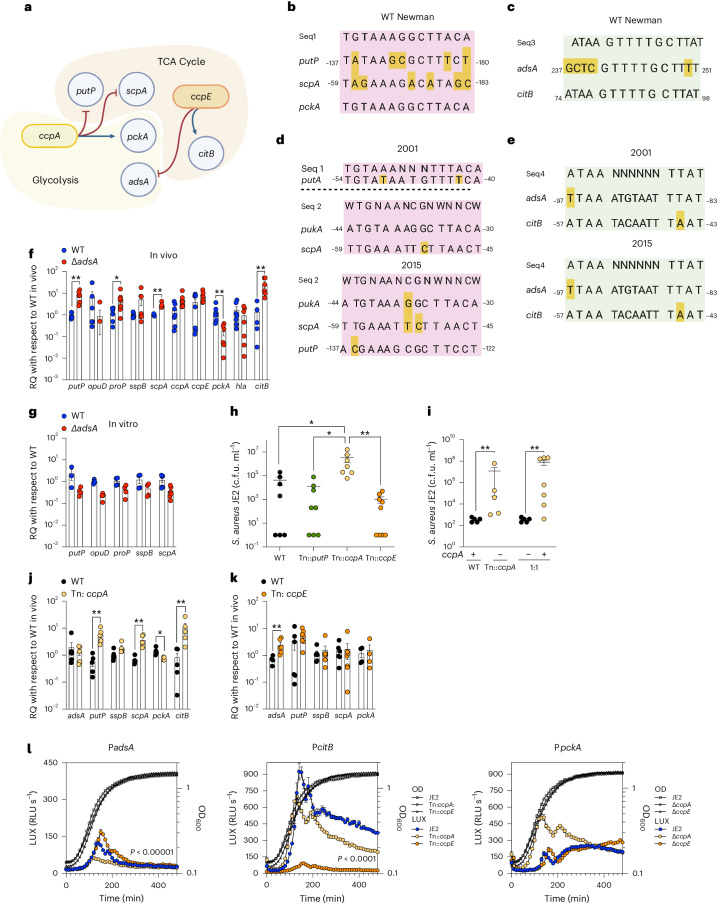
Staphylococcus aureus is a pulmonary pathogen associated with substantial human morbidity and mortality. As vaccines targeting virulence determinants have failed to be protective in humans, other factors are likely involved in pathogenesis. Here we analysed transcriptomic responses of human clinical isolates of S. aureus from initial and chronic infections. We observed upregulated collagenase and proline transporter gene expression in chronic infection isolates. Metabolomics of bronchiolar lavage fluid and fibroblast infection, growth assays and analysis of bacterial mutant strains showed that airway fibroblasts produce collagen during S. aureus infection. Host-adapted bacteria upregulate collagenase, which degrades collagen and releases proline. S. aureus then imports proline, which fuels oxidative metabolism via the tricarboxylic acid cycle. Proline metabolism provides host-adapted S. aureus with a metabolic benefit enabling out-competition of non-adapted strains. These data suggest that clinical settings characterized by airway repair processes and fibrosis provide a milieu that promotes S. aureus adaptation and supports infection.


Conflict of interest statement

The authors declare no competing interests.

Figures

Fig. 1
Fig. 1. Patterns of gene expression in S. aureus clinical isolates.
ac, In vitro RNA transcripts from S. aureus CF clinical isolates grown in LB, all with respect to WT strain Newman control. Representative isolates CF1, CF9, 2001 and 2015 were chosen for functional studies. df, Utilization of carbon sources shown as fold change with respect to WT strain Newman control. ‘CF paediatric’ initial isolates (a,d) and ‘CF adult’ adapted isolates (b,e), from distinct patients; longitudinal CF adult adapted isolates (c,f) from single adult patient. gi, Growth in CDM ± 100 μM proline. P, proline. Please note that (g), (h) and (i) refer to individual strains as labelled on the figure. j,k, Metabolic activity presented as ECAR (j) and OCR (k) upon sequential injections of 100 μM proline comparing initial paediatric (CF1) and later (A2001, T2015) isolates. mpH, milli-pH. l, RNA-seq data of early (1995) and late (2008) CF isolates from one patient over 13 years shown as fold change with respect to 1995. Data presented as mean ± s.e.m. In ak, n = 3. Significance determined by *P < 0.05; **P < 0.01; ***P < 0.001 ****P < 0.0001. In ac, one-way ANOVA with selective t-Student comparison; in df, two-tailed t-Student with Kolmogorov–Smirnov test comparing OCR increase upon proline injection; in gj, two-way ANOVA with Dunnett’s multiple comparisons.
Fig. 2
Fig. 2. Metabolic activity of adsA mutant strain increases in response to proline in vitro.
Bulk RNA sequencing of S. aureus WT and ΔadsA Newman grown in LB. ac, Differential gene expression (a), pathway analysis (b) and fold change (c) in ΔadsA gene expression with respect to WT control. d,e, Differential gene expression of WT (d) and ΔadsA (e) in LB + 100 μM proline. fh, Differential gene expression (f), pathway analysis (g) and fold changes (h) in ΔadsA genes with respect to WT control grown in LB + 100 μM proline. EPS, extracellular polysaccharide. i, Utilization of carbon sources shown as fold change with respect to WT control. j, ATP generated by WT control and ΔadsA strains grown in LB ± 100 μM proline. k, Carbon flux upon sequential injections of 100 μM proline in WT control and ΔadsA presented as ECAR and OCR. l,m, Growth of S. aureus WT control, ΔadsA and 2015 in ±30 μg ml−1 collagen (Col) (l) and growth of WT control and ΔadsA in ±100 μM proline (P) (m). Data graphics: in a and df, all dots represent individual genes; red dots, upregulated; blue dots, downregulated. In b and g, pink bars represent log(P); vertical dotted line is P < 0.05 threshold of significance; blue bars represent number of genes associated to the respective pathway. Data presented as mean ± s.e.m. In ah, n = 2; in im, n = 3. Significance determined by *P < 0.05, **P < 0.01, ***P < 0.001, ****P < 0.0001. In ah, Wald test generated P values (<0.05), and absolute log2 fold changes (>1f (greater than onefold)) were called differentially expressed; in i, j, l and m, two-way ANOVA with Dunnett’s multiple comparisons; in k, two-tailed t-Student with Kolmogorov–Smirnov test.
Fig. 3
Fig. 3. S. aureus infection induces citrulline metabolism in host airways.
Pulmonary infection following intranasal inoculation with S. aureus WT Newman or USA300 LAC controls, ΔadsA or ΔadsA-complemented (c:adsA) strains. a,b, Lung bacterial burden at 24 h (a) and 72 h (b) post infection. c, Pulmonary infection following intranasal inoculation with S. aureus WT Newman or USA300 LAC controls, ΔadsA or ΔadsAΔputPΔproT strains. NS, not significant. df, Lung monocytes (d), neutrophils (e) and alveolar macrophages (f). g, Bacterial uptake and killing of murine BMDM assessed at 2, 4 and 6 h. h, Unbiased pathway analysis of BAL metabolites 72 h post-infection. Blue bars, P value; vertical dotted line is <0.05 threshold of significance; orange bars, Z-score or ratio of ΔadsA respective to WT; solid line is threshold of change. DWRG, downregulation; UPRG, upregulation. i, Schematic diagram of citrulline and proline metabolism in host; dotted arrows, translocation; solid arrows, conversion; in bold are critical metabolites/precursors to proline. j, BAL metabolites (selected from Supplementary Fig. 2a) related to citrulline metabolism, and targeted. k,l, Quantification of proline (k) and glucose (l) shown as fold change with respect to PBS. Data presented as mean ± s.e.m. from n = 3 in a; n = 4 in bf and hl; n = 2 in g. Significance determined by *P < 0.05, **P < 0.01, ***P < 0.001, ****P < 0.0001. In af and jl, one-way ANOVA with Tukey’s multiple comparisons; in g, two-way ANOVA with Dunnett’s multiple comparisons; in h, two-tailed t-Student and fold change (Z > 0.5).
Fig. 4
Fig. 4. S. aureus activate genes involved in collagen synthesis.
a, Schematic diagram of proline and collagen biosynthesis pathways in the host. Dotted arrows, translocation; solid arrows, conversion; in bold are critical enzymes. b,c, At 72 h following intranasal inoculation with S. aureus Newman WT control or ΔadsA, we monitored host lung RNA transcripts associated with proline biosynthesis (b) and collagen biosynthesis turnover via mmps and markers of fibroblast activity (c). d,e, Selected cytokines were quantified in BAL. f, CD140a+SCA-1+ fibroblast numbers in lung and BAL fibroblasts quantified. Data presented as mean ± s.e.m. In bf, n = 3. Significance determined by *P < 0.05, **P < 0.01, ***P < 0.001, ****P < 0.0001. In bf, one-way ANOVA with Tukey’s multiple comparisons.
Fig. 5
Fig. 5. Inhibition of collagen synthesis suppresses S. aureus growth.
Primary murine fibroblasts were infected with S. aureus WT control or ΔadsA strains. a,b, Bacterial burden (a) and quantification of collagen by ELISA (b) in primary murine fibroblasts culture supernatants following infection with WT control, ΔadsA or clinical strains. c,d, Bacterial burden (c) and collagen quantification by ELISA (d) in primary murine fibroblast cultures treated with halofuginone, an inhibitor of collagen synthesis or vehicle (DMSO). e, Bacterial burden 72 h post-WT control or ΔadsA infection of mice treated with intranasal halofuginone or DMSO. Data presented as mean ± s.e.m. In ad, n = 6; in e, n = 3. Significance determined by *P < 0.05, **P < 0.01. In ad, two-way ANOVA with Brown–Forsythe test; in e, one-way ANOVA with Tukey’s multiple comparisons. PF, primary murine fibroblasts; HF, halofuginone.
Fig. 6
Fig. 6. CCR regulates S. aureus metabolism in the lung.
a, Schematic diagram of proposed CCR regulation of S. aureus consumption of collagen and proline. be, In silico identification of CRE binding sites using composite and verified consensus sequence targets for CcpA (Seq1, Seq2), known to regulate pckA, and CcpE (Seq3), known to regulate citB. CcpA homologous sequences in pink; CcpE homologous sequences in green. Putative consensus sequences in S. aureus Newman WT (accession number NC_009641.1) indicating CcpA regulation of putP, scpA and pckA (control) (b) and CcpE regulation of adsA and citB (control) (c); yellow highlighting, mismatch. Putative consensus sequences in S. aureus respiratory clinical isolates 2001 and 2015 indicating CcpA regulation of putP, scpA and pckA (control) (d) and CcpE regulation of adsA and citB (control) (e); yellow highlighting, mismatch. fk, Effects of CcpA and CcpE in mice infected with S. aureus WT Newman control and ΔadsA (f,g) or JE2 WT control and isogenic ccpA::Tn, ccpE::Tn and putP::Tn transposon mutants (hk) for collection of prokaryotic RNA and bacterial burden at 72 h. f,g, Transcripts from in vivo lungs (f) and respective in vitro inoculum (g) grown in LB. h,i, Lung bacterial burden (h) and bacterial in vivo competition (i). j,k, In vivo transcripts from ccpA::Tn (j) or ccpE::Tn (k) compared with a WT JE2 control in the lung. l, Activation of the adsA promoter detected using a LUX reporter expressed in ccpA::Tn, ccpE::Tn or JE2, shown as a function of bacterial growth (OD600). Data presented as mean ± s.e.m. In f, n = 4; in g and l, n = 3; in h, n = 4; in i, n = 5; in j and k, n = 4. Significance determined by P < 0.05, **P < 0.01, ***P < 0.001, ****P < 0.0001. In f, g, j and k, two-tailed multiple t-Student with Kolmogorov–Smirnov tests; in h, one-way ANOVA with Kruskal–Wallis comparisons; in i, Mann–Whitney test; in l, two-way ANOVA with Dunnett’s multiple comparisons.
Extended Data Fig. 1
Extended Data Fig. 1. Relative single carbon source consumption by S. aureus strains.
Utilization of carbon sources by CF clinical isolates (2001, 2015, CF1, CF9) and Newman adsA mutants shown as fold-change respective to Newman WT. b, Growth of S. aureus WT Newman and ΔadsA in CDM b, ± 100 μM hydroxyproline (HyP), c, ± 100 μM glycine (G), and c:adsA in d, CDM and e, CDM + proline. f, g, Newman and LAC plasmid stability in LB ± antibiotics. Mean ± SEM, n = 3. Significance determined by *P < 0.05; **P < 0.01; ***P < 0.001 ****P < 0.0001, (a) two-tailed t- Student with Kolmogorov-Smirnov test; (b-e) One-Way ANOVA with Tukey’s Multiple Comparisons; (f, g) Two- Way ANOVA with Dunnett’s Multiple Comparisons.
Extended Data Fig. 2
Extended Data Fig. 2. Impact of host generated adenosine on WT and ΔadsA mutant infection.
Pulmonary infection at 72 hours following intranasal inoculation with S. aureus WT Newman, ΔadsA or PBS. a, Untargeted metabolomics shown respective to PBS control, b, T regulatory cell (Tregs) count and c, relative expression of surface CD39 and CD73 ectonucleotidases on various immune cells. Pulmonary infection at 72 hours following intranasal inoculation of GFP FoxP3DTR mice with S. aureus WT Newman or ΔadsA and in vivo diphtheria toxin (DT)-mediated Treg depletion. d, Total lung Tregs e, bacterial burden f, immune cell populations and g, CD39 and CD73 expression upon treatment with DT or vehicle. Pulmonary infection at 72 hours following intranasal inoculation of CD73-KO mice with S. aureus WT Newman or ΔadsA. h, Bacterial burden in WT and CD73-KO mouse lungs. i, Weight loss, j-o, lung immune cells, and p, untargeted metabolomics on BAL fluid respective to PBS. Mean ± SEM, (a, b) n = 3; (c-e, h-p) n = 3; (f) n = 4. Significance determined by *P < 0.05; **P < 0.01; ***P < 0.001 ****P < 0.0001; (a-h. j-p) One- Way ANOVA with Tukey’s Multiple Comparisons; (f). Two-Way ANOVA with Dunnett’s Multiple Comparisons.
Extended Data Fig. 3
Extended Data Fig. 3. Consumption of components of the citrulline superpathway by ∆adsA and CF clinical isolates.
Growth of a-e, WT, ΔadsA, f-j, A2001 and T2015 in a, f, complete defined medium (CDM) lacking b, g, proline, c, h, histidine, d, i, glutamate or e, j, arginine. Mean ± SEM from (a-j) n = 4.
Extended Data Fig. 4
Extended Data Fig. 4. Induction of collagen synthesis by WT and ∆adsA infection.
Induction of host responses by pulmonary infection with S. aureus WT or ΔadsA strains at 72 h. a, BAL fluid matrix metalloprotease and b, pro-inflammatory cytokines quantified by ELISA and plotted with respect to PBS. Primary murine fibroblasts were freshly isolated and cultured for infection with S. aureus WT or ΔadsA strains and treatment with collagen inhibitor halofuginone (HF) ex vivo. c, Representative lung sections stained with Masson’s Trichrome (purple) and hematoxylin and eosin staining (pink) from a PBS control, WT Newman and ΔadsA infection at 72 h are shown. Scale bar= 50 μM; m = 40x. d, Representative confocal images of primary fibroblasts (PF) stained with vimentin and DAPI to confirm population purity (scale bar 40μm). e, Cell count of live PF with trypan blue at each infection timepoint in vitro. S. aureus growth in f, g, LB only and h, i, CDM + P supplemented with HF or vehicle. In vivo intranasal 72- hour lung infection with S. aureus WT or ΔadsA strains in mice treated with HF or vehicle. j, BAL and k, lung total cells from infected mice treated with HF or vehicle. Mean ± SEM from (a-b) n = 3; (e) n = 4; (f-i) n = 6; (j-k) n = 6. (a-b, d-j) Two-Way ANOVA with Dunnet’s Multiple Comparison.
Extended Data Fig. 5
Extended Data Fig. 5. Impact of adsA and CCR on skin infection.
a, RNA transcripts from S. aureus Atopic Dermatitis (AD) clinical isolates. b, Carbon utilization assays shown as fold-change increase w.r.t. WT. c, Growth curves in CDM ± 100 μM proline. d, Bacterial burden and e, skin lesion size at 6 days post-infection from a 5 mm punch biopsy of skin infected with S. aureus Newman. f, Host RNA transcripts from 5 mm punch biopsy of skin infected with S. aureus Newman. g-h, Putative cre binding sites in S. aureus atopic dermatitis (AD) isolates AD2 and AD8 for ccpA in silico (black dashes, mismatches; red dots, matches) using binding sequences Sequence 1 and Sequence 2 (red). i, Bacterial burden at 6 days post- infection from a 5 mm punch biopsy of skin infected with WT JE2, ccpA::Tn, ccpE::Tn, putP::Tn. Data presented as mean ± SEM, (a-c) n = 3, (d,e) n = 4, (i) n = 3. Significance determined by *P < 0.05, **P < 0.01, ***P < 0.001, ****P < 0.0001, (a,c,e) Two-Way ANOVA with Dunnett’s Multiple Comparisons, (b,d) two-tailed t- Student with Kolmogrov-Smirnov test (f,i) One-Way. ANOVA with Tukey’s Multiple Comparisons.
Extended Data Fig. 6
Extended Data Fig. 6. FACS Gating strategies.
a, Neutrophils, alveolar macrophages and monocytes; b, lymphocytes and T regulatory cells; and c, lung fibroblasts.

References

    1. Diep, B. A. & Otto, M. Methicillin-resistant Staphylococcus aureus infection is associated with increased mortality. Future Microbiol.7, 189–191 (2012). - PubMed
    1. Manara, S. et al. Whole-genome epidemiology, characterisation, and phylogenetic reconstruction of Staphylococcus aureus strains in a paediatric hospital. Genome Med.10, 82 (2018). - PMC - PubMed
    1. Giulieri, S. G. et al. Niche-specific genome degradation and convergent evolution shaping. Elife 11, 10.7554/eLife.77195 (2022). - PMC - PubMed
    1. Schneewind, O. & Missiakas, D. Sortases, surface proteins, and their roles in Staphylococcus aureus disease and vaccine development. Microbiol. Spectr.10.1128/microbiolspec.PSIB-0004-2018 (2019). - PMC - PubMed
    1. Raghuram, V. et al. Species-wide phylogenomics of the Staphylococcus aureus. Microbiol. Spectr.10, e0133421 (2022). - PMC - PubMed

MeSH terms