. 2024 Dec;31(12):1838-1847.
doi: 10.1038/s41594-024-01365-9. Epub 2024 Aug 12.

Structural basis of LRPPRC-SLIRP-dependent translation by the mitoribosome

Affiliations

Structural basis of LRPPRC-SLIRP-dependent translation by the mitoribosome

Vivek Singh et al. Nat Struct Mol Biol. 2024 Dec.

Erratum in

Abstract

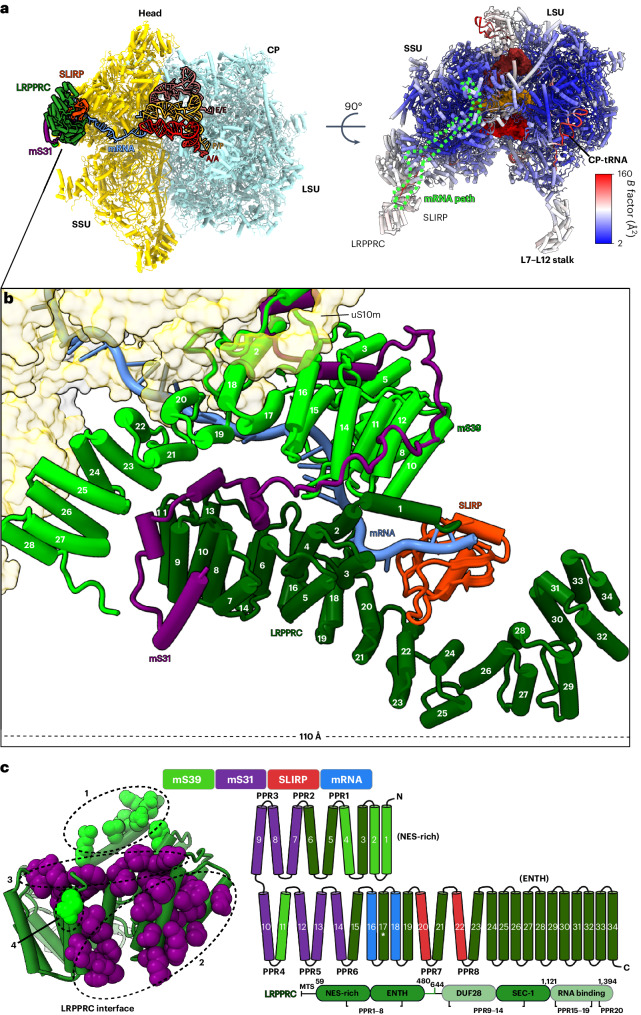
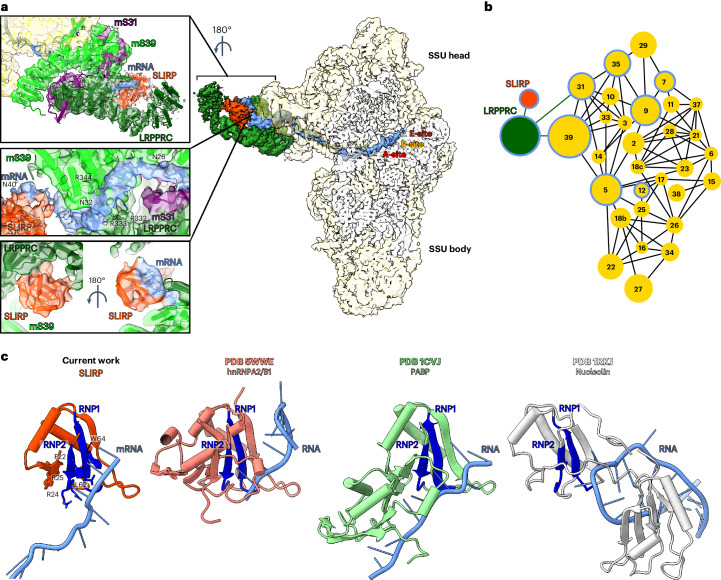
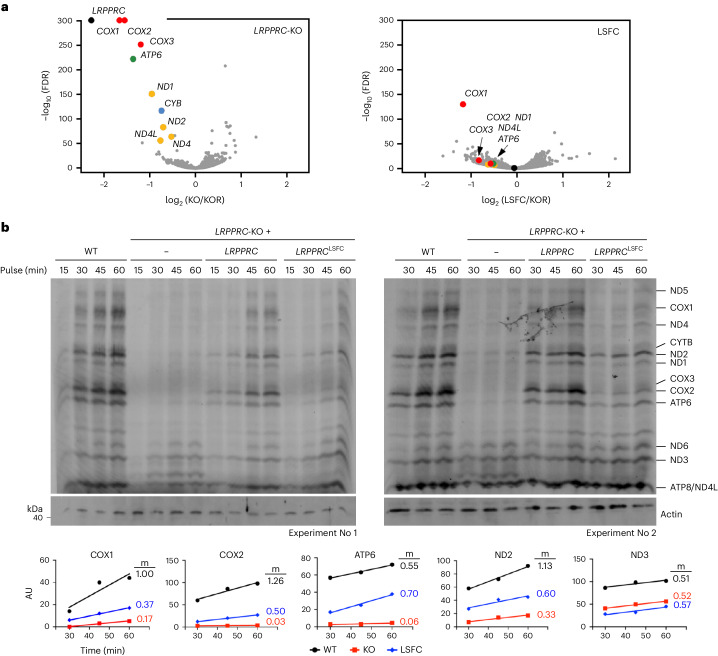
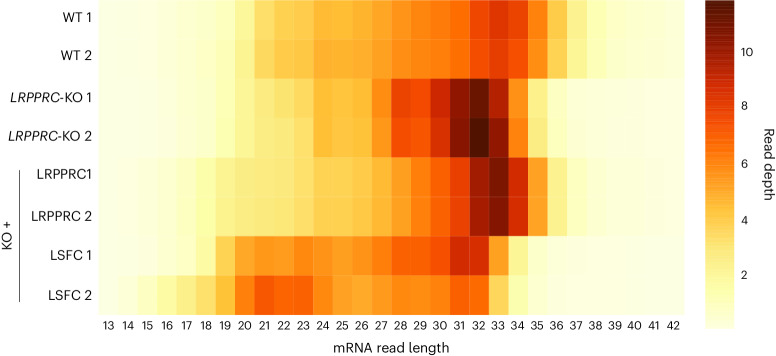
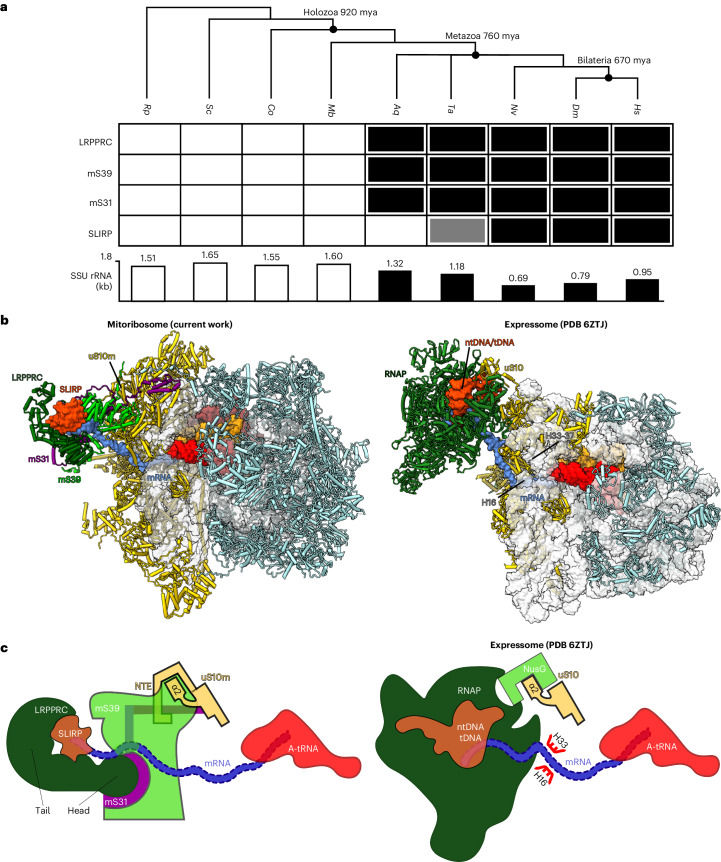
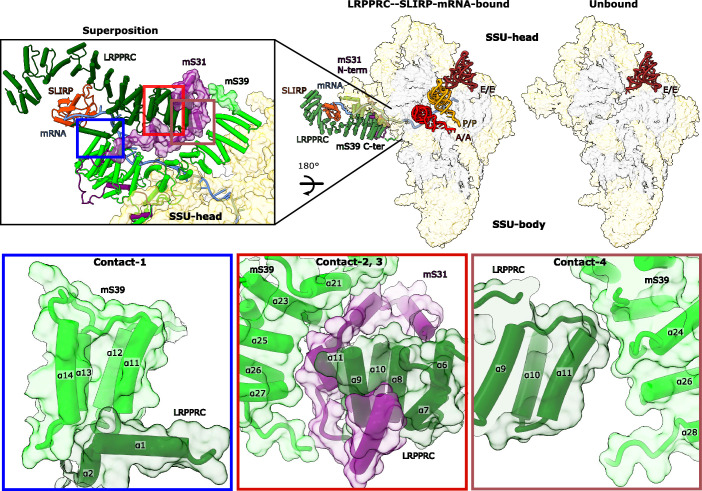
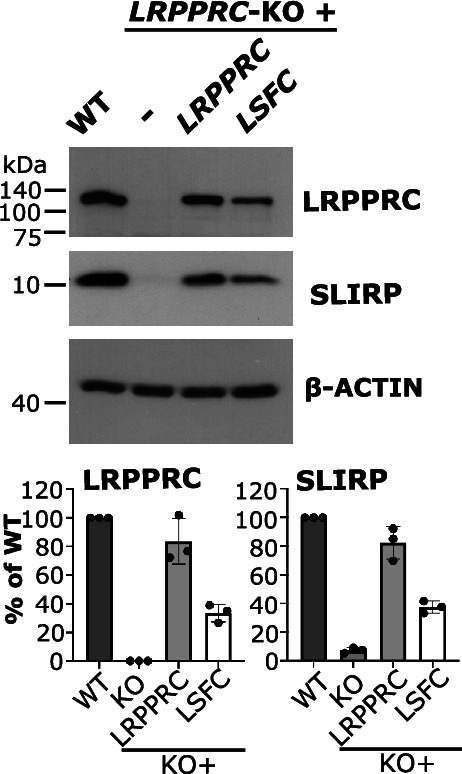
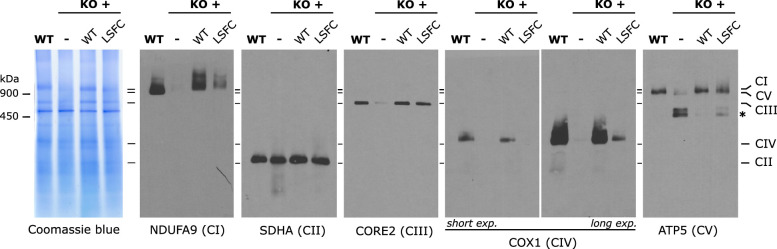
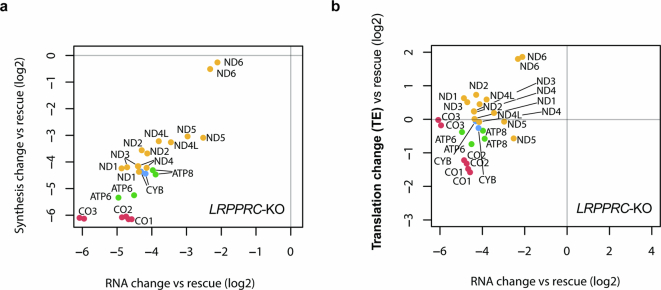
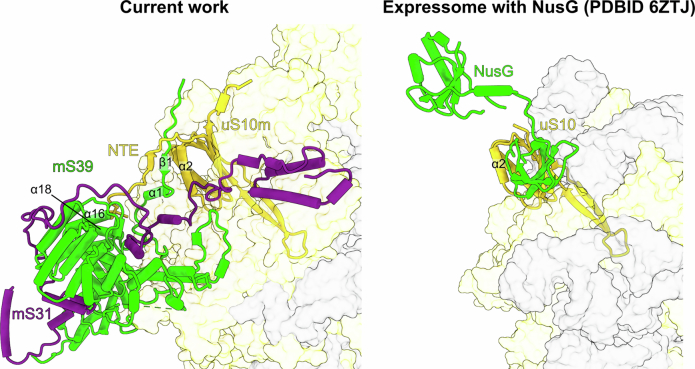
In mammalian mitochondria, mRNAs are cotranscriptionally stabilized by the protein factor LRPPRC (leucine-rich pentatricopeptide repeat-containing protein). Here, we characterize LRPPRC as an mRNA delivery factor and report its cryo-electron microscopy structure in complex with SLIRP (SRA stem-loop-interacting RNA-binding protein), mRNA and the mitoribosome. The structure shows that LRPPRC associates with the mitoribosomal proteins mS39 and the N terminus of mS31 through recognition of the LRPPRC helical repeats. Together, the proteins form a corridor for handoff of the mRNA. The mRNA is directly bound to SLIRP, which also has a stabilizing function for LRPPRC. To delineate the effect of LRPPRC on individual mitochondrial transcripts, we used RNA sequencing, metabolic labeling and mitoribosome profiling, which showed a transcript-specific influence on mRNA translation efficiency, with cytochrome c oxidase subunit 1 and 2 translation being the most affected. Our data suggest that LRPPRC-SLIRP acts in recruitment of mitochondrial mRNAs to modulate their translation. Collectively, the data define LRPPRC-SLIRP as a regulator of the mitochondrial gene expression system.


Conflict of interest statement

Competing interests: The authors declare no competing interests.

Figures

Fig. 1
Fig. 1. Structure of mitoribosome with LRPPRC–SLIRP bound to mRNA.
a, Model overview of the mitoribosome in complex with LRPPRC–SLIRP. Right, top view of the model colored by atomic B factor (Å2). tRNAs are shown in surface representation (red, orange and brown). The mRNA path (light green) is highlighted. b, A close-up view of the interactions within the mitoribosome in complex with LRPPRC–SLIRP–mRNA. LRPPRC associates with mS31–m39 through a ring-like structure (α2–α18), together forming a corridor for the handoff of the mRNA from SLIRP. c, Contact sites between LRPPRC and mS31–mS39 (within 4-Å distance); view from the interface. Right, schematic diagram showing the topology of LRPPRC consisting of 34 helices. Colors represent engagement in interactions with mS39 (light green), mS31 (purple), SLIRP (orange) and mRNA (blue). The position of the LSFC variant (A354V) is indicated with an asterisk on α17.
Fig. 2
Fig. 2. Overview of density for LRPPRC, SLIRP and mRNA and their interactions with SSU proteins.
a, The density map for LRPPRC (dark green), SLIRP (orange) and mRNA (blue) on the SSU is shown in the center. Left, the model and map for mS39–LRPPRC–SLIRP and corresponding bound mRNA residues in close-up views. Arginine residues involved in mRNA binding are indicated. Bottom, close-up views of SLIRP with its associated densities for LRPPRC and mRNA. For clarity, the map for SLIRP was low-pass filtered to 6-Å resolution. b, Schematic of protein–protein interactions, where node size corresponds to relative molecular mass. Nodes of proteins involved in mRNA binding are encircled in blue. c, RRM-containing proteins (SLIRP, heterogeneous nuclear ribonucleoproteins A1/B2 (hnRNPA1/B2; PDB 5WWE), poly(A)-binding protein (PABP; PDB 1CVJ) and nucleolin (PDB 1RKJ)) are shown in complex with RNA, with RNP1 and RNP2 submotifs colored blue.
Fig. 3
Fig. 3. Mechanism of LRPPRC–SLIRP-mediated mRNA binding and stabilization.
a, Whole-cell RNAseq normalized by read depth, comparing LRPPRC-KO cells to KO cells reconstituted with WT LRPPRC (KOR) or the LSFC variant (A354V). The results are the average of two biological replicates. The differentially expressed mitochondrial transcripts are color-coded: coding for subunits of cytochrome c oxidase in red, NADH dehydrogenase in yellow, coenzyme Q–cytochrome c oxidoreductase in blue and ATP synthase (CV) in green. b, Metabolic labeling with [35S]methionine of newly synthesized mitochondrial polypeptides for the indicated times, in the presence of emetine to inhibit cytosolic protein synthesis, in whole HEK293T WT, LRPPRC-KO cells and KO cells reconstituted with LRPPRC (KO + WT) or the LSFC variant (KO + LSFC). Bottom, representative plots of [35S]methionine incorporation into specific polypeptides in WT or LRPPRC-KO cells. AU, arbitrary units. The images were quantified in two independent experiments. Source data
Fig. 4
Fig. 4. The average length of protected mRNA is decreased in the absence of WT LRPPRC.
Heat map showing the length distribution for reads mapping to mitochondrial mRNAs in duplicates of whole HEK293T WT, LRPPRC-KO and KO cells reconstituted with WT LRPPRC or its LSFC variant.
Fig. 5
Fig. 5. Formation of the mitoribosome in complex with LRPPRC–SLIRP and 70S RNA in complex with RNAP.
a, Phylogenetic analysis showing the correlation between the acquisition of LRPPRC, SLIRP, mS31 and mS39 and the reduction in rRNA in Metazoa. Black rectangles indicate the presence of proteins; gray indicates uncertainty about the presence of an ortholog. Hs, Homo sapiens; Ds, Drosophila melanogaster; Nv, Nematostella vectensis; Ta, Trichoplax adhaerens; Aq, Amphimedon queenslandica (sponge); Mb, Monosiga brevicollis (unicellular choanoflagellate); Co, Capsaspora owczarzaki (protist); Sc, Saccharomyces cerevisiae (fungus); Rp, Rickettsia prowazekii (alphaproteobacterium). Dating in million years ago (mya) is based on ref. . b, Model of the mitoribosome in complex with LRPPRC–SLIRP compared to the uncoupled model of the expressome from E. coli. c, Schematic representation indicating the association of mRNA-delivering proteins in the mitoribosome compared to the NusG-coupled expressome.
Extended Data Fig. 1
Extended Data Fig. 1. Cryo-EM data processing and map quality for mS39-LRPPRC-SLIRP region.
a. A representative micrograph with picked particles (green circles) and 2D class averages with mixed LSU and monosome particles (marked by red boxes). b. Focused 3D-classification with signal subtraction using mask around mS39-LRPPRC-SLIRP region (transparent orange) of mitoribosome particles to identify LRPPRC-SLIRP containing monosome particles (2.86 Å overall resolution), followed by masked refinement with signal subtraction on mS39-LRPPRC-SLIRP region to improve the local resolution. b. The mS39-LRPPRC-SLIRP map is shown colored by local resolution (top left) and by proteins assigned to the density (top right). The consensus map (bottom left) and the masked refined maps shown as a single composite map colored by local resolution (bottom right). c. Fourier shell correlation curves for the post-subtraction masked refined mS39-LRPPRC-SLIRP map (top) and individual masked refined maps. e. Map comparison for LRPPRC region between our work and EMD-11397. The map has been Gaussian filtered for better visibility. f. Density shown as mesh around helices α5-6, 8 and 11-12. Corresponding regions are indicated with arrows in panel (e).
Extended Data Fig. 2
Extended Data Fig. 2. AlphaFold model and TLSMD analysis of LRPPRC.
a. The modeled region of LRPPRC (residues 64-644) is compared with the AlphaFold model (AF-P42704-F1) of full length (right). The modeled region is green, the unmodeled is white. The position of LSFC variant (A354V) is indicated. b. TLSMD analysis of the AlphaFold model of LRPPRC up to 20 TLS segments (N). Graph plots least-square residuals assigned per-residue confidence score values (pLDDT) versus those calculated by TLS analysis. c. Model colored by TLS segments for N = 4. Regions between the segments with high pLDDT values correspond to loop regions and are shown as spheres d. Comparison of AlphaFold assigned versus calculated pLDDT values at N = 4.
Extended Data Fig. 3
Extended Data Fig. 3. Multiple sequence alignment between SLIRP and representative RRM containing proteins.
Alignment of SLIRP with representative RRM family proteins, heterogeneous nuclear ribnucleoproteins (hnRNPA2/B1), poly-A binding protein (PABP), and nucleolin shows conservation of submotifs RNP1 and RNP2 highlighted and indicated by corresponding residue numbers in SLIRP. Individual sequences are marked by residue numbers in the beginning and end and residues are colored by present identity.
Extended Data Fig. 4
Extended Data Fig. 4. LRPPRC-SLIRP contacts with the SSU head.
Comparison of SSU from mitoribosome:LRPPRC-SLIRP complex with SSU from E-site tRNA bound monosome. Zoom-in shows N-terminal region of mS31 and C-terminal loop of mS39 (in surface) stabilized by LRPPRC. Contact regions of LRPPRC with mS31 and mS39 shown in cartoon and surface representations.
Extended Data Fig. 5
Extended Data Fig. 5. Reconstitution of the LRPPRC-KO with wild-type and LSCF variants of LRPPRC.
Immunoblot analysis to estimate the steady-state levels of LRPPRC and SLIRP in the indicated cell lines. β-ACTIN was used as a loading control. The images were digitized, and the specific signals were quantified using the histogram function of Adobe Photoshop from three independent repetitions. Source data
Extended Data Fig. 6
Extended Data Fig. 6. Mitochondrial protein synthesis is altered in LRPPRC-KO cells.
Blue-native PAGE analyses in WT, LRPPRC-KO, and KO + WT cell lines. Intact respiratory complexes were extracted from purified mitochondria using 1% n-dodecyl β-D-maltoside. An asterisk indicates the ATPase (CV) F1 module that accumulates due to the low levels of the mitochondrion-encoded FO module subunits ATP6 and ATP8. Source data
Extended Data Fig. 7
Extended Data Fig. 7. Mitochondrial translation efficiency is differentially affected in LRPPRC-KO cells.
a, Change in inferred protein synthesis (mitoribosome profiling coverage) versus RNA abundance in LRPPRC-KO cells compared to LRPPRC-reconstituted cells (“rescue”). Mitoribosome profiling data and RNA-seq data were normalized using a mouse lysate spike-in control. b, Translation efficiency (TE) was calculated from spike-in normalized values (mitoribosome profiling / RNA-seq) and again plotted against change in RNA abundance so that the x-axis values are the same as in (a). Biological replicates are shown as individual points. The mitochondrial transcripts are color-coded as in Fig. 3.
Extended Data Fig. 8
Extended Data Fig. 8. Close-up view of uS10m interactions with mS31-mS39.
Interface between uS10m with mS31-mS39 that serve as the platform for LRPPRC-SLIRP is similar to that formed between uS10 and NusG that binds RNA polymerase in bacterial expressome.

Similar articles

Cited by

References

    1. Singh, V. et al. Mitoribosome structure with cofactors and modifications reveals mechanism of ligand binding and interactions with L1 stalk. Nat. Commun.15, 4272 (2024). - PMC - PubMed
    1. Amunts, A., Brown, A., Toots, J., Scheres, S. H. & Ramakrishnan, V. The structure of the human mitochondrial ribosome. Science348, 95–98 (2015). - PMC - PubMed
    1. Ast, T. et al. METTL17 is an Fe-S cluster checkpoint for mitochondrial translation. Mol Cell84, 359–374.e8 (2024). - PMC - PubMed
    1. Brown, A. et al. Structures of the human mitochondrial ribosome in native states of assembly. Nat. Struct. Mol. Biol.24, 866–869 (2017). - PMC - PubMed
    1. Sissler, M. & Hashem, Y. Mitoribosome assembly comes into view. Nat. Struct. Mol. Biol.28, 631–633 (2021). - PubMed