. 2024 Aug 13;22(1):482.
doi: 10.1186/s12951-024-02686-z.

Crosslinked-hybrid nanoparticle embedded in thermogel for sustained co-delivery to inner ear

Affiliations

Crosslinked-hybrid nanoparticle embedded in thermogel for sustained co-delivery to inner ear

Neeraj S Thakur et al. J Nanobiotechnology. .

Abstract

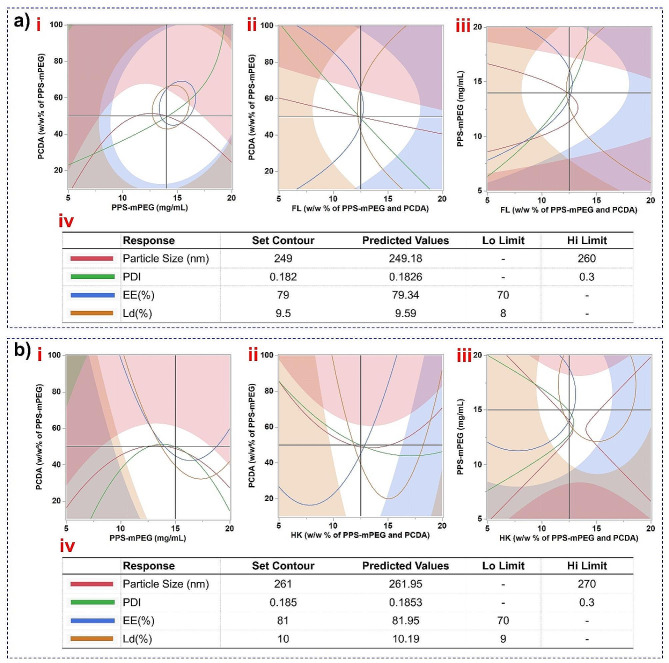
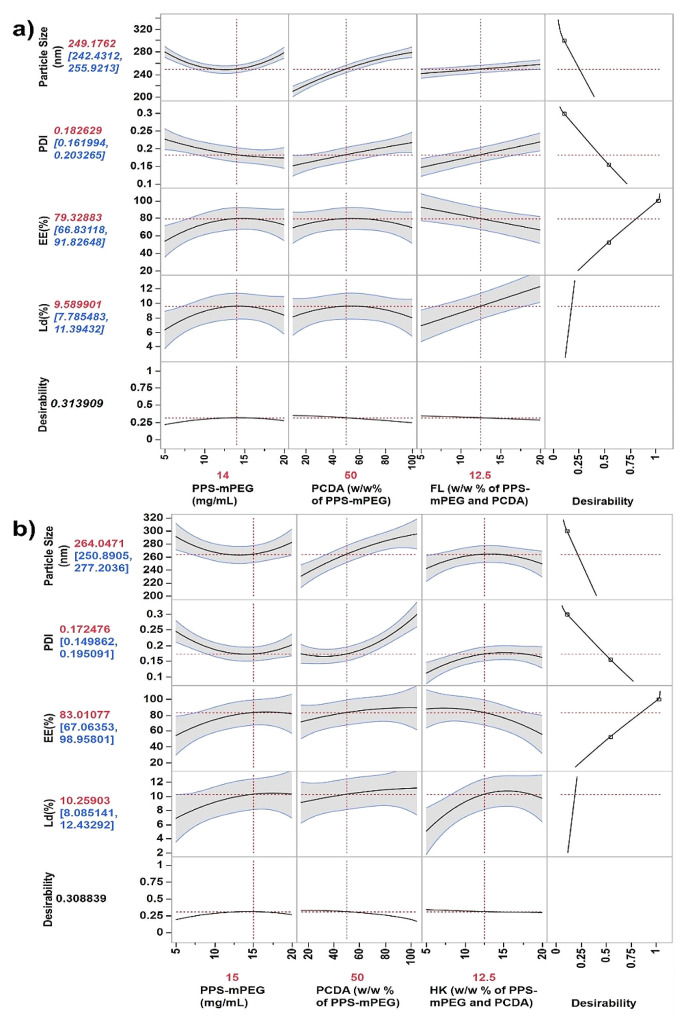
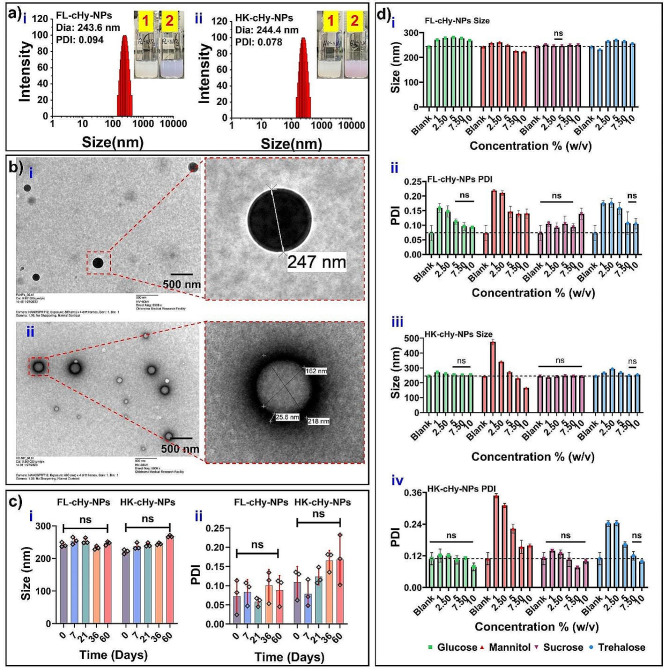
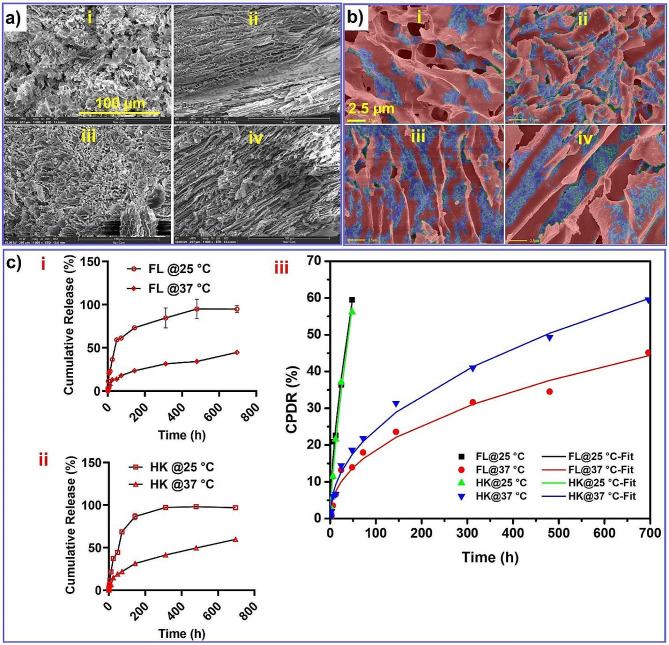
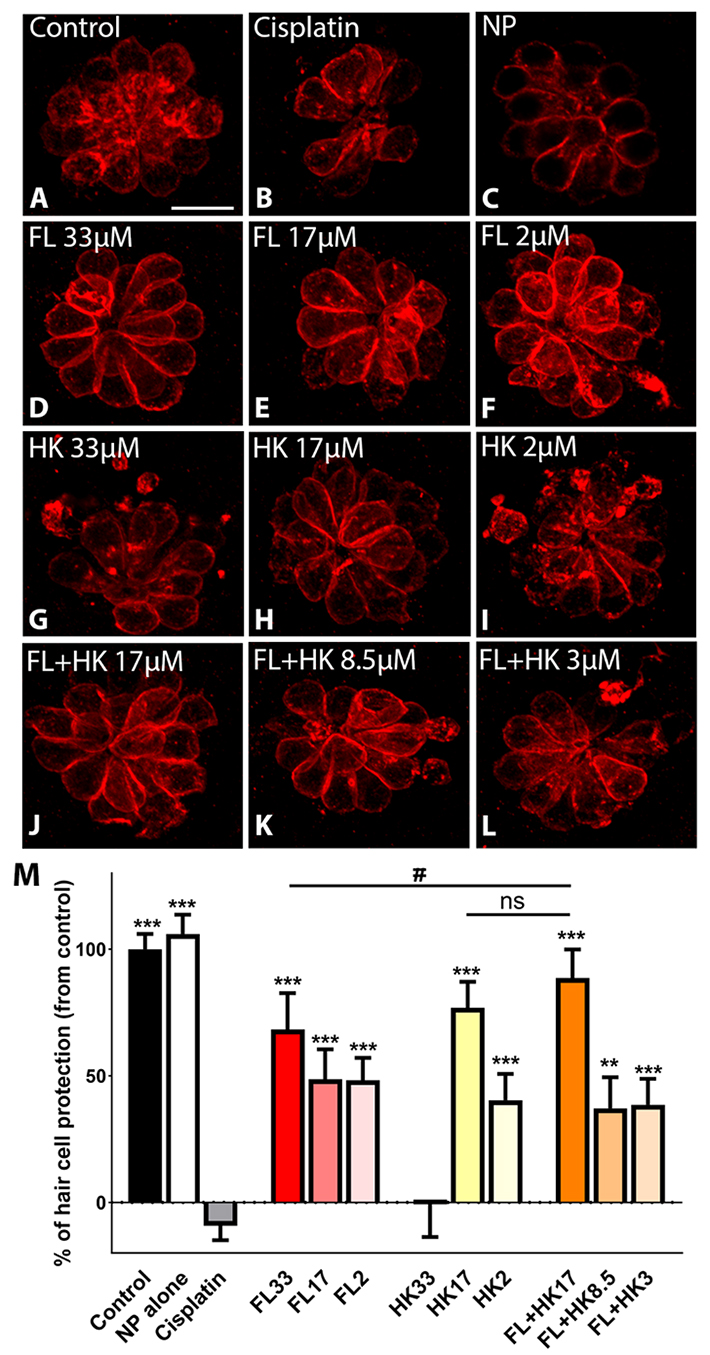
Treatment-induced ototoxicity and accompanying hearing loss are a great concern associated with chemotherapeutic or antibiotic drug regimens. Thus, prophylactic cure or early treatment is desirable by local delivery to the inner ear. In this study, we examined a novel way of intratympanically delivered sustained nanoformulation by using crosslinked hybrid nanoparticle (cHy-NPs) in a thermoresponsive hydrogel i.e. thermogel that can potentially provide a safe and effective treatment towards the treatment-induced or drug-induced ototoxicity. The prophylactic treatment of the ototoxicity can be achieved by using two therapeutic molecules, Flunarizine (FL: T-type calcium channel blocker) and Honokiol (HK: antioxidant) co-encapsulated in the same delivery system. Here we investigated, FL and HK as cytoprotective molecules against cisplatin-induced toxic effects in the House Ear Institute - Organ of Corti 1 (HEI-OC1) cells and in vivo assessments on the neuromast hair cell protection in the zebrafish lateral line. We observed that cytotoxic protective effect can be enhanced by using FL and HK in combination and developing a robust drug delivery formulation. Therefore, FL-and HK-loaded crosslinked hybrid nanoparticles (FL-cHy-NPs and HK-cHy-NPs) were synthesized using a quality-by-design approach (QbD) in which design of experiment-central composite design (DoE-CCD) following the standard least-square model was used for nanoformulation optimization. The physicochemical characterization of FL and HK loaded-NPs suggested the successful synthesis of spherical NPs with polydispersity index < 0.3, drugs encapsulation (> 75%), drugs loading (~ 10%), stability (> 2 months) in the neutral solution, and appropriate cryoprotectant selection. We assessed caspase 3/7 apopototic pathway in vitro that showed significantly reduced signals of caspase 3/7 activation after the FL-cHy-NPs and HK-cHy-NPs (alone or in combination) compared to the CisPt. The final formulation i.e. crosslinked-hybrid-nanoparticle-embedded-in-thermogel was developed by incorporating drug-loaded cHy-NPs in poloxamer-407, poloxamer-188, and carbomer-940-based hydrogel. A combination of artificial intelligence (AI)-based qualitative and quantitative image analysis determined the particle size and distribution throughout the visible segment. The developed formulation was able to release the FL and HK for at least a month. Overall, a highly stable nanoformulation was successfully developed for combating treatment-induced or drug-induced ototoxicity via local administration to the inner ear.

Keywords: Artificial intelligence image analysis; Central composite design; Deep learning model; Drug-induced-ototoxicty; Hearing loss; Local drug delivery; Long-term drug delivery; Otoprotectants; Quality-by-design approach; Redox homeostasis; Zebrafish model.


Conflict of interest statement

NST and VA declare the following competing financial interest(s): A US patent has been applied for the majority of this research work under application no. 63/509,823.

Figures

Fig. 1
Fig. 1
(a) Schematic representation for the synthesis of FL-cHy-NPs and HK-cHy-NPs. (b) Schematic of the arrangement of PCDA, PPS-mPEG2000, and encapsulated drugs (FL or HK) and subsequent crosslinking during the synthesis of FL-cHy-NPs and HK-cHy-NPs.
Fig. 2
Fig. 2
Actual vs. predicted plots of responses after performing all 16 experiments and running the Standard Least Square model with emphasis on effective screening. (a) Plots for FL-cHy-NPs. (b) Plots for HK-cHy-NPs. The responses for each NP preparation are presented as ‘i’ Particle Size (nm), ‘ii’ PDI, ‘iii’ EE (%), and ‘iv’ Ld (%). In each response plot, the black dots are showing the response values obtained after performing the experiments, the blue line is representing the null hypothesis and a red slanted line as alternative hypothesis. The fainted red area around the red line representing the 95% confidence region. Here, RMSE; Root Mean Squared Error showing the average measured values of difference between the predicted and actual values. RSq (R2) values under each response plot showing how close the data fitted to the regression line (alternative hypothesis).
Fig. 3
Fig. 3
Contour profiler graphs showing effect of various factors on the responses during the synthesis of (a) FL-cHy-NPs, and (b) HK-cHy-NPs. In each figure contour graphs showing responses against factors ‘i’ PCDA vs. PPS-mPEG2000, ‘ii’ PCDA vs. Drug (FL or HK), and ‘iii’ PPS-mPEG2000 vs. Drug (FL or HK) are shown. Table ‘iv’ shows the set values, predicted values, low (Lo) limit and high (Hi) limit of each response fixed during the preparation of the plots. The shaded portions of each plots show the responses beyond the fixed Lo or Hi limits. The horizontal and vertical black lines showing the optimized conditions of the respective factor where they are crossing ‘y’ and ‘x’ axis, respectively
Fig. 4
Fig. 4
Prediction profiler graphs showing optimized conditions calculated by the quadradic model using the central composite design (CCD) by JMP® pro software. The values denoted by red color showing the most optimal condition and predicted results (responses: particle size, PDI, encapsulation efficiency (EE%), and drug loading (Ld%), while the value denoted by blue color shows the range of the response values at the same synthesis conditions. The graph shows conditions for optimal synthesis of  (a) FL-cHy-NPs (b) HK-cHy-NPs.
Fig. 5
Fig. 5
(a) Size distribution graphs of (i) FL-cHy-NPs and (ii) HK-cHy-NPs showing the average diameter of the NPs and polydispersity index (PDI). The inset figure shows the visual appearance of the colloidal solution of the same cHy-NPs before (1) and after (2) crosslinking. (b) Figures showing TEM images of developed cHy-NPs confirm their spherical shape and intact integrity (i) TEM Image of the FL-cHy-NPs (scale 500 nm) and inset; enlarged NP. (ii) TEM image of the HK-cHy-NPs (scale 500 nm) and inset; enlarged NP. (c) The stability of synthesized FL-cHy-NPs and HK-cHy-NPs in the colloidal solution stored at 4° C: (i) the average size and (ii) PDI values of the cHy-NPs at 0, 7, 21, 36 and 60 days of storage. The means of each sample were compared using one-way ANOVA and using Dunnett multiple comparison post hoc test with a family-wise alpha threshold confidence level of 0.05 (95% confidence interval). Here, all the values are showing no difference (ns; p > 0.05) with each other suggesting the stability of the cHy-NPs at different time points. (d) Effect of various cryoprotectants on the size and PDI of the NP formulations after lyophilization. The graphs are showing effect of cryoprotectants on the (i) size of FL-cHy-NPs, (ii) PDI values of FL-cHy-NPs, (iii) size of HK-cHy-NPs, and (iv) PDI value of HK-cHy-NPs. The data were analyzed using two-way ANOVA and the group sample means were compared with the blank sample (non-lyophilized) by Dunnett’s multiple comparison post-hoc test. The family-wise alpha threshold confidence level was adjusted to 0.05 (95% confidence interval) during the analysis. Here, all the values are showing no difference (p = ns > 0.05) with each other suggesting the optimal concentration of the respective cryoprotectant to stabilize the NP preparation (size and PDI).
Fig. 6
Fig. 6
Cellular internalization of the synthesized cHy-NPs. (a) The fluorescence intensity graph of cellular internalization of C6-cHy-NPs in presence of various pathway inhibitors (CPZ, MβCD, AML, and GNT) in comparison with untreated cells. The CPZ showed significant inhibition of fluorescence intensity whereas, no significant difference in fluorescence intensities is showing up in MβCD, AML, and GNT treated groups. (b) The graph shows effect of various concentrations of pathway inhibitors on cellular internalization of NPs. No significant effect of MβCD, AML, and GNT was shown at the concentration from 2.5–75 µg/mL. (c) The graph shows time-dependent cellular internalization of C6-cHy-NPs at different time intervals (0.25, 1, 2, 3, 4, 5, 6, 8, 10, 24, and 48 h). (d) The fluorescence microscopy images of HEI-OC1 cells (scale 100 μm) after incubation with C6-cHy-NPs at different time intervals (i) 0.5 h, (ii) 1 h, (iii) 2 h, (iv) 3 h, (v) 4 h and (vi) 5 h); (green fluorescence, using FITC filter). The blue stain is showing the nuclei of the cells stained by HOECHST-33342 (using DAPI filter). [Data in the graphs were compared using two-way ANOVA and each group was compared with the ‘blank’ or control group “C” by applying Šidák multiple comparisons post-hoc tests. The family-wise alpha threshold confidence level was adjusted to 0.05 (95% confidence interval) during the analysis. (Here p ≥ 0.05 = ns, not significant)].
Fig. 7
Fig. 7
(a) Cell growth of various treatment groups determined using MTT assay. The treatment group of those treated with the combination of FL-cHy-NPs and HK-cHy-NPs did not show a significant reduction in cell growth compared to the control (p > 0.05, ns). Also, the combined formulation protects the cells from both 50 and 100 µM concentrations of CisPt. Therefore, the treatment of cells with the combination of FL-cHy-NPs and HK-cHy-NPs has significant protection efficacy against CisPt-induced cell death compared to FL-cHy-NPs or HK-cHy-NPs alone. (b) Intracellular ROS generation assay showing significant ROS generation in the CisPt only treated cells. Significantly low ROS generation was shown in the cells that were treated with FL-cHy-NPs, HK-cHy-NPs, and STS. (c) The graph showing the fluorescence intensity of MitoSOX reagent corresponded to mitochondrial superoxide generation. The assay suggested significantly low superoxide generation in FL-cHy-NPs and FL/HK-cHy-NPs treatment groups. (d) The graph showing caspase 3/7 activation in different treatment groups. The caspase 3/7 activation was significantly lowered in the cells that were treated with FL-cHy-NPs, HK-cHy-NPs, and STS. The data were compared using two-way ANOVA and each group was compared with the control group “C” by applying Dunnett’s multiple comparisons post-hoc tests. The family-wise alpha threshold confidence level was adjusted to 0.05 (95% confidence interval) during the analysis. (For 'a-d' data presented as Mean ± SD; Asterisk; ****, p < 0.0001; **, p < 0.005; *, p < 0.05; ns=not significant). (e) The western blot analysis of the samples after respective treatment with FL-cHy-NPs and HK-cHy-NPs alone or in combination. The blots are showing proteins associated with apoptotic caspase-3 pathway and control β-actin. (f) The fluorescence microscopy images (scale bar 100 μm) are showing the effect of developed FL-cHy-NPs and HK-cHy-NPs individually, and in combination on the CisPt-induced generation of ROS in HEI-OC1 cells. The first column is showing the cell nuclei stained with HOECHST-33342. The second column is showing the fluorescence of DCF (a ROS marker) in the cells. The third column is showing the cells under transmittance light. The fourth column is showing the overlay of columns 1, 2, and 3. The last column is showing a graph of the ratio of normalized intensities of overall cells and the cells that were producing ROS (getting stained with DCFH-DA). (i) Blank untreated cells: the cells that were not treated with any of the NP preparation or CisPt did not show significant ROS generation. The ratio of normalized intensities of total cells and DCF-stained cells was 1.71 ± 0.08. (ii) CisPt treated cells: The cells that were treated with CisPt only showed significant ROS generation. The ratio of normalized intensities of total cells and DCF-stained cells was 0.99 ± 0.21. (iii) FL-cHy-NPs and CisPt treated cells: the cells treated with FL-cHy-NPs and CisPt did not show significant ROS generation. The ratio of normalized intensities of total cells and DCF-stained cells was 1.71 ± 0.04. (iv) HK-cHy-NPs and CisPt treated cells: the cells treated with HK-cHy-NPs and CisPt did not show significant ROS generation. The ratio of normalized intensities of total cells and DCF-stained cells was 1.63 ± 0.35. (v) FL-cHy-NPs, HK-cHy-NPs and CisPt treated cells: the cells treated with FL-cHy-NPs, HK-cHy-NPs and CisPt did not show significant ROS generation. The ratio of normalized intensities of total cells and DCF-stained cells was 1.66 ± 0.29. (vi) STS and CisPt treated cells: the cells treated with STS and CisPt did not show significant ROS generation. The ratio of normalized intensities of total cells and DCF-stained cells was 1.53 ± 0.23. (g) The fluorescence microscopy images (scale bar 50 μm) showed the effect of developed FL-cHy-NPs and HK-cHy-NPs individually and in combination on the CisPt-induced HEI-OC1 cells cytotoxicity. The first column is showing the cell nuclei stained with HOECHST-33342. The second column is showing the fluorescence of PI (a dead cell marker) in the cells. The third column is showing the cells under transmittance light. The fourth column is showing the overlay of columns 1, 2, and 3. The last column is showing a graph of the ratio of normalized intensities of overall cells and the cells that were dead (getting PI stain). (i) Blank untreated cells: the cells that were not treated with any of the NP preparations or CisPt did not show significant cell death. The ratio of normalized intensities of total cells and PI-stained cells was 2.62 ± 0.05. (ii) CisPt treated cells: The cells that were treated with CisPt only showed significant cell death. The ratio of normalized intensities of total cells and PI-stained cells was 1.06 ± 0.08. (iii) FL-cHy-NPs and CisPt treated cells: the cells treated with FL-cHy-NPs and CisPt did not show significant cell death. The ratio of normalized intensities of total cells and PI-stained cells was 1.87 ± 0.22. (iv) HK-cHy-NPs and CisPt treated cells: the cells treated with HK-cHy-NPs and CisPt did not show significant cell death. The ratio of normalized intensities of total cells and PI-stained cells was 1.97 ± 0.15. (v) FL-cHy-NPs, HK-cHy-NPs and CisPt treated cells: the cells treated with FL-cHy-NPs, HK-cHy-NPs and CisPt did not show significant cell death. The ratio of normalized intensities of total cells and PI-stained cells was 2.41 ± 0.0.32. (vi) STS and CisPt treated cells: the cells treated with STS and CisPt did not show significant cell death. The ratio of normalized intensities of total cells and PI-stained cells was 2.03 ± 0.02. [The microscopy data were compared using one-way ANOVA and each group was compared with the control group (c; CisPt only treated) by applying Dunnett’s multiple comparisons posthoc test. The family-wise alpha threshold confidence level was adjusted to 0.05 (95% confidence interval) during the analysis and p < 0.05 was considered as a significantly different group].
Fig. 8
Fig. 8
(a) SEM analysis of hydrogel after lyophilization (scale 100 μm); SEM images of FL-cHy-NPs kept at (i) 25 °C, and (ii) 37 °C; SEM images of HK-cHy-NPs kept at (iii) 25 °C, and (iv) 37°C. (b) FE-SEM images analysis of cHy-NPs embedded hydrogel formulation by deep learning segmentation (scale 2.5 μm); Segmentation of FL-cHy-NPs at (i) 25 °C, and (ii) 37 °C; Segmentation of HK-cHy-NPs at (iii) 25 °C, and (iv) 37 °C. In each of these segmentations blue regions represent deep learning segmentation model identified as particles. (c) In vitro drug release study of (i) FL, and (ii) HK at 25 °C and 37 °C, respectivelyfor up to 696 h (29 days). (iii) The graph showing fitting of cumulative percent drug release (CPDR) of FL and HK release with the Korsmeyer-Peppas Model form the respective hydrogel formulation at 25 and 37 °C.
Fig. 9
Fig. 9
FL and HK protect from cisplatin ototoxicity in zebrafish. A-L: Representative micrographs of neuromast hair cells immunostained for the hair cell marker, otoferlin (red). D-F: FL alone at 33µM, 17µM, or 2µM concentrations. G-I: HK alone at 33µM, 17µM, or 2µM concentrations. J-L: FL and HK in combination at 17mM, 8.5mM, or 3mM concentrations (each). NP = empty cHy-NPs. Scale bar: 10 μm. M: quantification of the number of hair cells per neuromast. Results are expressed as a percentage of protection, with 100% representing control animals and 0% cisplatin-treated fish. A maximum of three neuromasts were inspected per fish were inspected in 10–12 fish. Statistical analysis: One-way ANOVA followed by Dunnett post-test for multiple comparisons. ***p < 0.01 compared to cisplatin alone. #p < 0.05 compared to FL + HK17. ns = not significant.

References

    1. Steyger PS. Mechanisms of Ototoxicity and otoprotection, Otolaryngol. Clin North Am. 2021;54:1101–15. 10.1016/j.otc.2021.08.007.10.1016/j.otc.2021.08.007 - DOI - PMC - PubMed
    1. Kim J, Hemachandran S, Cheng AG, Ricci AJ. Identifying targets to prevent aminoglycoside ototoxicity. Mol Cell Neurosci. 2022;120:103722. 10.1016/j.mcn.2022.103722. 10.1016/j.mcn.2022.103722 - DOI - PMC - PubMed
    1. Rybak LP, Ramkumar V, Mukherjea D. Ototoxicity of non-aminoglycoside antibiotics. Front Neurol. 2021;12:652674. 10.3389/FNEUR.2021.652674/BIBTEX. 10.3389/FNEUR.2021.652674/BIBTEX - DOI - PMC - PubMed
    1. Lanvers-Kaminsky C, am Zehnhoff-Dinnesen A, Parfitt R, Ciarimboli G. Drug-induced ototoxicity: mechanisms, pharmacogenetics, and protective strategies. Clin Pharmacol Ther. 2017;101:491–500. 10.1002/cpt.603. 10.1002/cpt.603 - DOI - PubMed
    1. Chattaraj A, Syed MP, Low CA, Owonikoko TK. Cisplatin-Induced ototoxicity: a concise review of the Burden, Prevention, and interception strategies, JCO Oncol. Pract. 2023;19:278–83. 10.1200/op.22.00710.10.1200/op.22.00710 - DOI - PMC - PubMed

LinkOut - more resources