

Evidence of aberrant anti-epstein-barr virus antibody response, though no viral reactivation, in people with post-stroke fatigue
- PMID: 39135051
- PMCID: PMC11321160
- DOI: 10.1186/s12950-024-00402-0
Evidence of aberrant anti-epstein-barr virus antibody response, though no viral reactivation, in people with post-stroke fatigue
Abstract
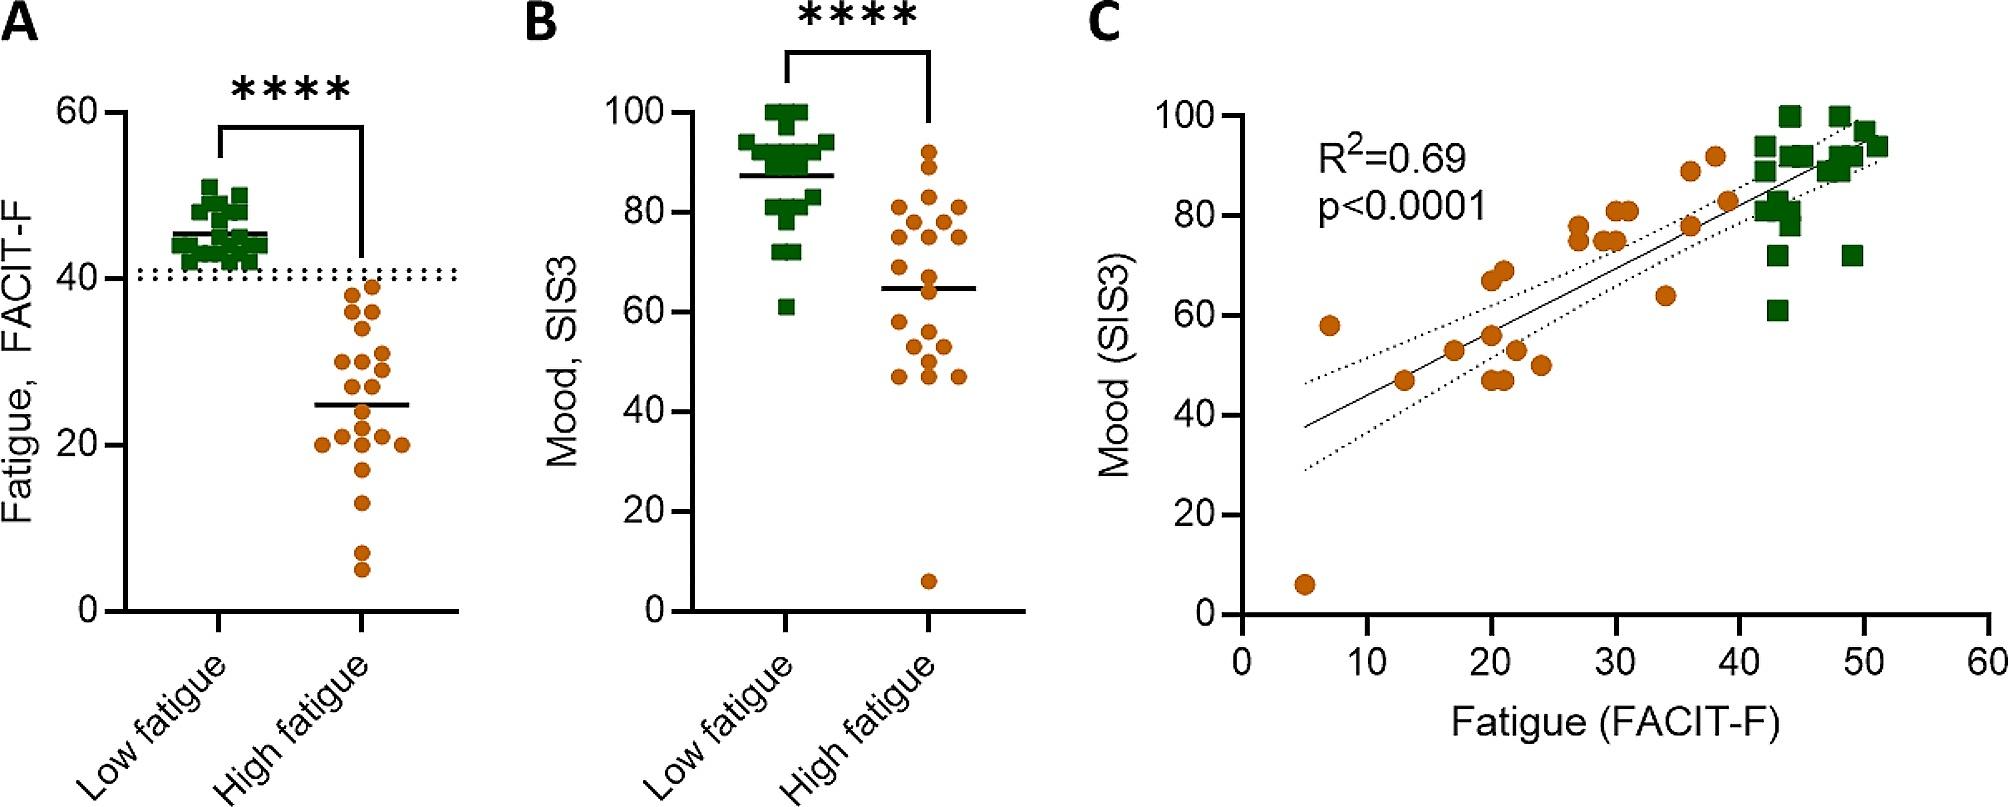
Background: Fatigue is a common complication of stroke that has a significant impact on quality of life. The biological mechanisms that underly post-stroke fatigue are currently unclear, however, reactivation of latent viruses and their impact on systemic immune function have been increasingly reported in other conditions where fatigue is a predominant symptom. Epstein-Barr virus (EBV) in particular has been associated with fatigue, including in long-COVID and myalgic encephalomyelitis/chronic fatigue syndrome, but has not yet been explored within the context of stroke.
Aims: We performed an exploratory analysis to determine if there is evidence of a relationship between EBV reactivation and post-stroke fatigue.
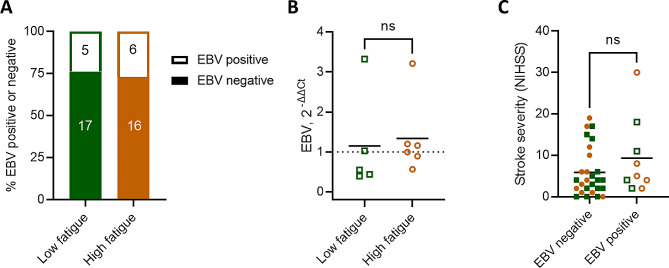
Methods: In a chronic ischemic stroke cohort (> 5 months post-stroke), we assayed circulating EBV by qPCR and measured the titres of anti-EBV antibodies by ELISA in patients with high fatigue (FACIT-F < 40) and low fatigue (FACIT-F > 41). Statistical analysis between two-groups were performed by t-test when normally distributed according to the Shapiro-Wilk test, by Mann-Whitney test when the data was not normally distributed, and by Fisher's exact test for categorical data.
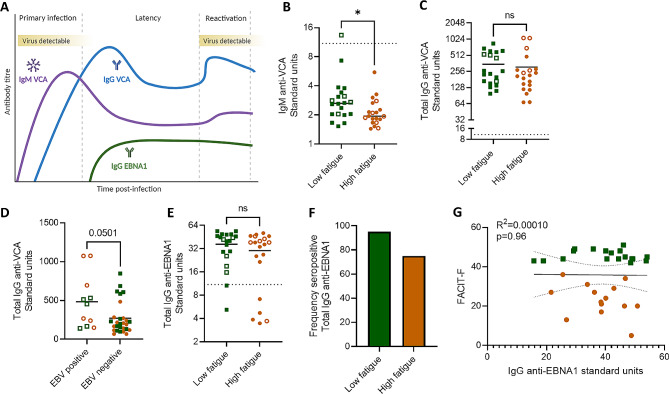
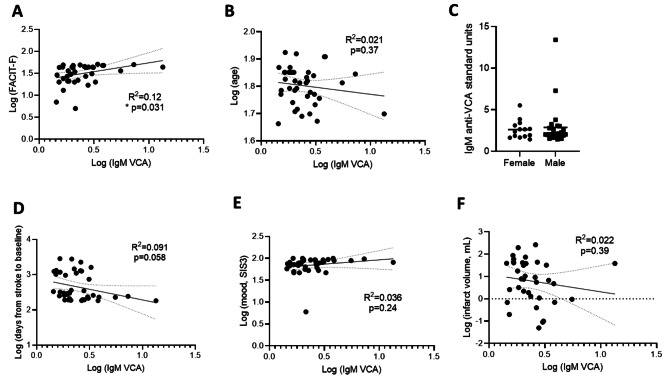
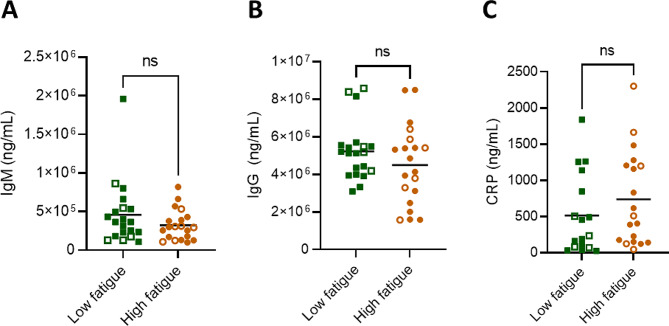
Results: We observed a similar incidence of viral reactivation between people with low versus high levels of post-stroke fatigue (5 of 22 participants (24%) versus 6 of 22 participants (27%)). Although the amount of circulating EBV was similar, we observed an altered circulating anti-EBV antibody profile in participants with high fatigue, with reduced IgM against the Viral Capsid Antigen (2.244 ± 0.926 vs. 3.334 ± 2.68; P = 0.031). Total IgM levels were not different between groups indicating this effect was specific to anti-EBV antibodies (3.23 × 10⁵ ± 4.44 × 10⁴ high fatigue versus 4.60 × 10⁵ ± 9.28 × 10⁴ low fatigue; P = 0.288).
Conclusions: These data indicate that EBV is not more prone to reactivation during chronic stroke recovery in those with post-stroke fatigue. However, the dysregulated antibody response to EBV may be suggestive of viral reactivation at an earlier stage after stroke.
Keywords: Epstein-Barr virus; Fatigue; Ischaemic stroke.
© 2024. The Author(s).
Conflict of interest statement
The authors declare no competing interests.
Figures
Similar articles
-
Saliva antibody-fingerprint of reactivated latent viruses after mild/asymptomatic COVID-19 is unique in patients with myalgic-encephalomyelitis/chronic fatigue syndrome.Front Immunol. 2022 Oct 20;13:949787. doi: 10.3389/fimmu.2022.949787. eCollection 2022. Front Immunol. 2022. PMID: 36341457 Free PMC article.
-
Investigation of Long COVID Prevalence and Its Relationship to Epstein-Barr Virus Reactivation.Pathogens. 2021 Jun 17;10(6):763. doi: 10.3390/pathogens10060763. Pathogens. 2021. PMID: 34204243 Free PMC article.
-
Early Growth Response Gene Upregulation in Epstein-Barr Virus (EBV)-Associated Myalgic Encephalomyelitis/Chronic Fatigue Syndrome (ME/CFS).Biomolecules. 2020 Oct 26;10(11):1484. doi: 10.3390/biom10111484. Biomolecules. 2020. PMID: 33114612 Free PMC article. Review.
-
Epstein-Barr virus reactivation is not causative for post-COVID-19-syndrome in individuals with asymptomatic or mild SARS-CoV-2 disease course.BMC Infect Dis. 2023 Nov 15;23(1):800. doi: 10.1186/s12879-023-08820-w. BMC Infect Dis. 2023. PMID: 37968601 Free PMC article.
-
Epstein-Barr virus-acquired immunodeficiency in myalgic encephalomyelitis-Is it present in long COVID?J Transl Med. 2023 Sep 17;21(1):633. doi: 10.1186/s12967-023-04515-7. J Transl Med. 2023. PMID: 37718435 Free PMC article. Review.
References
Grants and funding
LinkOut - more resources
Full Text Sources
