. 2024 Aug 12;22(1):754.
doi: 10.1186/s12967-024-05512-0.

Paired organoids from primary gastric cancer and lymphatic metastasis are useful for personalized medicine

Affiliations

Paired organoids from primary gastric cancer and lymphatic metastasis are useful for personalized medicine

Ruixin Yang et al. J Transl Med. .

Abstract

Background: Organoids are approved by the US FDA as an alternative to animal experiments to guide drug development and for sensitivity screening. Stable organoids models of gastric cancer are desirable for personalized medicine and drug screening.

Methods: Tumor tissues from a primary cancer of the stomach and metastatic cancer of the lymph node were collected for 3D culture. By long-term culture for over 50 generations in vitro, we obtained stably growing organoid lines. We analyzed short tandem repeats (STRs) and karyotypes of cancer cells, and tumorigenesis of the organoids in nude mice, as well as multi-omics profiles of the organoids. A CCK8 method was used to determine the drugs sensitivity to fluorouracil (5-Fu), platinum and paclitaxel.

Results: Paired organoid lines from primary cancer (SPDO1P) and metastatic lymph node (SPDO1LM) were established with unique STRs and karyotypes. The organoid lines resulted in tumorigenesis in vivo and had clear genetic profiles. Compared to SPDO1P from primary cancer, upregulated genes of SPDO1LM from the metastatic lymph node were enriched in pathways of epithelial-mesenchymal transition and angiogenesis with stronger abilities of cell migration, invasion, and pro-angiogenesis. Based on drug sensitivity analysis, the SOX regimen (5-Fu plus oxaliplatin) was used for chemotherapy with an optimal clinical outcome.

Conclusions: The organoid lines recapitulate the drug sensitivity of the parental tissues. The paired organoid lines present a step-change toward living biobanks for further translational usage.

Keywords: Drug sensitivity; Gastric cancer; Living biobank; Organoid models; Translational usage.


Conflict of interest statement

The authors declare no competing interests.

Figures
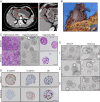
Fig. 1
Fig. 1
Clinicopathological characteristics of organoid lines (A) A thickened gastric antrum wall is shown by CT scanning. The red box marks the enlarged image. (B) An ulcerated mass is observed at the antrum in the gastrectomy sample with the enlarged lymph node near the right gastroepiploic artery (T, primary tumor; LN, lymph node). (C) From left to right, histology of poorly-differentiated adenocarcinoma of original tissues by H&E staining, organoid morphology by light- field observation, and organoid morphology by H&E staining. The histology is compatible with poorly-differentiated adenocarcinoma with irregular lumens. The upper panel indicates SPDO1P and the lower panel indicates SPDO1LM. Scale bar, 100 μm. (D) Immunohistochemical staining of E-cadherin, N-cadherin, and Ki67 for SPDO1P and SPDO1LM. Scale bar, 80 μm. (E) SPDO1P and SPDO1LM maintain cell vitality in continuous culture in vitro. Both organoid lines expanded for over 50 generations. Note: P1 = passage 1, P15 = passage 15, and P50 = passage 50. Scale bar, 100 μm
Fig. 2
Fig. 2
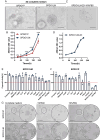
Culture conditions of SPDO1P and SPDO1LM. (A) The SPDO1P and SPDO1LM lines grow well in complete medium in 3D culture (light field). Scale bar, 100 μm. (B) The growth curves of SPDO1P (red) and SPDO1LM (blue) in 3D culture show that the doubling time of SPDO1P (120 h) is longer than that of SPDO1LM (72 h). (C) The SPDO1LM cells can adhere to the wall in 2D culture with 10% FBS-DMEM medium (light field). Scale bar, 100 μm. (D) The growth curve of SPDO1LM in 2D culture with a doubling time of 96 h. (E) Comparison of cell vitality of the SPDO1LM line based on the stepwise elimination of growth factors or chemicals. (F) Comparison of cell vitality of the SPDO1P line based on stepwise elimination of growth factors or chemicals. (G) The growth of SPDO1P (upper panel) and SPDO1LM (lower panel) cultured in complete medium (left), without Y27632 (middle), and 10% FBS-DMEM (right) under light-field observation. The SPDO1LM line grows well in complete medium, without Y27632, and 10% FBS-DMEM, while the SPDO1P line shows lower cell vitality without Y27632 or 10% FBS-DMEM. Scale bar, 200 μm, nsP > 0.05, *P < 0.05, ***P < 0.001. Abbreviation: DMEM, Dulbecco’s modified Eagle medium; FBS, fetal bovine serum
Fig. 3
Fig. 3
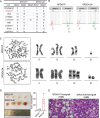
STRs and karyotypes analysis, as well as tumorigenesis of SPDO1P and SPDO1LM organoid lines. (A) The crucial STRs loci are compared between SPDO1P and SPDO1LM lines. Both organoid lines show XX sex alleles. STRs loci are matched well at D5S818, vWA, D7S820, TH01, D13S317, and TPOXSTR. There is allele drift at the loci of D16S539 and CSF1PO. (B) The chromatograms of the D5S818 locus (red) and D16S539 locus (green) from SPDO1P and SPDO1LM lines. The D5S818 locus is matched well, and one allele is shifted at the D16S539 locus. (C) The karyotype of SPDO1P line is 46, XX, + 8, -21 (upper), while that of the SPDO1LM line is 48, XX, + 8, +12, r(21)(p13q22.3) (lower). (D) The tumor volume of the SPDO1LM xenograft is larger than that of the SPDO1P xenograft (385.76 ± 112.16 vs. 63.46 ± 10.55 mm3). (E) By H&E staining, both xenografts of SPDO1P and SPDO1LM are poorly-differentiated adenocarcinoma. Scale bar, 100 μm.;**P < 0.01
Fig. 4
Fig. 4
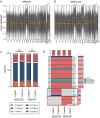
Genetic features of SPDO1P and SPDO1LM by whole-exome sequencing. (A) By CNV analysis, the SPDO1P shows a chromosome 8 gain (marked by red) and chromosome 21 loss (marked by blue). (B) By CNV analysis, the SPDO1LM line shows a chromosome 8 gain (marked by red), chromosome 12 gain (marked by red), and chromosome 21 loss (marked by blue). Copy ratio > 0 indicats a gain; copy ratio < 0 indicates a loss. (C) The bar plot of SNP ratios in SPDO1P, SPDO1LM, and their matched original tissues. There is no significant difference in the ratio of SNPs between SPDO1P and its original tissue (nsP = 0.8832) or SPDO1LM and its original cancer tissue (nsP = 0.7003) by the Chi-square test. (D) By mutation analysis, 25 somatic driver mutations are shared in both SPDO1P and SPDO1LM lines, as well as their original cancer tissues. There are specific driver mutations in the SPDO1P line and the matched cancer tissue (red box) and SPDO1LM line and matched cancer tissue (blue box)
Fig. 5
Fig. 5
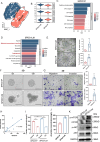
ScRNA-Seq and biological functions assays. (A) The tSNE plot of 10,578 cells from SPDO1P and SPDO1LM. The highly expressed genes of the SPDO1P and SPDO1LM organoid lines are separated into two clusters. (B) The violin plots show high expression of KRT8, KRT18, and EPCAM in SPDO1P and SPDO1LM. (C) The highly expressed gene set of SPDO1P is enriched in oxidative phosphorylation, MYC targets V1, and E2F target pathways. (D) The highly expressed gene set of SPDO1LM is enriched in hypoxia, EMT, glycolysis, apoptosis, coagulation, angiogenesis, IL2-STAT5 signaling, PI3K-AKT-mTOR signaling, protein secretion, and P53 pathways. (E) Images of the tubule formation analysis (light field). The supernatant of SPDO1LM shows stronger proangiogenic potential than that of SPDO1P with longer branch lengths and increased tubular junctions, n = 5. (F) Images of the organoid spheres in the 3D invasion assay of SPDO1P and SPDO1LM (light field). The SPDO1P line grows stably in a sphere structure, but the SPDO1LM line extends pseudopodia around the spheres. (G) Images of migration and invasion cells. The SPDO1LM line shows more migrated cells than the SPDO1P line after 72 h of incubation and more invading cells than SPDO1P after line for 96 h. n = 6. (H) The correlation analysis shows that the gene expression levels of the top 10 genes in the oxidative phosphorylation pathway of SPDO1P and the original tissue are consistent (r = 0.7542). (I) The lactate concentrations of both organoids significantly declined upon 2-deoxy-D-glucose (DG, 1 mM, 72 h) treatment. (J) The Δlactate concentration (lactate concentration of control group - lactate concentration of DG- treated group) is different between the two organoids. (K) According to western blot analysis, the protein expression levels of p-mTOR, mTOR, p-AKT, and AKT in the SPDO1LM line are higher than those of the SPDO1P line. *P < 0.05, **P < 0.01, ***P < 0.001
Fig. 6
Fig. 6
Drug sensitivity of SPDO1P and SPDO1LM lines and its effect on 3D cell invasion. (A) Left: The morphological changes of SPDO1P (upper) and SPDO1LM (lower) upon 5-Fu treatment. Middle: Cell vitality analysis of organoids compared to cancer cell lines AGS, NCI-N87-2D, and NCI-N87-3D spheroids upon 5-Fu treatment. Right: The bar chart shows IC50 values of organoids and cancer cell lines AGS, NCI-N87-2D, and NCI-N87-3D spheroids. (B) Left: The morphological changes of SPDO1P (upper) and SPDO1LM (lower) upon OXA treatment. Middle: Cell vitality analysis of organoids compared to cancer cell lines AGS, NCI-N87-2D, and NCI-N87-3D spheroids upon OXA treatment. Right: The bar chart shows IC50 values of organoids and cancer cell lines AGS, NCI-N87-2D, and NCI-N87-3D spheroids upon OXA treatment. (C) Left: The morphological changes of SPDO1P (upper) and SPDO1LM (lower) upon PTX treatment. Middle: Cell vitality analysis of organoids compared to cancer cell lines AGS, NCI-N87-2D, and NCI-N87-3D spheroids upon PTX treatment. Right: The bar chart shows IC50 values of organoids and cancer cell lines AGS, NCI-N87-2D, and NCI-N87-3D spheroids upon PTX treatment. n = 3. Scale bar, 100 μm. (D) In 3D cell invasion assays, 5-Fu more significantly inhibits SPDO1LM invasion in SPDO1LM compared to SPDO1P. (E) OXA significantly inhibits SPDO1P invasion compared to SPDO1LM. (F) PTX inhibits both SPDO1P and SPDO1LM invasion compared to controls. nsP > 0.05, *P < 0.05, **P < 0.01, ***P < 0.001

Similar articles

Cited by

References

    1. Sung H, Ferlay J, Siegel RL, Laversanne M, Soerjomataram I, Jemal A, et al. Global Cancer statistics 2020: GLOBOCAN estimates of incidence and Mortality Worldwide for 36 cancers in 185 countries. CA Cancer J Clin. 2021;71:209–49. 10.3322/caac.21660 - DOI - PubMed
    1. Wong MCS, Huang J, Chan PSF, Choi P, Lao XQ, Chan SM, et al. Global incidence and mortality of gastric Cancer, 1980–2018. JAMA Netw Open. 2021;4:e2118457. 10.1001/jamanetworkopen.2021.18457 - DOI - PMC - PubMed
    1. Wu L, Liang Y, Zhang C, Wang X, Ding X, Huang C, et al. Prognostic significance of lymphovascular infiltration in overall survival of gastric cancer patients after surgery with curative intent. Chin J Cancer Res. 2019;31:785–96. 10.21147/j.issn.1000-9604.2019.05.08 - DOI - PMC - PubMed
    1. Zhou H, Lei PJ, Padera TP. Progression of Metastasis through Lymphatic System. Cells 2021; 10. - PMC - PubMed
    1. Wang Y, Li X, Zhang T, Li F, Shen Y, He Y, et al. Neutrophils promote tumor invasion via FAM3C-mediated epithelial-to-mesenchymal transition in gastric cancer. Int J Biol Sci. 2023;19:1352–68. 10.7150/ijbs.79022 - DOI - PMC - PubMed

MeSH terms

LinkOut - more resources