. 2024 Aug 13;15(1):113.
doi: 10.1186/s40104-024-01071-y.

Dietary bile acids supplementation decreases hepatic fat deposition with the involvement of altered gut microbiota and liver bile acids profile in broiler chickens

Affiliations

Dietary bile acids supplementation decreases hepatic fat deposition with the involvement of altered gut microbiota and liver bile acids profile in broiler chickens

Minghui Wang et al. J Anim Sci Biotechnol. .

Erratum in

Abstract

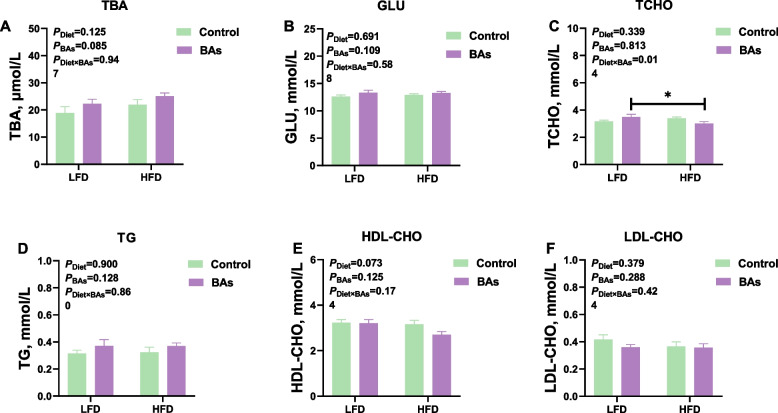
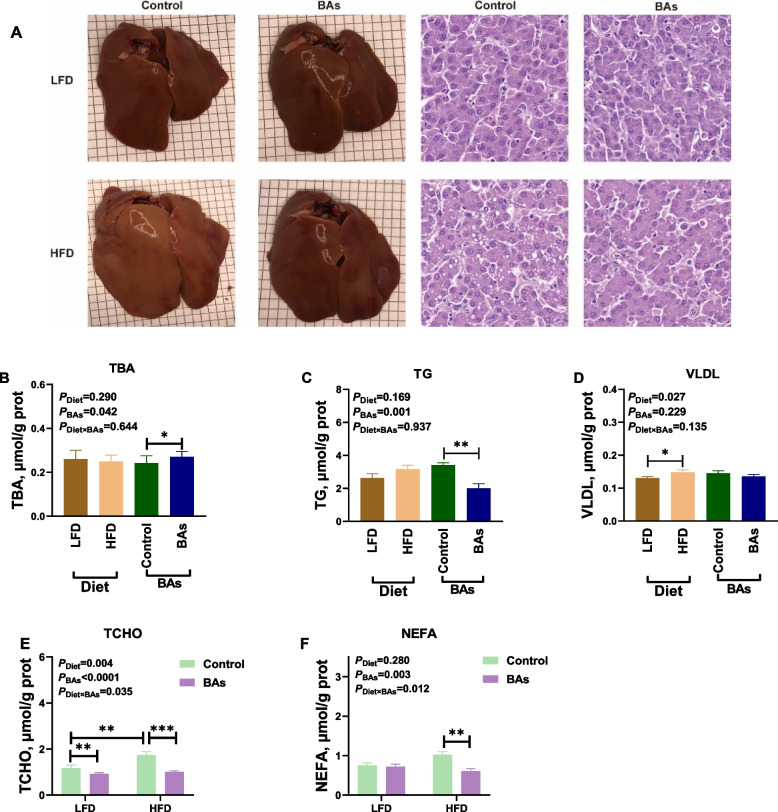
Background: High-fat diets (HFD) are known to enhance feed conversion ratio in broiler chickens, yet they can also result in hepatic fat accumulation. Bile acids (BAs) and gut microbiota also play key roles in the formation of fatty liver. In this study, our objective was to elucidate the mechanisms through which BA supplementation reduces hepatic fat deposition in broiler chickens, with a focus on the involvement of gut microbiota and liver BA composition.

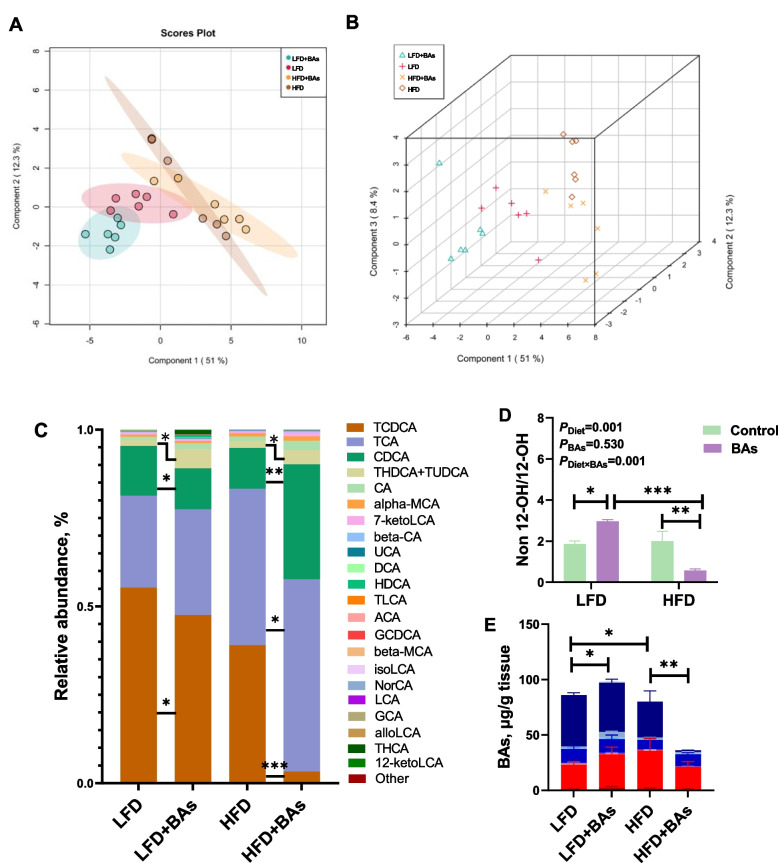
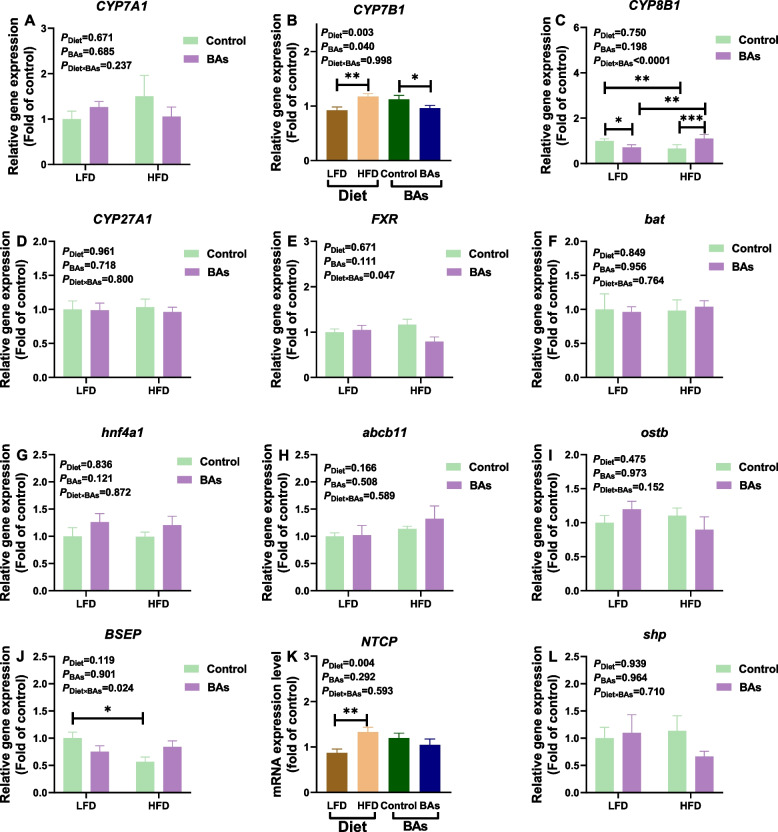
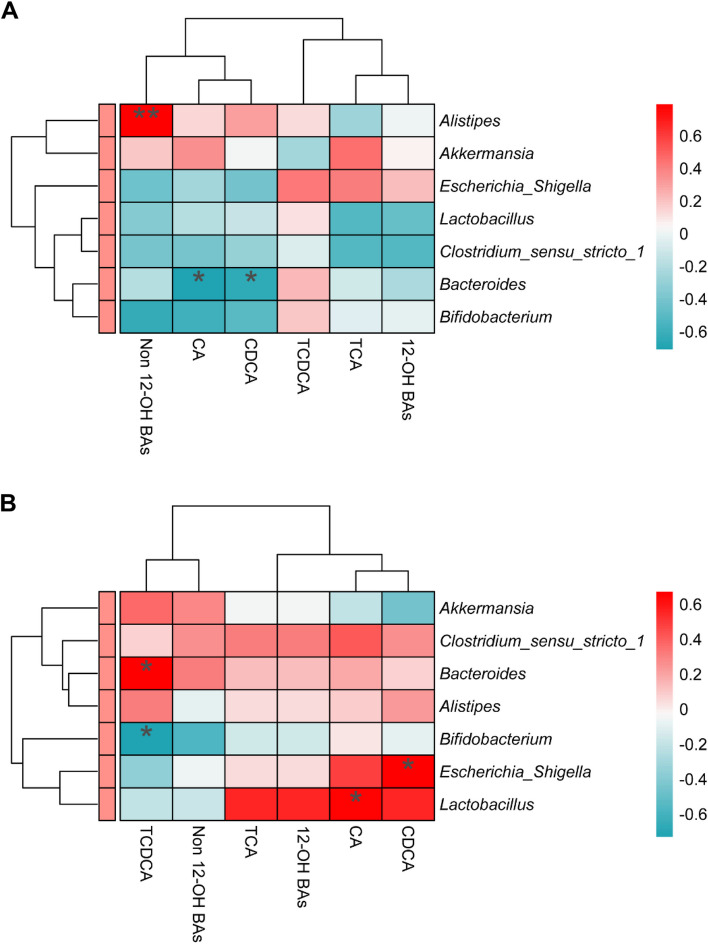
Results: Newly hatched broiler chickens were allocated to either a low-fat diet (LFD) or HFD, supplemented with or without BAs, and subsequently assessed their impacts on gut microbiota, hepatic lipid metabolism, and hepatic BA composition. Our findings showed that BA supplementation significantly reduced plasma and liver tissue triglyceride (TG) levels in 42-day-old broiler chickens (P < 0.05), concurrently with a significant decrease in the expression levels of fatty acid synthase (FAS) in liver tissue (P < 0.05). These results suggest that BA supplementation effectively diminishes hepatic fat deposition. Under the LFD, BAs supplementation increased the BA content and ratio of Non 12-OH BAs/12-OH BAs in the liver and increased the Akkermansia abundance in cecum. Under the HFD, BA supplementation decreased the BAs and increased the relative abundances of chenodeoxycholic acid (CDCA) and cholic acid (CA) in hepatic tissue, while the relative abundances of Bacteroides were dramatically reduced and the Bifidobacterium, Escherichia, and Lactobacillus were increased in cecum. Correlation analyses showed a significant positive correlation between the Akkermansia abundance and Non 12-OH BA content under the LFD, and presented a significant negative correlation between the Bacteroides abundance and CA or CDCA content under the HFD.

Conclusions: The results indicate that supplementation of BAs in both LFD and HFD may ameliorate hepatic fat deposition in broiler chickens with the involvement of differentiated microbiota-bile acid profile pathways.

Keywords: Bile acids; Broiler chickens; Gut microbiota; Hepatic fat deposition; Liver bile acid profile.


Conflict of interest statement

Author AC and JW are affiliated with “Shandong Longchang Animal Health Products Co., Ltd., P. R. China”, a company that offers commercial BAs products. The authors declare that they have no conflicts of interest.

Figures

Fig. 1
Fig. 1
Effects of BAs on plasma biochemical parameters in 21-day-old broiler chickens fed diets with different fat levels. A TBA content; B GLU content; C TCHO content; D TG content; E HDL-CHO content; F LDL-CHO content. Data are presented as the mean ± SEM (n = 8). The P values in the top left corner of each panel represent the results of two-way ANOVA. PDiet < 0.05 indicates a significant effect of dietary fat level on the respective parameter, PBAs < 0.05 indicates a significant effect of BAs on the respective parameter, and PDiet×BAs < 0.05 indicates a significant interaction effect between dietary fat level and BAs on the respective parameter. *P < 0.05
Fig. 2
Fig. 2
Effects of BAs on plasma biochemical parameters in 42-day-old broiler chickens fed diets with different fat levels. A TBA content; B GLU content; C TCHO content; D TG content; E HDL-CHO content; F LDL-CHO content; G AST content; H ALT content; I AST/ALT ratio. Data are presented as the mean ± SEM (n = 8). The P values in the top left corner of each panel represent the results of two-way ANOVA. PDiet < 0.05 indicates a significant effect of dietary fat level on the respective parameter, PBAs < 0.05 indicates a significant effect of BAs on the respective parameter, and PDiet×BAs < 0.05 indicates a significant interaction effect between dietary fat level and BAs on the respective parameter. *P < 0.05, **P < 0.01
Fig. 3
Fig. 3
Effects of BAs on hepatic lipid metabolism in 42-day-old broiler chickens fed diets with different fat levels. A Hepatic tissue morphology and HE staining; B Hepatic tissue TBA content; C Hepatic tissue TG content; D Hepatic tissue VLDL content; E Hepatic tissue TCHO content; F Hepatic tissue NEFA content. Data are presented as the mean ± SEM (n = 8). The P values in the top left corner of each panel represent the results of two-way ANOVA. PDiet < 0.05 indicates a significant effect of dietary fat level on the respective parameter, PBAs < 0.05 indicates a significant effect of BAs on the respective parameter, and PDiet×BAs < 0.05 indicates a significant interaction effect between dietary fat level and BAs on the respective parameter. *P < 0.05, **P < 0.01, ***P < 0.001
Fig. 4
Fig. 4
Effects of BAs on mRNA levels of hepatic lipid metabolism-related genes in 42-day-old broiler chickens fed diets with different fat levels. A PPARγ; B ATGL; C LPL; D FAS; E ME; F ACC; G C/EPBα; H SREBP1; I AMPK; J CPT1; K PPARα; L FATP1; M ADPN; N ADPR1; O ADPR2. Data are presented as the mean ± SEM (n = 8). The P values in the top left corner of each panel represent the results of two-way ANOVA. PDiet < 0.05 indicates a significant effect of dietary fat level on the respective parameter, PBAs < 0.05 indicates a significant effect of BAs on the respective parameter, and PDiet×BAs < 0.05 indicates a significant interaction effect between dietary fat level and BAs on the respective parameter. *P < 0.05, **P < 0.01
Fig. 5
Fig. 5
Effects of BAs on hepatic BA composition in broiler chickens fed diets with different fat levels. A PCA 2D Analysis; B PCA 3D Analysis; C Composition of BAs; D Ratio of Non 12-OH/12-OH BAs; E Content of Non 12-OH BAs and 12-OH BAs. Data are presented as the mean ± SEM (n = 8). *P < 0.05, **P < 0.01, ***P < 0.001. E displays the color coding used for BA types. The red color indicates 12-OH BAs, while the blue color represents Non 12-OH BAs. Specifically, 12-OH BAs consist of TCA, CA, NorCA, DCA, beta-CA, and ACA. Non 12-OH BAs encompass TCDCA, CDCA, alloLCA, LCA, isoLCA, 7-ketoLCA, HDCA, alpha-MCA, beta-MCA, UCA, GHDCA, GCDCA, GUDCA, TLCA, and THDCA + TUDCA. The asterisk (*) in Panel E highlights the disparity in Non 12-OH BA content between the compared groups
Fig. 6
Fig. 6
Effects of BAs on the synthesis and transport of bas in broiler chickens fed diets with different fat levels. A CYP7A1; B CYP7B1; C CYP8B1; D CYP27A1; E FXR; F bat; G hnf4a1; H abcb11; I ostb; J BSEP; K NTCP; and L shp. Data are presented as the mean ± SEM (n = 8). The P values in the top left corner of each panel represent the results of two-way ANOVA. PDiet < 0.05 indicates a significant effect of dietary fat level on the respective parameter, PBAs < 0.05 indicates a significant effect of BAs on the respective parameter, and PDiet×BAs < 0.05 indicates a significant interaction effect between dietary fat level and BAs on the respective parameter. *P < 0.05, **P < 0.01, ***P < 0.001
Fig. 7
Fig. 7
Effects of BAs on the cecal microbiota in broiler chickens fed diets with different fat levels. A Chao 1 analysis; B Shannon index; C PCoA; D The distribution of cecum microbiota at the phylum level; E The distribution of cecum microbiota at the genus level. n = 6
Fig. 8
Fig. 8
Effects of BAs on the strains encoded by BA-metabolizing enzymes in broiler chickens fed diets with different fat levels. A The average abundance of bacterial genera expressing BSH. B The average abundance of bacterial genera expressing 7-alpha HSDH. C The average abundance of bacterial genera expressing 7-alpha-dehydroxylase (Clostridium). n = 6
Fig. 9
Fig. 9
Correlation analysis of gut microbiota and hepatic BAs in broiler chickens supplemented with BAs in LFD (A) and HFD (B). *P < 0.05, **P < 0.01

Similar articles

Cited by

References

    1. Nanto F, Ito C, Kikusato M, Toyomizu M. Effect of feeding diets combining whole-grain paddy rice and high levels of fat on broiler chicken growth. J Poult Sci. 2016;53(1):34–9. - PMC - PubMed
    1. Chen L, Shi Y, Li J, Shao C, Ma S, Shen C, et al. Dietary bile acids improve breast muscle growth in chickens through FXR/IGF2 pathway. Poult Sci. 2024;103(2):103346. - PMC - PubMed
    1. Crespo N, Esteve-Garcia E. Dietary fatty acid profile modifies abdominal fat deposition in broiler chickens. Poult Sci. 2001;80(1):71–8. - PubMed
    1. Geng S, Zhang Y, Cao A, Liu Y, Di Y, Li J, et al. Effects of fat type and exogenous bile acids on growth performance, nutrient digestibility, lipid metabolism and breast muscle fatty acid composition in broiler chickens. Animals (Basel). 2022;12(10):4. - PMC - PubMed
    1. Lin C, Huang T, Peng Y, Lin Y, Mersmann H, Ding S. A novel chicken model of fatty liver disease induced by high cholesterol and low choline diets. Poult Sci. 2021;100(3):100869. - PMC - PubMed

LinkOut - more resources