. 2024 Aug 13;40(1):28.
doi: 10.1186/s42826-024-00214-6.

Assessment of immunopathological responses of a novel non-chemical biocide in C57BL/6 for safe disinfection usage

Affiliations

Assessment of immunopathological responses of a novel non-chemical biocide in C57BL/6 for safe disinfection usage

Keun Bon Ku et al. Lab Anim Res. .

Abstract

Background: Water electrospray technology has been developed and extensively studied for its physical properties and potential application as a non-chemical biocide against airborne pathogens. However, there are still concerns regarding the safety and potential toxicity of inhaling water electrospray (WE) particles. To address these potential hazards and offer insights into the impact of WE on humans, we analyzed the immunopathological response to WE by employing an intranasal challenge C57BL/6 mouse model. This analysis aimed to compare the effects of WE with those of sodium hypochlorite (SH), a well-known biocidal agent.

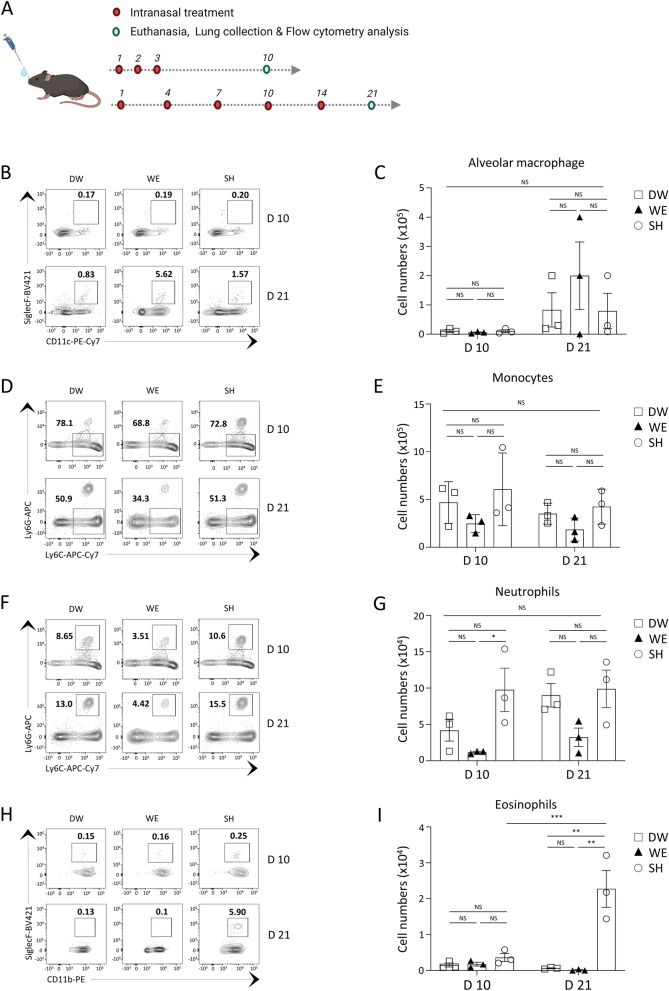
Results: The study findings suggest that the WE did not trigger any pathological immune reactions in the intranasal-challenged C57BL/6 mouse model. Mice challenged with WE did not experience body weight loss, and there was no increase in inflammatory cytokine production compared to SH-treated mice. Histopathological analysis revealed that WE did not cause any damage to the lung tissue. In contrast, mice treated with SH exhibited significant lung tissue damage, characterized by the infiltration of neutrophils and eosinophils. Transcriptomic analysis of lung tissue further confirmed the absence of a pathological immune response in mice treated with WE compared to those treated with SH. Upon intranasal challenge with WE, the C57BL/6 mouse model did not show any evidence of immunopathological damage.

Conclusions: The results of this study suggest that WE is a safe technology for disinfecting airborne pathogens. It demonstrated little to no effect on immune system activation and pathological outcomes in the intranasal challenge C57BL/6 mouse model. These findings not only support the potential use of WE as an effective and safe method for air disinfection but also highlight the value of the intranasal challenge of the C57BL/6 mouse model in providing significant immunopathological insights for assessing the inhalation of novel materials for potential use.

Keywords: Biocide; C57BL/6; Immunopathology; In vivo; Lung pathology; Water electrospray.


Conflict of interest statement

The authors declare no conflicts of interest. The funders had no role in the design of the study; the collection, analyses, or interpretation of data; the writing of the manuscript; or the decision to publish the results.

Figures

Fig. 1
Fig. 1
Bactericidal effect of water electrospray against E.coli. The bactericidal effect of water electrospray (WE) produced by a prototype laboratory-designed electrospray module was assessed by measuring the reduction rate of E. coli. A Experimental configuration of the WE–generating devices, consisting of a high voltage (HV) supply, pico ammeter, syringe pump, jet module, and collecting tray. The red circle indicates the ejecting WE from the jet module. B, C Colony counts analyzed the bactericidal effect. The process involved diluting the mixtures by 101- or 102-fold, followed by incubation for 1 or 2 h. Each tenfold diluted sample was plated in triplicate, and after 24 h of incubation, the colonies were counted. B Representative images of agar plates used for colony counting. C Bacterial titer (CFU/ml) of each mixture. D, E Colony reduction rate based on LB broth–conditioned E. coli. Results of incubation at room temperature for D 1 h and E 2 h. The bar plots show the mean ± SEM; the dots represent individual biological replicates. p values are from one-way or two-way ANOVA. *p < 0.05, **p < 0.01, ***p < 0.001
Fig. 2
Fig. 2
Analysis of weight and inflammatory cytokines changes of WE–treated mice. Body weight changes and inflammatory cytokines from bronchoalveolar lavage (BAL) fluid were analyzed in mice treated with distilled water (DW, n = 3), water electrospray (WE, n = 3), and sodium hypochlorite (SH, n = 3). A Experimental scheme of the treatment and BAL collection. B, C After the intranasal treatment of the agents, body weight changes were monitored for the groups challenged B acute and C sub-chronic challenging condition. DG Levels of mouse cytokines in BAL fluids collected at both 10 days and 21 days from treated mouse groups: D IL-1β, E IL-6, F IL-12p40, and G TNF-α. The bar plots show the mean ± SEM; the dots represent individual mice. p values are from one-way (DG) or two-way ANOVA (B, C). *p < 0.05, **p < 0.01, ***p < 0.001
Fig. 3
Fig. 3
Histopathological analysis of WE–treated mice. Histopathological analysis was conducted using H&E staining. Distilled water (DW, n = 3), water electrospray (WE, n = 3), and sodium hypochlorite (SH, n = 3) were administered for the treatments. A The experimental schedule of the treatments and lung H&E staining was established. BE Representative images of H&E-stained lungs were captured 10 days after treatment with B DW, C WE, or D SH (closed arrow highlights immune cell infiltration). For the E pathological score, three images from three individual mice were analyzed. FI Histopathological images on day 21 were analyzed in the same manner. Representative images following treatment with F DW, G WE, and H SH are depicted (arrowhead indicates emphysema-like alveoli, and closed arrows highlight goblet cell hyperplasia). I Pathological scores were analyzed. The bar plots show the mean ± SEM; the dots represent individual images from a treated group. p values are from one-way ANOVA. * p < 0.05, ** p < 0.01, *** p < 0.001
Fig. 4
Fig. 4
Lung tissue–infiltrating myeloid immune cell analysis of WE–treated mice. The lung resident and infiltrating immune cells of mice treated with distilled water (DW, n = 3), water electrospray (WE, n = 3), and sodium hypochlorite (SH, n = 3) were analyzed using flow cytometry. A Experimental schedule and FACS analysis of lung resident and infiltrating immune cells. B, C Alveolar macrophages were quantified in lung tissues harvested at 10 days and 21 days. B Representative FACS plots of SiglecF+ CD11c+ alveolar macrophages and C total cell count. D, E Lung-infiltrating monocytes were assessed by Ly6C+ and Ly6G. D Representative FACS plots and E total cell count of monocytes. F, G Lung-infiltrating Ly6C+ Ly6G+ neutrophils were quantified. F Representative FACS plots and G total cell count of neutrophils. H, I Lung-infiltrating SiglecF+ CD11b+ eosinophils were measured. H Representative FACS plots and I total cell count of lung tissue–infiltrating eosinophils. The bar plots show the mean ± SEM; the dots represent individual mice. p values are from two-way ANOVA. *p < 0.05, **p < 0.01, ***p < 0.001
Fig. 5
Fig. 5
Bulk RNA sequencing analysis of lung tissue from WE–treated mice. To analyze transcriptome-level changes in mice challenged with water electrospray (WE, n = 3) compared with those treated with distilled water (DW, n = 3) or sodium hypochlorite (SH, n = 3) at 21 days, total RNA was extracted from their lungs. Subsequently, bulk RNA sequencing was conducted to investigate and analyze the transcriptome-level changes. A An experimental schedule was established for the treatment and transcriptome analysis of lung tissues. B Dendrogram of hierarchical clustering of DW–, WE–, and SH–treated mice. C, D Volcano plots were generated to visually depict the differentially expressed genes between the C WE versus DW and D WE versus SH groups (cut-off value: − log10P < 0.001 and fold change > 0.5). E, F Gene set enrichment analysis was performed to identify enriched gene sets between the E WE versus DW and F WE versus SH groups. A list of enriched gene sets with an adjusted p-value < 0.05 was generated

Similar articles

References

    1. Piret J, Boivin G. Pandemics throughout history. Front Microbiol. 2020;11:631736. 10.3389/fmicb.2020.631736 - DOI - PMC - PubMed
    1. Harrington WN, Kackos CM, Webby RJ. The evolution and future of influenza pandemic preparedness. Exp Mol Med. 2021;53(5):737–49. 10.1038/s12276-021-00603-0 - DOI - PMC - PubMed
    1. Leung NHL. Transmissibility and transmission of respiratory viruses. Nat Rev Microbiol. 2021;19(8):528–45. 10.1038/s41579-021-00535-6 - DOI - PMC - PubMed
    1. Wang CC, Prather KA, Sznitman J, Jimenez JL, Lakdawala SS, Tufekci Z, et al. Airborne transmission of respiratory viruses. Science. 2021;373(6558):eabd9149. 10.1126/science.abd9149 - DOI - PMC - PubMed
    1. Moutinho S. Tuberculosis Is the oldest pandemic, and poverty makes it continue. Nature. 2022;605(7910):S16-s20. 10.1038/d41586-022-01348-0 - DOI - PubMed

LinkOut - more resources