

Integrated analysis of spatial transcriptomics and CT phenotypes for unveiling the novel molecular characteristics of recurrent and non-recurrent high-grade serous ovarian cancer
- PMID: 39135097
- PMCID: PMC11318304
- DOI: 10.1186/s40364-024-00632-7
Integrated analysis of spatial transcriptomics and CT phenotypes for unveiling the novel molecular characteristics of recurrent and non-recurrent high-grade serous ovarian cancer
Abstract
Background: High-grade serous ovarian cancer (HGSOC), which is known for its heterogeneity, high recurrence rate, and metastasis, is often diagnosed after being dispersed in several sites, with about 80% of patients experiencing recurrence. Despite a better understanding of its metastatic nature, the survival rates of patients with HGSOC remain poor.
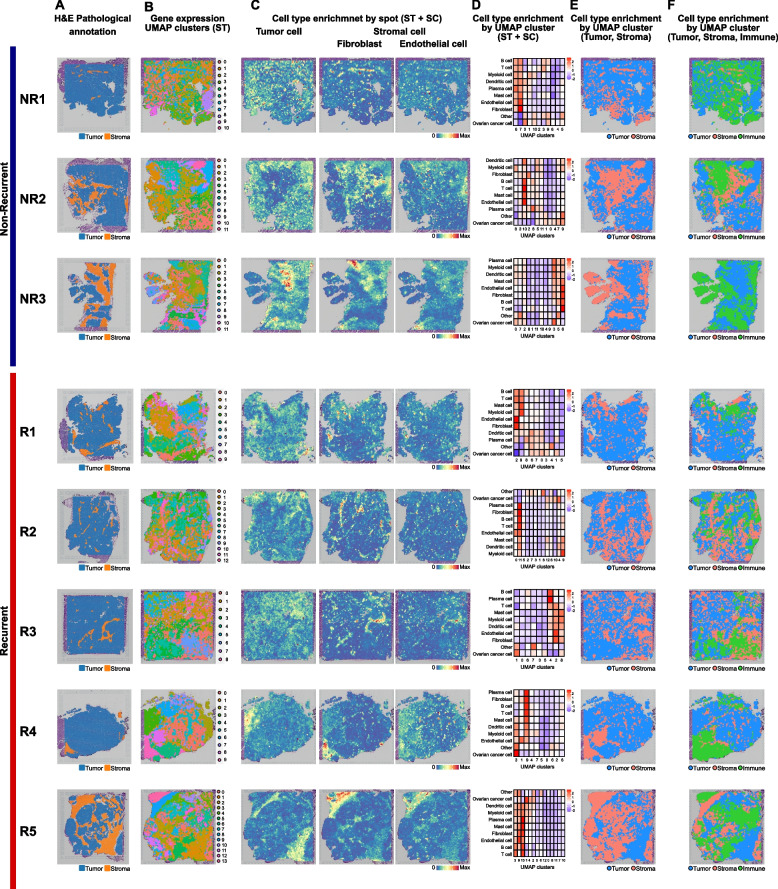
Methods: Our study utilized spatial transcriptomics (ST) to interpret the tumor microenvironment and computed tomography (CT) to examine spatial characteristics in eight patients with HGSOC divided into recurrent (R) and challenging-to-collect non-recurrent (NR) groups.
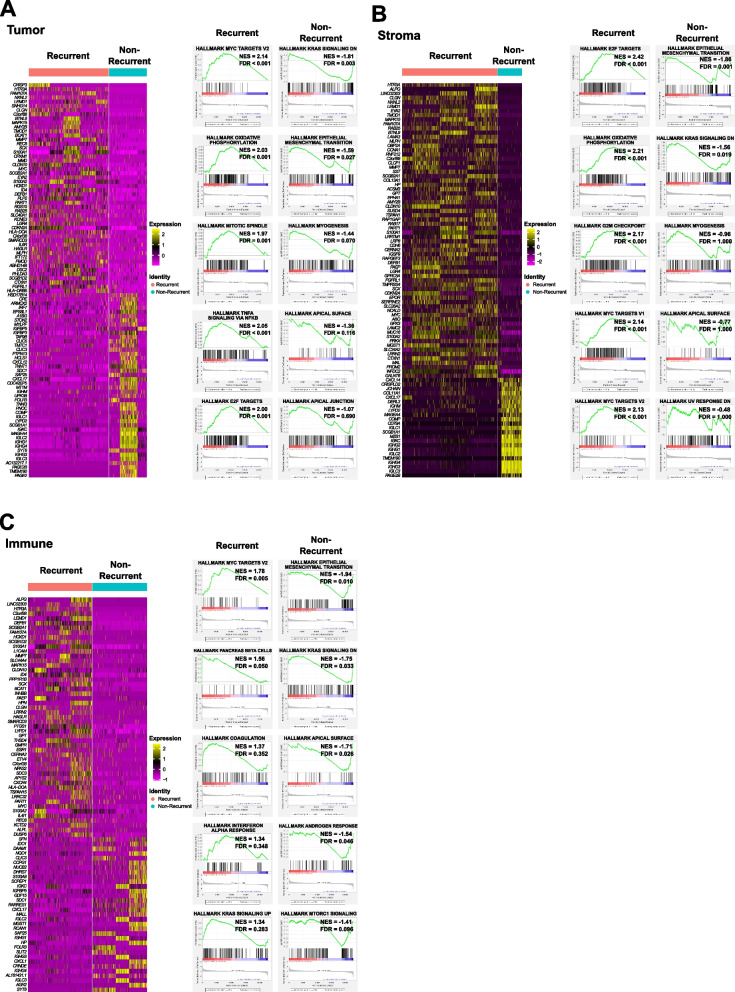
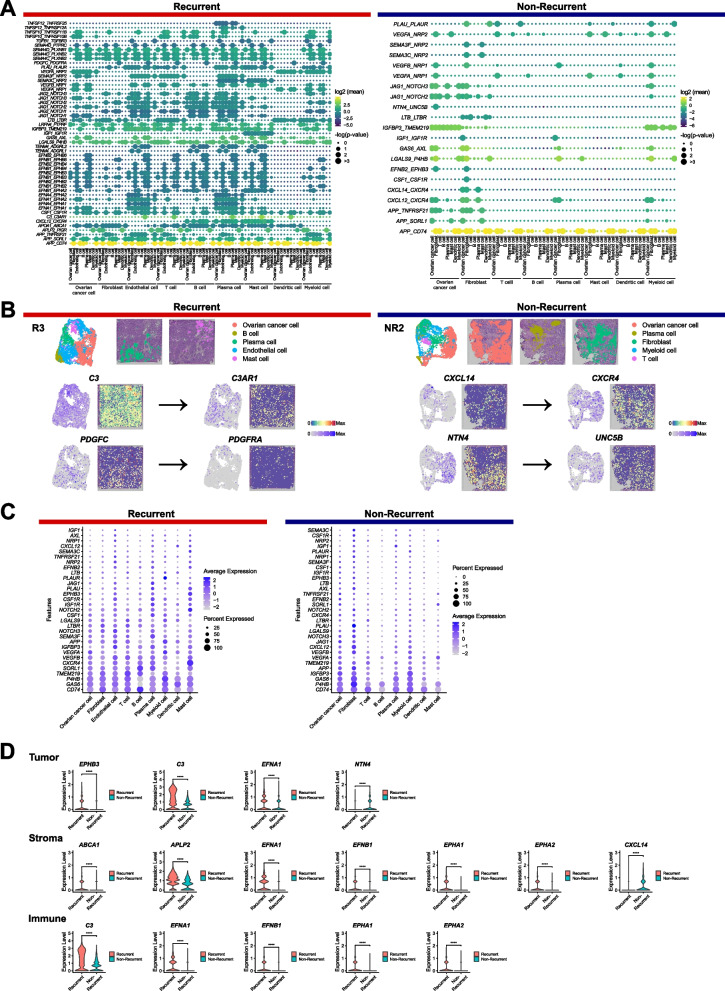
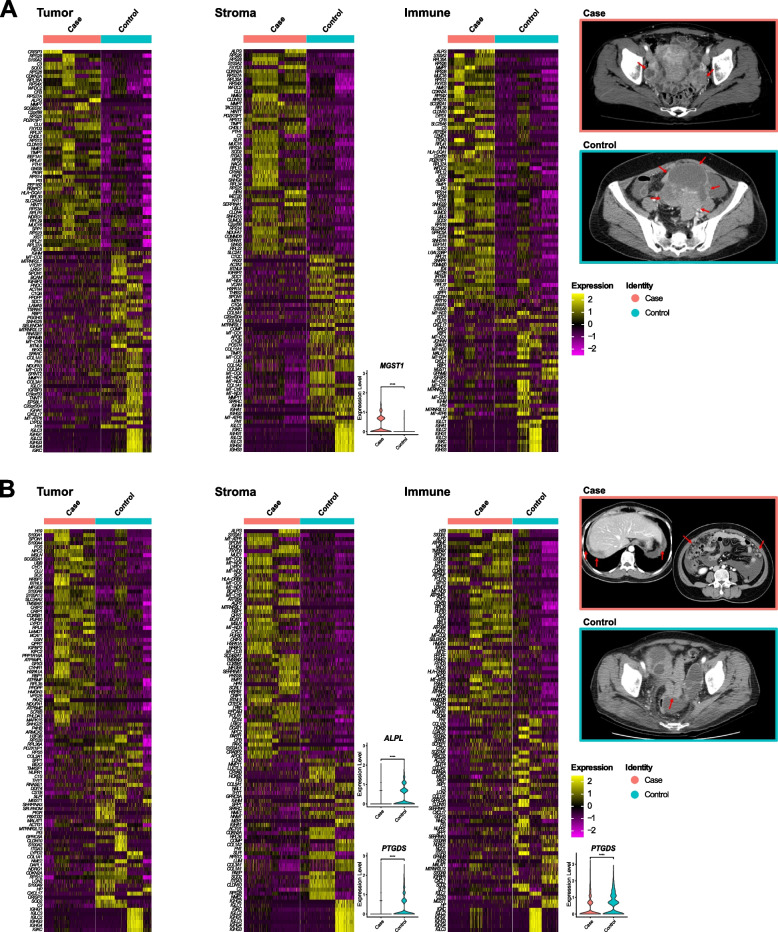
Results: By integrating ST data with public single-cell RNA sequencing data, bulk RNA sequencing data, and CT data, we identified specific cell population enrichments and differentially expressed genes that correlate with CT phenotypes. Importantly, we elucidated that tumor necrosis factor-α signaling via NF-κB, oxidative phosphorylation, G2/M checkpoint, E2F targets, and MYC targets served as an indicator of recurrence (poor prognostic markers), and these pathways were significantly enriched in both the R group and certain CT phenotypes. In addition, we identified numerous prognostic markers indicative of nonrecurrence (good prognostic markers). Downregulated expression of PTGDS was linked to a higher number of seeding sites (≥ 3) in both internal HGSOC samples and public HGSOC TCIA and TCGA samples. Additionally, lower PTGDS expression in the tumor and stromal regions was observed in the R group than in the NR group based on our ST data. Chemotaxis-related markers (CXCL14 and NTN4) and markers associated with immune modulation (DAPL1 and RNASE1) were also found to be good prognostic markers in our ST and radiogenomics analyses.
Conclusions: This study demonstrates the potential of radiogenomics, combining CT and ST, for identifying diagnostic and therapeutic targets for HGSOC, marking a step towards personalized medicine.
Keywords: High-grade serous ovarian cancer; Radiogenomics; Spatial transcriptomics; Tumor microenvironment.
© 2024. The Author(s).
Conflict of interest statement
The authors declare no competing interests.
Figures
Similar articles
-
Uncovering key regulatory pathways and prognostic biomarkers in the tumor microenvironment of high-grade serous ovarian cancer through single-cell RNA sequencing and experimental validation.Front Oncol. 2025 May 9;15:1591430. doi: 10.3389/fonc.2025.1591430. eCollection 2025. Front Oncol. 2025. PMID: 40416874 Free PMC article.
-
Integrated Analysis To Identify Molecular Biomarkers Of High-Grade Serous Ovarian Cancer.Onco Targets Ther. 2019 Nov 21;12:10057-10075. doi: 10.2147/OTT.S228678. eCollection 2019. Onco Targets Ther. 2019. PMID: 31819501 Free PMC article.
-
Methylome analysis of extreme chemoresponsive patients identifies novel markers of platinum sensitivity in high-grade serous ovarian cancer.BMC Med. 2017 Jun 23;15(1):116. doi: 10.1186/s12916-017-0870-0. BMC Med. 2017. PMID: 28641578 Free PMC article.
-
Studying platinum sensitivity and resistance in high-grade serous ovarian cancer: Different models for different questions.Drug Resist Updat. 2016 Jan;24:55-69. doi: 10.1016/j.drup.2015.11.005. Epub 2015 Nov 26. Drug Resist Updat. 2016. PMID: 26830315 Review.
-
Extracellular matrix in high-grade serous ovarian cancer: Advances in understanding of carcinogenesis and cancer biology.Matrix Biol. 2023 Apr;118:16-46. doi: 10.1016/j.matbio.2023.02.004. Epub 2023 Feb 11. Matrix Biol. 2023. PMID: 36781087 Review.
References
-
- Bowtell DD, Böhm S, Ahmed AA, Aspuria P-J, Bast RC, Beral V, et al. Rethinking ovarian cancer II: reducing mortality from high-grade serous ovarian cancer. Nat Rev Cancer. 2015;15:668–79. Available from: https://www.nature.com/articles/nrc4019. Cited 2023 Oct 5. 10.1038/nrc4019 - DOI - PMC - PubMed
-
- Soslow RA. Histologic subtypes of ovarian carcinoma: an overview. Int J Gynecol Pathol Off J Int Soc Gynecol Pathol. 2008;27:161–74. - PubMed
LinkOut - more resources
Full Text Sources
Molecular Biology Databases
Miscellaneous
