Review
. 2024 Aug 12;22(1):478.
doi: 10.1186/s12951-024-02703-1.

The biological applications of near-infrared optical nanomaterials in atherosclerosis

Affiliations
Review

The biological applications of near-infrared optical nanomaterials in atherosclerosis

Lin Shen et al. J Nanobiotechnology. .

Abstract

Purpose of review: Atherosclerosis, a highly pathogenic and lethal disease, is difficult to locate accurately via conventional imaging because of its scattered and deep lesions. However, second near-infrared (NIR-II) nanomaterials show great application potential in the tracing of atherosclerotic plaques due to their excellent penetration and angiographic capabilities.

Recent findings: With the development of nanotechnology, among many nanomaterials available for the visual diagnosis and treatment of cardiovascular diseases, optical nanomaterials provide strong support for various biomedical applications because of their advantages, such as noninvasive, nondestructive and molecular component imaging. Among optical nanomaterials of different wavelengths, NIR-II-range (900 ~ 1700 nm) nanomaterials have been gradually applied in the visual diagnosis and treatment of atherosclerosis and other vascular diseases because of their deep biological tissue penetration and limited background interference. This review explored in detail the prospects and challenges of the biological imaging and clinical application of NIR-II nanomaterials in treating atherosclerosis.

Keywords: Atherosclerosis; Cardiovascular disease; Macrophage polarization; NIR-II nanoparticle; NIRF.


Conflict of interest statement

The authors declare no competing interests.

Figures

Fig. 1
Fig. 1
Conventional imaging diagnosis of atherosclerosis. Noninvasive imaging techniques for atherosclerotic plaques include CT, PET, MRI and CEUS, while the main invasive imaging techniques are OCT and IVUS. This figure shows the sensitivity, relative costs, resolution range and scan time range. MRI, CT and PET images were obtained from ref. [10]; CEUS images from ref. [127]; and IVUS and OCT images from ref. [128]. All of the imaging devices mentioned above have been approved by the FDA
Fig. 2
Fig. 2
Imaging with nanoparticles and related diagnostic techniques. To identify nanoparticles in plaque cells using CT, MRI, optical techniques, or nuclear imaging, including PET and SPECT, a range of imaging agents can be used. The relative price, sensitivity, scan time range, and resolution range are indicators. This figure was reproduced from ref. [61]
Fig. 3
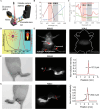
Fig. 3
Differences between the NIR-I and NIR-II in biological imaging. A Diagram showing the imaging setup in which Hongjie Dai's team used silicon and InGaAs cameras for the simultaneous detection of NIR-I and NIR-II photons. Adjustable magnifications were achieved using a series of zoomable lenses. Reproduced from ref. [62]. B Sensitivity curves for common cameras based on sensors made of silicon (Si), mercury cadmium telluride (HgCdTe), or indium gallium arsenide (InGaAs). HgCdTe is more sensitive at longer wavelengths, while Si and InGaAs cameras are sensitive inside the first and second near-infrared windows, respectively. copied from the source. Reproduced from ref. [71]. C The effective attenuation coefficient (on a log scale) against wavelength plots indicated that the first (pink shaded area) or second (gray shaded area) near-infrared window had the lowest absorption and scattering from skin, fatty tissue, deoxygenated blood, and oxygenated blood. copied from the source. Reproduced from ref. [73]. D UV absorption and fluorescence emission spectra of Ag2Se QDs coated with PEG and C18-PMH. The NIR-II fluorescence image of the C18-PMH-PEG-Ag2Se QDs and the corresponding scheme are shown in the inset. Reproduced from ref. [82]. E Emotion of in vivo fluorescence images of mice following intravenous injection of NIR-II Ag2Se QDs (left) or NIR-I ICG (right) as a reference. Reproduced from ref. [82]. F Taken from reference live mice, bright field (left) and fluorescence (center) images were obtained by injecting PEGylated Ag2S QDs (NIR-II, 1 mg/mL, 50 mL) subcutaneously into the right footpad. Cross-sectional fluorescence intensity profiles (right) showing the results of QD injection in mice are shown along the red dashed bars. The red-dashed curves represent Gaussian fits to the profiles. Reproduced from ref. [83]. G Live mice were subjected to bright field (left) and fluorescence (center) imaging via the subcutaneous injection of ICG (NIR-I, 1 mg/mL, 50 mL) into the left footpad. Cross-sectional fluorescence intensity profiles (right) of an ICG-injected mouse shown along red dashed bars. The red-dashed curves represent Gaussian fits to the profiles. Reproduced from ref. [83]
Fig. 4
Fig. 4
Comparison of in vivo cerebrovascular imaging between the NIR-I and NIR-II groups of mice. A In vivo mouse brain imaging of the NIR subregions (NIR-I, NIR-II, and NIR-IIa) using SWNT-IRDye800. Reproduced from ref. [87]. B Fluorescence images, together with the associated SBR analysis, of the cerebrovasculature in the NIR-I, NIR-IIa and NIR-IIb areas of mice (n = 2) that did not undergo craniotomy. 2 mm scale bars. Reproduced from ref. [88]. C The VIS (520 nm), NIR-I (720 nm), and NIR-II (1300 nm) fluorescence images of mouse heads are displayed by fluorescence angiography; the excitation wavelengths are 488 nm, 670 nm, and 785 nm, respectively. Reproduced from ref. [90, 91]. D Fluorescence images of the capillaries of ICG (NIR I) and SWNTs (NIR II) in Intralipid® stimulated at 785 nm at depths of 0, 3, and 5 mm. Compared to the ICG sample, the SWNT sample exhibited reduced feature spread. The scale bar is 1.5 cm. Reproduced from ref. [90, 91]. E QD-doped porous beads (15 mm in diameter) and their transit into tissue are shown in microscopy images. The brain and heart slices had thicknesses of 100 and 200 mm, respectively. The fluorescence intensities in the normalized images are displayed in relation to the intensities when tissue slices were not present. Images with adjustments display the fluorescence intensities normalized to the intensity from peak to peak. Reproduced from ref. [90, 91]
Fig. 5
Fig. 5
Comparison of the NIR-I and NIR-II signals for AS imaging. A Time-based in vivo NIR-I fluorescence imaging of control and atherosclerotic animals following intravenous BOD-L-βGal-NP (300 μL, 33.3 mg/mL) injection. Reproduced from ref. [99]. B NIR-I fluorescence images of an atherosclerotic mouse and a control mouse aortic arch following one day of BOD-L-βGal-NP injection. Reproduced from ref. [99]. C Aortic fluorescence imaging using bright field and NIR-II fluorescence. After receiving an intravenous injection of ICG@PEG-Ag2S, the aortas were removed from the ApoE−/− mice and stained using Oil Red O. Reproduced from ref. [100]. D, E H&E and immunohistochemical staining of the dissected aortas corresponding to panel A. Macrophages are shown by white arrows, while atherosclerotic plaques are indicated by red arrows. Reproduced from ref. [100]. FH Time frame NIR-IIa images of a healthy control mouse (Mouse C1). IK Mouse C1 venous (blue) and arterial (red) veins are depicted in superimposed PCA images. LN Time-course NIR-IIa images of a mouse (Mouse M1) that underwent MCAO. OQ PCA superimposed pictures of mouse M1 venous (blue) and arterial (red) veins. Reproduced from ref. [87]
Fig. 6
Fig. 6
Monitoring of macrophage-mediated vascular inflammation by near-infrared fluorescence imaging. A Schematic representation of PLGA-HDL synthesis using microfluidic technology. The mice injected with PLGA-HDL exhibited uptake in both the aortic root and the thoracic and abdominal aorta. Reproduced from ref. [121]. B Therapeutic targets for foam cell production by macrophages. Reproduced from ref. [125]. C Schematic depiction of DNA-SPIONs. Coating nanoparticles with DNA can help surgeons accurately locate atherosclerotic plaques in the aortic root. Reproduced from ref. [126]. D At 0.5, 2 and 24 h after injection, ex vivo NIRF images of the heart and aorta removed from ApoE−/− mice showing atherosclerotic plaques were acquired. Cy5.5-DNA-SPIONs accumulated in plaques more quickly than Cy5.5-PEG-SPIONs did. Reproduced from ref. [126, 127]. E The buildup of Cy5.5-DNA-SPIONs, which are more common than Cy5.5-PEG-SPIONs (both red) inside or close to plaque macrophages (green) at 0.5 and 2 h after injection, was confirmed by immunofluorescence staining of the aortic root. Reproduced from ref. [126, 127]. F S-HDL regional distribution in atherosclerotic samples from pigs (right) and rabbits (left) 48 h after injection, as assessed by near-infrared fluorescence (NIRF; DiD-S-HDL) and autoradiography (AR; [89Zr]-S-HDL) reproduced from ref. [128]

Similar articles

References

    1. Organization GWH. World health statistics 2022: monitoring health for the SDGs, sustainable development goals. Geneva: World Health Organization; 2022.
    1. Dai T, He W, Yao C, Ma X, Ren W, Mai Y, Wu A. Applications of inorganic nanoparticles in the diagnosis and therapy of atherosclerosis. Biomater Sci. 2020;8:3784–99. 10.1039/d0bm00196a. 10.1039/d0bm00196a - DOI - PubMed
    1. Hoogendoorn A, Avery TD, Li J, Bursill C, Abell A, Grace PM. Emerging therapeutic applications for fumarates. Trend Pharmacol Sci. 2021;42:239–54. 10.1016/j.tips.2021.01.004. 10.1016/j.tips.2021.01.004 - DOI - PMC - PubMed
    1. Shen L, Li H, Chen W, Su Y, Yu J, Chen M, Shu G, Qiao E, Guo X, Xu M, et al. Integrated application of transcriptome and metabolomics reveals potential therapeutic targets for the polarization of atherosclerotic macrophages. Biochim Biophys Acta Mol Basis Dis. 2022;1868: 166550. 10.1016/j.bbadis.2022.166550. 10.1016/j.bbadis.2022.166550 - DOI - PubMed
    1. Shen L, Chen W, Ding J, Shu G, Chen M, Zhao Z, Xia S, Ji J. The role of metabolic reprogramming of oxygen-induced macrophages in the dynamic changes of atherosclerotic plaques. Faseb j. 2023;37: e22791. 10.1096/fj.202201486R. 10.1096/fj.202201486R - DOI - PubMed