. 2024 Aug 12;25(1):216.
doi: 10.1186/s13059-024-03350-3.

READv2: advanced and user-friendly detection of biological relatedness in archaeogenomics

Affiliations

READv2: advanced and user-friendly detection of biological relatedness in archaeogenomics

Erkin Alaçamlı et al. Genome Biol. .

Abstract

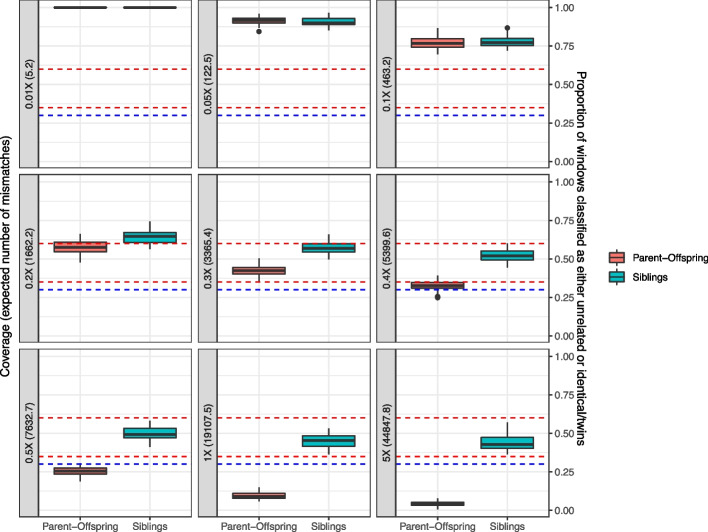
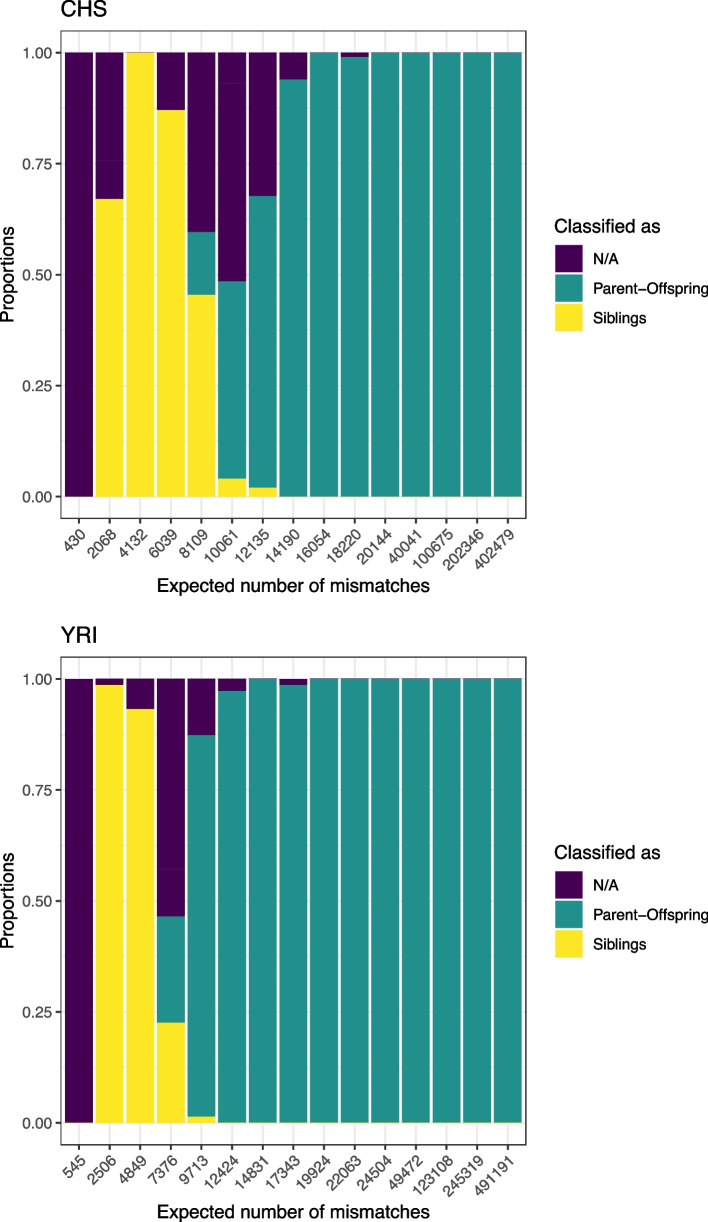
The advent of genome-wide ancient DNA analysis has revolutionized our understanding of prehistoric societies. However, studying biological relatedness in these groups requires tailored approaches due to the challenges of analyzing ancient DNA. READv2, an optimized Python3 implementation of the most widely used tool for this purpose, addresses these challenges while surpassing its predecessor in speed and accuracy. For sufficient amounts of data, it can classify up to third-degree relatedness and differentiate between the two types of first-degree relatedness, full siblings and parent-offspring. READv2 enables user-friendly, efficient, and nuanced analysis of biological relatedness, facilitating a deeper understanding of past social structures.

Keywords: Ancient DNA; Archaeogenomics; Kinship; Relatedness; Software.


Conflict of interest statement

The authors declare that they have no competing interests.

Figures

Fig. 1
Fig. 1
Time (A, B) and memory usage (C, D) comparison of READv1 and READv2 in a cluster node with two Intel Xeon E5 2630 v4 at 2.20 GHz/core CPUs and 128 GB RAM. The resource usage was tested with the dataset from Rivollat et al. [22] with 94 individuals. From the full data, individuals (A, C) and SNPs (B, D) were down-sampled to 75%, 50%, 25%, and 10%. Both tools were run in default settings
Fig. 2
Fig. 2
The power (i.e., the proportion of correctly classified pairs) and false positive rates (proportion of unrelated pairs classified into the respective degree) of READv2 assignment using simulated first-degree (n = 118), second-degree (n = 150), and third-degree pairs (n = 144). The analyses were performed using varying window sizes (1 Mb, 5 Mb, 20 Mb) (additional window sizes are shown in Additional file 1: Fig. S1) and for the genome-wide estimate (“Whole genome”), and also using varying coverages (0.01 × , 0.05 × , 0.1 × , 0.2 × , 0.3 × , 0.4 × , 0.5 × , 1 × , 5 ×). Classification proportions are shown in Additional file 1: Fig. S2. Overall, the genome-wide estimate performs better than any of the window-based methods
Fig. 3
Fig. 3
Number of overlapping SNPs in the simulated dataset (corresponding to the analysis shown in Figs. 2 and S1). Averages of the number of overlapping SNPs out of 200,000 (A) and the expected number of mismatches (B) are shown for each simulated coverage. The error bars show the minimum and maximum values of each corresponding measure. The expected number of mismatches is calculated by the multiplication of the number of overlapping SNPs and the expected pairwise mismatch proportion of unrelated individuals
Fig. 4
Fig. 4
Proportion of windows that are classified as either unrelated or identical/twins. The analysis was done by using a window size of 20 Mb with 68 parent–offspring and 49 sibling pairs. Dashed lines indicate the thresholds chosen to distinguish between parent–offspring and siblings in the classification. The area under the blue dashed line shows the “parent-offspring” zone, while the area between the red lines presents the “siblings” zone. The separation is clear for coverages over 0.5 × and roughly 8000 expected mismatches. As the coverage and the number of expected mismatches reduce, the distributions begin to overlap and the proportions increase overall. Note that the average expected mismatches are slightly different from Fig. 3 as a different subsampling of the full dataset was used for the analysis in Figs. 2 and 3
Fig. 5
Fig. 5
Classification of known parent–offspring pairs in empirical data. The feature was tested with CHS (Han Chinese South) and YRI (Yoruban) populations from the 1000 Genomes Project for different amounts of overlapping SNPs (n = 105 and 122, respectively). Similar to the result of the analysis made with the simulated data, parent–offspring pairs are correctly classified for high numbers of expected mismatches for both populations. As this number reduces, more siblings and N/A classifications start to be seen
Fig. 6
Fig. 6
Standard errors of non-normalized P0 values calculated using diploid-diploid, haploid-diploid, and haploid-haploid comparisons based on simulated genome pairs with known relatedness degrees. Different amounts of overlapping SNPs ranging from 2000 to 50,000 are shown on the x-axis
Fig. 7
Fig. 7
Flowchart of READv2. The novel steps and classification results that differ from READv1 have been highlighted in gray

References

    1. Racimo F, Sikora M, Vander Linden M, Schroeder H, Lalueza-Fox C. Beyond broad strokes: sociocultural insights from the study of ancient genomes. Nat Rev Genet. 2020;21:355–66. 10.1038/s41576-020-0218-z. 10.1038/s41576-020-0218-z - DOI - PubMed
    1. Orlando L, Allaby R, Skoglund P, Der Sarkissian C, Stockhammer PW, Ávila-Arcos MC, et al. Ancient DNA analysis. Nat Rev Methods Primers. 2021;1:1–26. 10.1038/s43586-020-00011-0.10.1038/s43586-020-00011-0 - DOI
    1. Sikora M, Seguin-Orlando A, Sousa VC, Albrechtsen A, Korneliussen T, Ko A, et al. Ancient genomes show social and reproductive behavior of early Upper Paleolithic foragers. Science. 2017;358:659–62. 10.1126/science.aao1807 - DOI - PubMed
    1. Amorim CEG, Vai S, Posth C, Modi A, Koncz I, Hakenbeck S, et al. Understanding 6th-century barbarian social organization and migration through paleogenomics. Nat Commun. 2018;9:3547. 10.1038/s41467-018-06024-4. 10.1038/s41467-018-06024-4 - DOI - PMC - PubMed
    1. O’Sullivan N, Posth C, Coia V, Schuenemann VJ, Price TD, Wahl J, et al. Ancient genome-wide analyses infer kinship structure in an Early Medieval Alemannic graveyard. Science Advances. 2018;4:eaao1262. 10.1126/sciadv.aao1262. 10.1126/sciadv.aao1262 - DOI - PMC - PubMed

LinkOut - more resources