. 2024 Jul 18;3(4):e222.
doi: 10.1002/imt2.222. eCollection 2024 Aug.

Intestinal microbiota by angiotensin receptor blocker therapy exerts protective effects against hypertensive damages

Affiliations

Intestinal microbiota by angiotensin receptor blocker therapy exerts protective effects against hypertensive damages

Jing Li et al. Imeta. .

Abstract

Dysbiosis of the gut microbiota has been implicated in hypertension, and drug-host-microbiome interactions have drawn considerable attention. However, the influence of angiotensin receptor blocker (ARB)-shaped gut microbiota on the host is not fully understood. In this work, we assessed the alterations of blood pressure (BP), vasculatures, and intestines following ARB-modified gut microbiome treatment and evaluated the changes in the intestinal transcriptome and serum metabolome in hypertensive rats. Hypertensive patients with well-controlled BP under ARB therapy were recruited as human donors, spontaneously hypertensive rats (SHRs) receiving normal saline or valsartan were considered animal donors, and SHRs were regarded as recipients. Histological and immunofluorescence staining was used to assess the aorta and small intestine, and 16S rRNA amplicon sequencing was performed to examine gut bacteria. Transcriptome and metabonomic analyses were conducted to determine the intestinal transcriptome and serum metabolome, respectively. Notably, ARB-modified fecal microbiota transplantation (FMT), results in marked decreases in systolic BP levels, collagen deposition and reactive oxygen species accumulation in the vasculature, and alleviated intestinal structure impairments in SHRs. These changes were linked with the reconstruction of the gut microbiota in SHR recipients post-FMT, especially with a decreased abundance of Lactobacillus, Aggregatibacter, and Desulfovibrio. Moreover, ARB-treated microbes contributed to increased intestinal Ciart, Per1, Per2, Per3, and Cipc gene levels and decreased Nfil3 and Arntl expression were detected in response to ARB-treated microbes. More importantly, circulating metabolites were dramatically reduced in ARB-FMT rats, including 6beta-Hydroxytestosterone and Thromboxane B2. In conclusion, ARB-modified gut microbiota exerts protective roles in vascular remodeling and injury, metabolic abnormality and intestinal dysfunctions, suggesting a pivotal role in mitigating hypertension and providing insights into the cross-talk between antihypertensive medicines and the gut microbiome.

Keywords: angiotensin receptor blockers; antihypertensive; gut microbiota; hypertension; vascular injury.


Conflict of interest statement

The authors declare no conflict of interest.

Figures
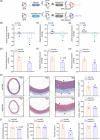
Figure 1
Figure 1
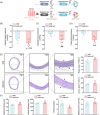
Intestinal microbiota following valsartan administration decreased blood pressure and alleviated vascular fibrosis in SHR recipients. (A) Timeline for the studies in NS or valsartan‐treated donor animals and subsequent FMT to SHR recipients. (B–D) Shifts of systolic, diastolic, and mean blood pressure in donor SHRs before and after NS or valsartan (ARB) (7.4 mg/kg/day) treatment. n = 5 per group. (E–G) Systolic, diastolic, and mean blood pressure (BP) of recipient naive SHRs post FMT. n = 5 for NS‐FMT, n = 4 for ARB‐FMT. (H) Representative photomicrographs and magnifications of Masson staining with aortic cross‐sections in SHRs receiving NS or valsartan‐modified gut microbiota. Scale bars are 200, 100, and 50 μm, respectively. (I) Quantified media thickness, vessel diameter, fibrotic area, media area, lumen area, and media/lumen area ratio of aortas in each FMT recipient group. n = 4 for NS‐FMT, n = 3 for ARB‐FMT. Data are presented as mean ± SEM. *p < 0.05; ns: not significant. ARB, angiotensin receptor blockers (valsartan); ARB‐FMT, rats inoculated with fecal microbiota from valsartan treated SHR; FMT, fecal microbiota transplantation; NS, normal saline; NS‐FMT, rats receiving gut microbiota from normal saline‐treated SHR; SHR, spontaneously hypertensive rat.
Figure 2
Figure 2
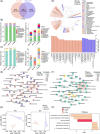
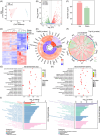
Gut bacteria and potential microbial functions discriminative between saline‐ and valsartan‐microbiota transplanted recipient rats. (A) Venn diagram describing the unique and shared number of operational taxonomic units (OTUs) detected in NS‐FMT and ARB‐FMT groups. The overlap denotes the shared OTUs in both groups. (B) Occurrence frequency of OTUs shared or unique between NS‐FMT and ARB‐FMT groups at phylum and genus levels. (C) Relative abundance of the top 10 most dominant phyla and genera overlapped between groups and those specified in each group. (D) Discrepant taxonomy constitution between SHRs receiving saline or valsartan‐treated microbiota is revealed with Linear discriminant analysis (LDA) effect size (LEfSe). The cladogram and bar plot of the LDA score depict significantly differentially enriched (DE) taxonomic compositions in different groups. The statistical significance of different taxa is defined by LDA scores (log10) > 2 and p < 0.05. (E) Network analysis based on the relative abundance of the top 50 dominant OTUs identifying the co‐occurrence or co‐exclusion relationships across gut microbial members. A node represents OTU, and the relative abundance ratio of OTU in different groups is shown in the pie chart. Different nodes, that is, OTUs, may belong to the same phylum or genus; therefore, there might be distinct nodes with the same name. SparCC algorithm was used to calculate the correlation matrix, and igraph package in the R software was used to construct the co‐occurrence correlation network. (F) OTUs in the co‐occurrence network were annotated to different phyla. The connection edge indicates the correlation between nodes. The red line indicates a positive correlation, and the green line indicates a negative correlation. Similarity, r value of correlation. SparCC algorithm was used to calculate the correlation matrix, and igraph package in the R software was used to construct the co‐occurrence correlation network. (G) Principal coordinate analysis plots based on the Bray Curtis distance of microbial functions in KEGG Orthology (KO) in the left panel (axis 1 and axis 2 explain 39.6% and 36.3% of the overall variation, respectively) and Enzyme Commission (EC) in the right panel (axis 1 and axis 2 explain 42.2% and 33.4% of the overall variation, respectively), respectively, as predicted by Phylogenetic Investigation of Communities by Reconstruction of Unobserved States (PICRUSt2). (H) Functional pathways are significantly distinct between groups based on the MetaCyc database. logFC, log2 (Fold Change of ARB‐FMT/NS‐FMT). p values are denoted in colors.
Figure 3
Figure 3
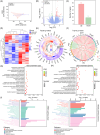
Transcriptome and RNA expression profiles within the intestine of valsartan microbiota‐treated SHRs. (A) Principal component analysis (PCA) based on RNA expression levels in intestinal samples was used to assess differences between groups. PC1 could explain 84% of the variance between groups, and PC2 accounts for 10%. (B, C) Volcano plots and bar plots describe the distribution and number of altered genes in valsartan‐modified microbiota‐treated SHRs when compared with the NS‐FMT controls. Genes with p < 0.05 and |log2FC | >1 are regarded as significantly different; FC, Fold Change. Up in red shows the number of significantly enhanced genes in the ARB‐FMT group (n = 56); Down in green represents the number of dramatically reduced genes (n = 19); NS, the number of genes not significantly altered (n = 17,673). n = 4 for NS‐FMT, n = 3 for ARB‐FMT. (D) Heatmap illustrating the relative abundance of genes significantly discriminative between groups. The abundance of differentially enriched genes is transformed into Z scores by subtracting the average and dividing the standard deviation. The Z score is negative in blue when the abundance is less than the mean and is positive in red when the abundance is higher than the mean. (E) Tree plot depicting the relative abundance of the top 30 most significant genes disparately enriched in groups. (F) Correlation relationship across the top 10 differently expressed genes between groups. Red lines denote a positive association; green lines represent a negative association. (G, H) The top 20 most enriched (according to FDR, adjust p value) Gene Ontology (GO) categories of genes significantly augmented (Up) or dramatically depressed (Down) in the ARB‐FMT group. Number, the number of Up or Down genes annotated to each GO term. The X‐axis represents the rich factor, the differentially enriched gene number ratio versus total annotated gene number in each GO term. (I) The top 20 (according to p value) KEGG pathways of the genes enriched (Up) or deficient (Down) in ARB‐FMT potentially participated in cellular processing, environmental information processing, human diseases, metabolism, organismal systems, or genetic information processing. Distinct categories are depicted in colors.
Figure 4
Figure 4
Fecal microbiota from hypertensive patients treated with ARB improved the therapeutic efficacy of valsartan in SHRs. (A) Study flow for SHRs administrated with valsartan and simultaneously received WC hypertensive patients intestinal flora transplantation or not. WC, hypertensive patients with WC hypertension under ARB therapy as donors for FMT. ARB + WC, SHR recipient animals with both FMT from WC and valsartan interventions. (B–D) Decrease in systolic, diastolic, and mean BP in SHRs following ARB or ARB + WC administration. The reduction of systolic (B), diastolic (C) mean BP (D) in the ARB + WC group was significantly higher than that in the ARB group. n = 5 for ARB, n = 7 for ARB + WC. (E) Representative images of Masson staining performed with aortic cross‐sections. Scale bars are 200, 100, and 50 μm, respectively. (F) Media thickness, vessel diameter, fibrotic area, media area, and lumen area, as well as media/lumen area ratio of the aorta, are quantified. Data are presented as mean ± SEM. n = 5 for ARB, n = 4 for ARB + WC *p < 0.05; **p < 0.01, ns, not significant. ARB, angiotensin receptor blockers; BP, blood pressure; FMT, fecal microbiota transplantation; SHR, spontaneously hypertensive rat; WC, well‐controlled.
Figure 5
Figure 5
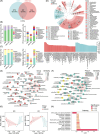
Heterogeneity of intestinal microbial composition and functional capacity between valsartan‐treated SHRs subjected to WC microbiota. (A) Venn diagram showing the distribution of specific and overlapped OTUs between groups. (B) The occurrence frequency of OTUs is simultaneously or uniquely detected in groups illustrated at the phylum and genus levels. (C) Relative abundance of the top 10 most enriched phyla and genera detected in groups. (D) LEfSe with cladogram and bar plot of LDA score uncovers the discrepancy in gut microbial composition between SHRs receiving merely valsartan or valsartan together with FMT. LDA scores (log10) > 2 and p < 0.05 represent statistical significance, and significantly, DE taxa are colored according to groups. (E, F) Network analysis of the top 50 most abundant gut microbial members. Nodes represent OTUs, which are displayed according to the relative abundance ratio in distinct groups (E), or the corresponding phyla assigned to (F). The connection line represents the correlation between OTUs. Red, a positive correlation; green, a negative correlation. Similarity, r value of correlation. (G) Bray Curtis distance of microbial functions in KO and EC as predicted by PICRUSt2 is shown in the PCoA plot. (H) MetaCyc pathways prominently different between groups. logFC, log2 (Fold Change of ARB + WC/ARB). ARB, angiotensin receptor blockers; BP, blood pressure; FMT, fecal microbiota transplantation; OTU, operational taxonomic unit; PCoA, principal coordinate analysis; SHR, spontaneously hypertensive rat; WC, well‐controlled.
Figure 6
Figure 6
Transcriptome profiles of RNA in the intestine are affected by WC microbiota. (A) PCA based on RNA expression profiles in intestinal samples. PC1 accounts for 74% of the variance between groups, and PC2 explains 11%. (B, C) Distribution and number of varied genes in WC microbiota‐treated SHRs when compared with the ARB group. Genes with p < 0.05 and |log2FC | >1 are significantly different; FC, Fold Change. Up/Down, enhanced (n = 1093)/reduced (n = 835) in ARB + WC; NS, not significantly altered (n = 16,380). n = 5 for ARB, n = 8 for ARB + WC. (D) Relative abundance of genes significantly dissimilarly expressed between groups. (E) Tree plot shows the relative abundance of the groups' top 30 most significantly varied genes. (F) Correlation relationship among the top 10 DE genes. Red lines indicate a positive association; green lines indicate a negative association. (G, H) The top 20 most significantly enriched GO terms annotated by genes significantly increased (Up) or dramatically suppressed (Down) in ARB + WC. Dots are sized by the number of Up or Down genes within each term. The x‐axis denotes the ratio of DE gene number versus total annotated gene number in each term. (I) The top 20 most prominent KEGG pathways annotated by genes enriched (Up) or decreased (Down) in ARB + WC. ARB, angiotensin receptor blockers; PCA, principal component analysis; SHR, spontaneously hypertensive rat; WC, well‐controlled.

References

    1. Saladini, Francesca , Mancusi Costantino, Bertacchini Fabio, Spannella Francesco, Maloberti Alessandro, Giavarini Alessandra, and Rosticci Martina, et al. 2020. “Diagnosis and Treatment of Hypertensive Emergencies and Urgencies Among Italian Emergency and Intensive Care Departments. Results From an Italian Survey: Progetto GEAR (Gestione Dell'emergenza E Urgenza in ARea Critica).” European Journal of Internal Medicine 71: 50–56. 10.1016/j.ejim.2019.10.004 - DOI - PubMed
    1. Zhou, Bin , Bentham James, Di Cesare Mariachiara, Bixby Honor, Danaei Goodarz, Cowan Melanie J., and Paciorek Christopher J., et al. 2017. “Worldwide Trends in Blood Pressure from 1975 to 2015: A Pooled Analysis of 1479 Population‐Based Measurement Studies with 19·1 Million Participants.” The Lancet 389: 37–55. 10.1016/s0140-6736(16)31919-5 - DOI - PMC - PubMed
    1. Wang, Zengwu , Chen Zuo, Zhang Linfeng, Wang Xin, Hao Guang, Zhang Zugui, Shao Lan, et al. 2018. “Status of Hypertension in China: Results From the China Hypertension Survey, 2012−2015.” Circulation 137: 2344–2356. 10.1161/circulationaha.117.032380 - DOI - PubMed
    1. Li, Jing , Zhao Fangqing, Wang Yidan, Chen Junru, Tao Jie, Tian Gang, Wu Shouling, et al. 2017. “Gut Microbiota Dysbiosis Contributes to the Development of Hypertension.” Microbiome 5: 14. 10.1186/s40168-016-0222-x - DOI - PMC - PubMed
    1. Li, Jing , Gao Qiannan, Ma Yiyangzi, Deng Yue, Li Shuangyue, Shi Na, Niu Haitao, Liu Xin‐Yu, and Cai Jun. 2022. “Causality of Opportunistic Pathogen Klebsiella Pneumoniae to Hypertension Development.” Hypertension 79: 2743–2754. 10.1161/hypertensionaha.122.18878 - DOI - PubMed

LinkOut - more resources