Review
. 2024 Mar 12;51(4):210-224.
doi: 10.1159/000536556. eCollection 2024 Aug.

Review of ABO Expression and Variations based on Transcriptional Regulation of the ABO Blood Group Gene

Affiliations
Review

Review of ABO Expression and Variations based on Transcriptional Regulation of the ABO Blood Group Gene

Kenichi Ogasawara et al. Transfus Med Hemother. .

Abstract

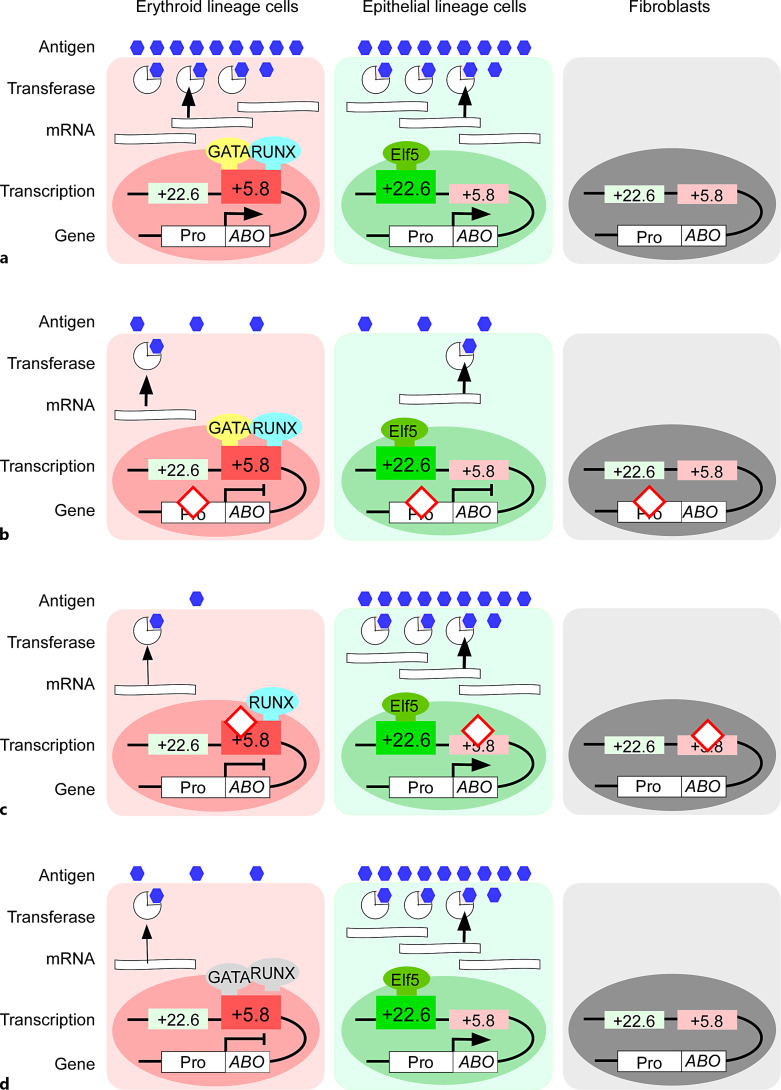
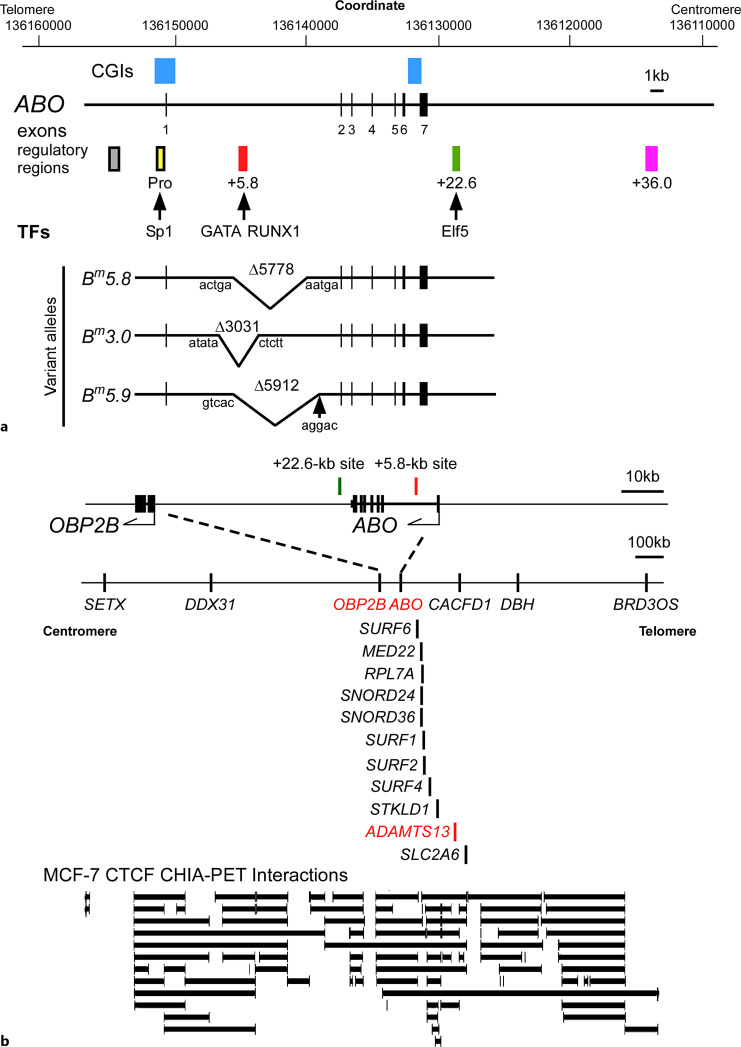
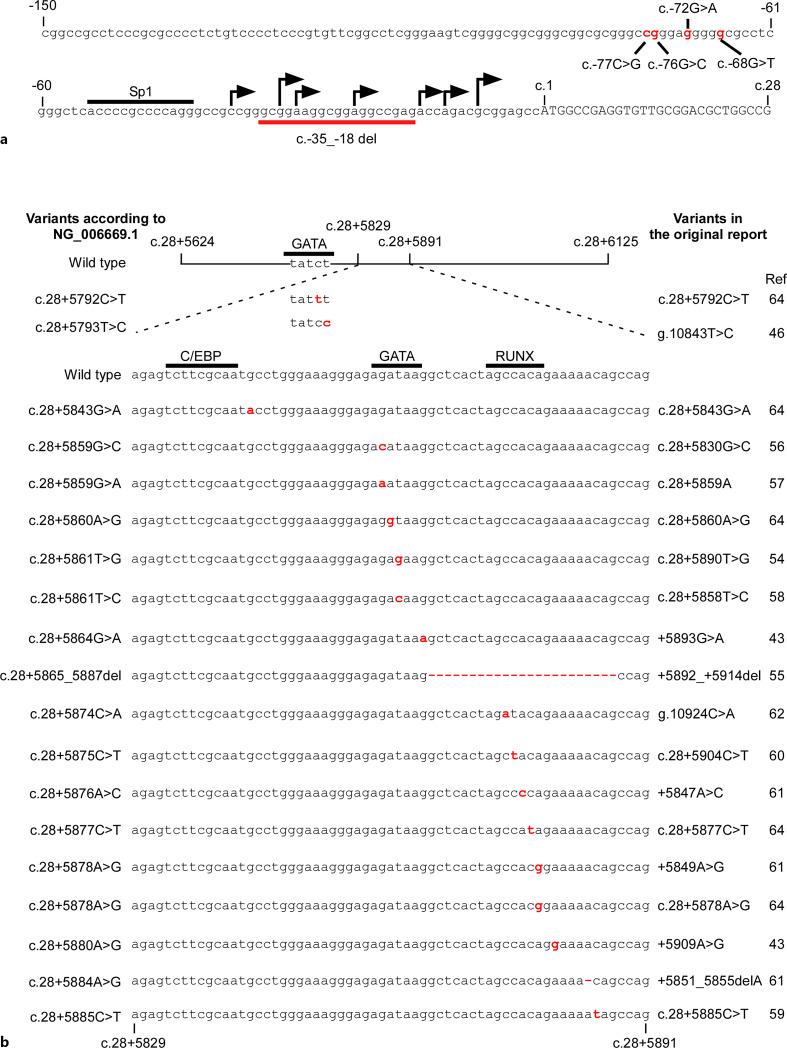
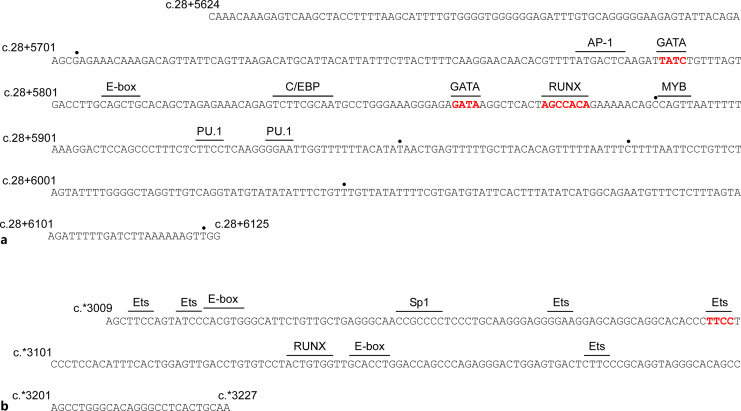
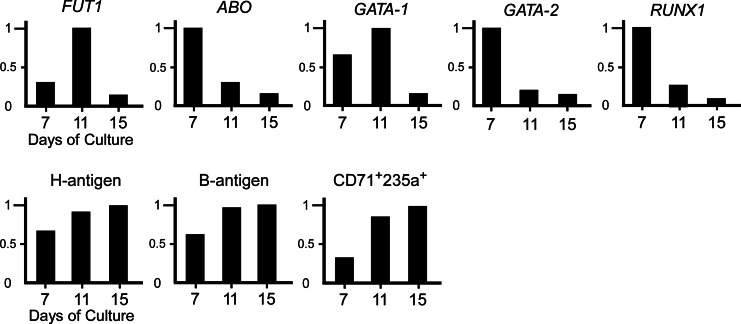
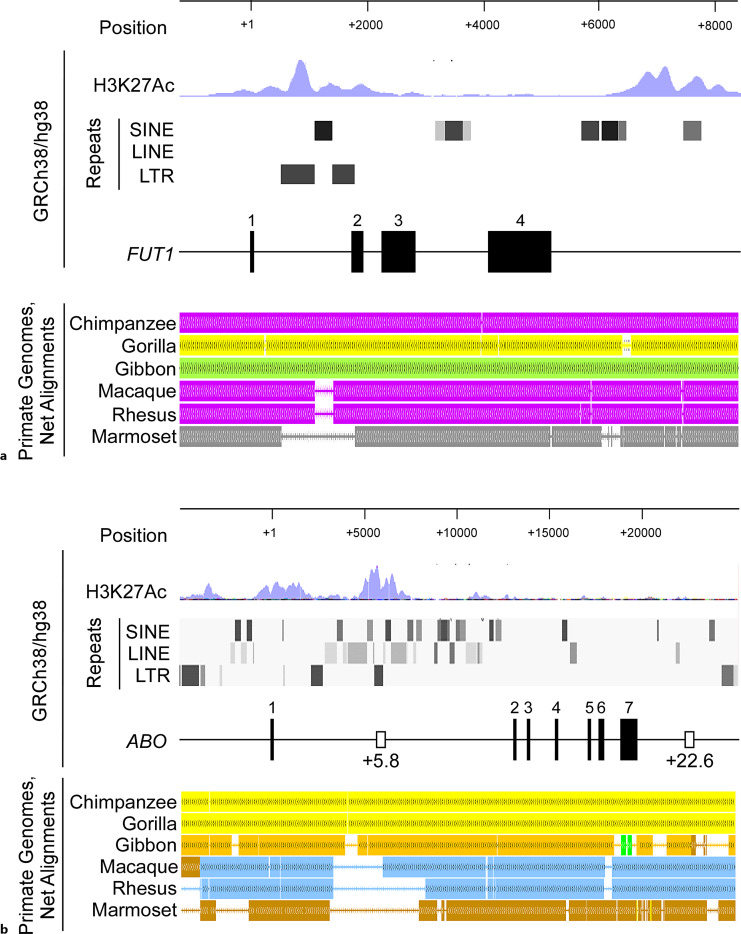
Background and summary: We review the transcriptional regulation of ABO expression and discuss variants in the promoter and erythroid cell-specific regulatory region in individuals with weak ABO phenotypes such as Bm, Am, B3, and A3. We also review the molecular mechanisms responsible for variations in ABO expression in development and disease including the cell type-specific expression of ABO during erythroid cell differentiation, and reduction of A- or B-antigens in cancer cells or on red blood cells in patients with leukemia. Although the relationship between ABO blood group antigens and diseases has been characterized, the physiological significance of the ABO blood group system remains unclear.

Key messages: This review discusses accumulated knowledge of the ABO gene regulation and potential reasons for conservation of ABO during evolution.

Keywords: ABO blood group; ABO gene; Transcriptional regulation; Weak ABO phenotype.


Conflict of interest statement

The authors have no conflicts of interest to declare.

Figures

Fig. 1.
Fig. 1.
Diagrams of ABO expression. aABO expression in individuals with ordinary blood types. ABO is expressed in a cell type-specific manner: ABO is expressed in cells of erythroid and epithelial lineage, but not in fibroblasts. ABO is located on the long arm of chromosome 9, and its transcription is dependent upon the constitutive promoter and cell type-specific regulatory regions such as the +5.8-kb site and +22.6-kb site, followed by production of transferase which synthesizes A- or B-antigens. The +5.8-kb site binds transcription factors RUNX1 and GATA-1/2, whereas the +22.6-kb site interacts with transcription factor Elf5. Those are not expressed in fibroblasts. Hexagon represents A- or B-antigen; Disk indicates transferase; Ribbon denotes transcript or mRNA; curved arrow indicates transcription, while curved arrow with stop represents reduced transcription; Diamonds denote variants in the DNA. bABO expression in individuals of weak ABO phenotype with variant in ABO promoter. cABO expression in individuals of weak phenotype with variant in the +5.8-kb site. dABO expression in individuals with MDS with reduced A-antigen expression on RBCs. RUNX1 or GATA-2 in gray indicates mutated protein.
Fig. 2.
Fig. 2.
Schematics of transcriptional regulation of ABO expression. a Map of the 50-kb region of genomic DNA surrounding human ABO including structures of wild-type ABO and variants with a large deletion in intron 1. Vertical lines and squares indicate exons. In addition, blue squares indicate locations of CpG islands over the structure of ABO. Below the structure, gray square indicates the CCAAT-binding factor/NF-Y enhancer region, yellow square represents the proximal promoter, red square denotes the +5.8-kb site, green square indicates the +22.6-kb sites, and purple represents the DNase I hypersensitive site region +36.0. Pro, promoter: +5.8, the +5.8-kb site: +22.6, the +22.6-kb site: +36.0, region +36.0. Also shown are transcription factors binding to transcriptional regulatory regions. Below the genomic structure of the ordinary ABO, variant alleles with a large deletion including the +5.8-kb site are shown. V-shaped line represents deletion of the sequence. According to HGVS nomenclature using the nucleotide sequences of accession number NG_006669.1 and NM_020469.1 as a reference, Bm3.0 is represented as c.28+4077_7107del, Bm5.8 as c.28+5110_10889del, and Bm5.9 as c.28+5443_11354del, while the variant descriptions were +4105_+7136del [30], +5137_+10914del [37], c.28+5443_29-1655del [38], respectively, in the original paper. Five nucleotides flanking the deletions are shown. b Schematic illustration of the relationship among ABO and the genes around ABO. The top diagram represents the genomic regions including OBP2B, ABO, the +5.8-kb site, and the +22.6-kb site. The ABO exons are indicated by lines or a solid box, and the OBP2B exons are denoted by boxes. The middle diagram indicates genes around ABO. The bottom diagram represents the locations of CTCF-mediated chromatin interactions determined by chromatin interaction analysis with paired-end tag sequencing (ChIA-PET) data extracted from MCF-7 cells which were constructed using publicly available data from ENCODE Chromatin Interactions tracks (http://genome.ucsc.edu). Vertical lines at the ends of horizontal lines correspond to CTCF binding sites, so that TAD might be formed in the regions shown by horizontal lines.
Fig. 3.
Fig. 3.
Alignment of variants within the regulatory regions in weak phenotypes. a Nucleotide sequence of the 5′-flanking region in ABO. Shown is the sequence from position −150 to c.+28 relative to the translation start ATG site of ABO. The upper-case letters denote the coding sequences of exon 1, and the lower case letters the noncoding genomic sequence. High arrows above the sequence indicate the transcription initiation sites that were determined by 5′-RACE using human pancreas cDNA by Yamamoto et al. [7], and low arrows denote the transcription initiation sites that were determined by in vitro erythroid culture of AC133-CD34+ cells [39]. The proximal ABO promoter is located between −150 and −2 relative to the ATG translation start site [42, 43]. The recognition motif for transcription factor Sp1 is indicated by an overbar. Variants in ABO promoter were found in individuals with A3 and B3: Nucleotide substitutions at −77, −76, −72, and −68 are indicated in red, and the deletion between −35 and −18 is denoted by an underbar. b Alignment of variants within the +5.8-kb site found in weak phenotypes. The top diagram represents the +5.8-kb site including a variant of the upstream GATA motif. The bottom diagram indicates the sequences between c.28+5829 and c.28+5891 in intron 1 of ABO. The motifs for transcription factors are indicated by overbars, whereas the putative C/EBP recognition motif has not been investigated. The nucleotide substitutions that were found in the weak phenotypes are shown in red, and the nucleotide deletion of 23-bp is indicated by horizontal lines in red. Those variants are described on the left side of the nucleotide sequence according to HGVS nomenclature using the nucleotide sequences of accession numbers NG_006669.1 and NM_020469.1 as a reference. The variant descriptions in the original reports and the corresponding references are shown on the right side of the sequence.
Fig. 4.
Fig. 4.
Nucleotide sequences of the +5.8-kb and +22.6-kb sites. Nucleotide sequences of the +5.8-kb site and the +22.6-kb site are shown in panels a and b, respectively. The +5.8-kb site is located between c.28+5624 and c.28+6125, and the +22.6-kb site between c.*3009 and c.*3227. Positions of these nucleotides are described according to HGVS nomenclature using the nucleotide sequence accession numbers NG_006669.1 and NM_020469.1 as a reference. The sequence was derived from a haplotype ABOInt1*01, whereas dots over nucleotides indicate those with single nucleotide polymorphisms [57]. The motifs for several relevant transcription factors and E-box are indicated by overbars. The nucleotides in red were observed to be involved in binding to transcription factors such as GATA-1/2, RUNX1, and Elf5 [–58].
Fig. 5.
Fig. 5.
Schematic illustration of the expression of cell surface antigens and genes during the course of in vitro erythroid cell differentiation. The diagrams were constructed using the expression of genes such as FUT1, ABO, GATA-1, GATA-2, and RUNX1 as well as the cell surface expression of H-antigen and B-antigen 7, 11, and 15 days after in vitro erythroid cell differentiation from CD34+ cells as previously reported [69]. The time course of the relative expression of individual genes or antigens is indicated. The maximum gene expression or cell population showing antigen expression during erythroid differentiation is expressed as 1.0 on the vertical axis, whereas the relative expression ratios at other time points are calculated for individual genes and antigens. Although the original report [69] did not show change in the ratios of cells expressing CD71 antigen and CD235 antigen as control, those are shown in the diagram.
Fig. 6.
Fig. 6.
Homology of nucleotide sequences from the upstream to downstream regions of ABO or FUT1 between human and non-human primates. a Human FUT1. b Human ABO. In the diagrams, upper panel shows positions relative to the transcription start site of FUT1 or ABO. The second panel from the top indicates the acetylation at lysine 27 of histone 3 in FUT1 or ABO, often found near active regulatory elements, which was demonstrated by ENCODE Regulation Tracks. The third panel from the top denotes repeating elements including SINE, LINE, and LTR, which were revealed by RepeatMasker over the genomic structure of FUT1 or ABO. The fourth panel shows the genomic structure from the upstream region through FUT1 or ABO to the downstream region, including exons, as well as regulatory regions such as the +5.8- and +22.6-sites for erythroid cells and epithelial cells, respectively, on the basis of the human genome draft GRCh38/hg38. Exons are denoted by filled boxes, and the regulatory regions are indicated by empty boxes. The fifth panel shows a comparison of the human genome sequences with their reference sequences in non-human primates including chimpanzee, gorilla, gibbon, crab-eating macaque, rhesus macaque, and marmoset using Primate Genomes, Chain and Net alignments [93].

Similar articles

Cited by

References

    1. Landsteiner K. Zur Kenntnis der antifermentativen, lytischen und agglutinierenden Wirkungen des Blutserums und der Lymphe. Zentralblatt Bakteriologie. 1900;27:357–62.
    1. LandsteinerÜber K. Agglutinationserscheinungen normalen menschlichen Blutes. Wien Klin Woschenschr. 1901;14:1132–4.
    1. Daniels G. ABO, H, and Lewis systems. In: Daniels G, editor. Human blood groups. 3rd ed. West Sussex: Wiley-Blackwell; 2013. p. 11–95.
    1. Clausen H, White T, Takio K, Titani K, Stroud M, Holmes E, et al. . Isolation to homogeneity and partial characterization of a histo-blood group A defined Fucα1→2Galα1→3-N-acetylgalactosaminyltransferase from human lung tissue. J Biol Chem. 1990;265:1139‒45. - PubMed
    1. Yamamoto F, Clausen H, White T, Marken J, Hakomori S. Molecular genetic basis of the histo-blood group ABO system. Nature. 1990;345(6272):229–33. - PubMed

LinkOut - more resources