

Multiomic profiling of new-onset kidney function decline: insights from the STANISLAS study cohort with a 20-year follow-up
- PMID: 39135941
- PMCID: PMC11317839
- DOI: 10.1093/ckj/sfae224
Multiomic profiling of new-onset kidney function decline: insights from the STANISLAS study cohort with a 20-year follow-up
Abstract
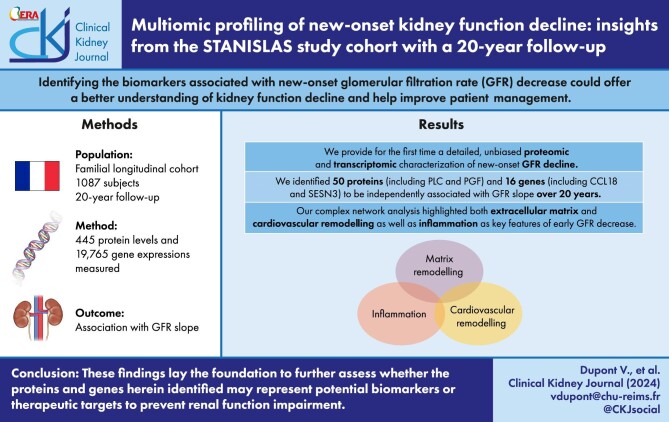
Background: Identifying the biomarkers associated with new-onset glomerular filtration rate (GFR) decrease in an initially healthy population could offer a better understanding of kidney function decline and help improving patient management.
Methods: Here we described the proteomic and transcriptomic footprints associated with new-onset kidney function decline in an initially healthy and well-characterized population with a 20-year follow-up. This study was based on 1087 individuals from the familial longitudinal Suivi Temporaire Annuel Non-Invasif de la Santé des Lorrains Assurés Sociaux (STANISLAS) cohort who attended both visit 1 (from 1993 to 1995) and visit 4 (from 2011 to 2016). New-onset kidney function decline was approached both in quantitative (GFR slope for each individual) and qualitative (defined as a decrease in GFR of >15 ml/min/1.7 m2) ways. We analysed associations of 445 proteins measured both at visit 1 and visit 4 using Olink Proseek® panels and 119 765 genes expressions measured at visit 4 with GFR decline. Associations were assessed using multivariable models. The Bonferroni correction was applied.
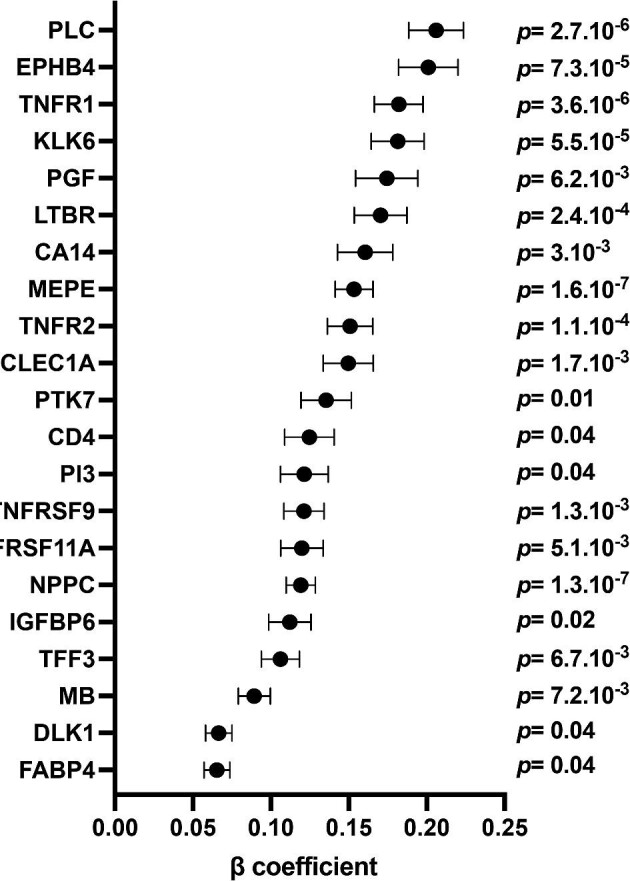
Results: We found several proteins (including PLC, placental growth factor (PGF), members of the tumour necrosis factor receptor superfamily), genes (including CCL18, SESN3), and a newly discovered miRNA-mRNA pair (MIR1205-DNAJC6) to be independently associated with new-onset kidney function decline. Complex network analysis highlighted both extracellular matrix and cardiovascular remodelling (since visit 1) as well as inflammation (at visit 4) as key features of early GFR decrease.
Conclusions: These findings lay the foundation to further assess whether the proteins and genes herein identified may represent potential biomarkers or therapeutic targets to prevent renal function impairment.
Keywords: glomerular filtration rate; proteomic; transcriptomic.
© The Author(s) 2024. Published by Oxford University Press on behalf of the ERA.
Conflict of interest statement
The authors have nothing to disclose.
Figures


Similar articles
-
Association between eating behaviour and 13-year cardiovascular damages in the initially healthy STANISLAS cohort.Eur J Prev Cardiol. 2023 Mar 1;30(4):349-357. doi: 10.1093/eurjpc/zwac287. Eur J Prev Cardiol. 2023. PMID: 36626936
-
Impact of Uric Acid on Hypertension Occurrence and Target Organ Damage: Insights From the STANISLAS Cohort With a 20-Year Follow-up.Am J Hypertens. 2020 Sep 10;33(9):869-878. doi: 10.1093/ajh/hpaa030. Am J Hypertens. 2020. PMID: 32267470
-
Weak Association Between Genetic Markers of Hyperuricemia and Cardiorenal Outcomes: Insights From the STANISLAS Study Cohort With a 20-Year Follow-Up.J Am Heart Assoc. 2022 May 3;11(9):e023301. doi: 10.1161/JAHA.121.023301. Epub 2022 Apr 26. J Am Heart Assoc. 2022. PMID: 35470676 Free PMC article.
-
PCSK9 Protein and rs562556 Polymorphism Are Associated With Arterial Plaques in Healthy Middle-Aged Population: The STANISLAS Cohort.J Am Heart Assoc. 2020 Apr 7;9(7):e014758. doi: 10.1161/JAHA.119.014758. Epub 2020 Mar 25. J Am Heart Assoc. 2020. PMID: 32208829 Free PMC article.
-
Circulating Biomarkers and Cardiac Structure and Function in Rheumatoid Arthritis.Front Cardiovasc Med. 2021 Nov 18;8:754784. doi: 10.3389/fcvm.2021.754784. eCollection 2021. Front Cardiovasc Med. 2021. PMID: 34869664 Free PMC article.
References
-
- Foreman KJ, Marquez N, Dolgert A et al. Forecasting life expectancy, years of life lost, and all-cause and cause-specific mortality for 250 causes of death: reference and alternative scenarios for 2016–40 for 195 countries and territories. Lancet North Am Ed 2018;392:2052–90. 10.1016/S0140-6736(18)31694-5 - DOI - PMC - PubMed
LinkOut - more resources
Full Text Sources
