. 2024 Jul 29:15:1438198.
doi: 10.3389/fimmu.2024.1438198. eCollection 2024.

Single-cell RNA sequencing reveals that MYBL2 in malignant epithelial cells is involved in the development and progression of ovarian cancer

Affiliations

Single-cell RNA sequencing reveals that MYBL2 in malignant epithelial cells is involved in the development and progression of ovarian cancer

Wenwen Shao et al. Front Immunol. .

Abstract

Background: Ovarian carcinoma (OC) is a prevalent gynecological malignancy associated with high recurrence rates and mortality, often diagnosed at advanced stages. Despite advances in immunotherapy, immune exhaustion remains a significant challenge in achieving optimal tumor control. However, the exploration of intratumoral heterogeneity of malignant epithelial cells and the ovarian cancer tumor microenvironment is still limited, hindering our comprehensive understanding of the disease.

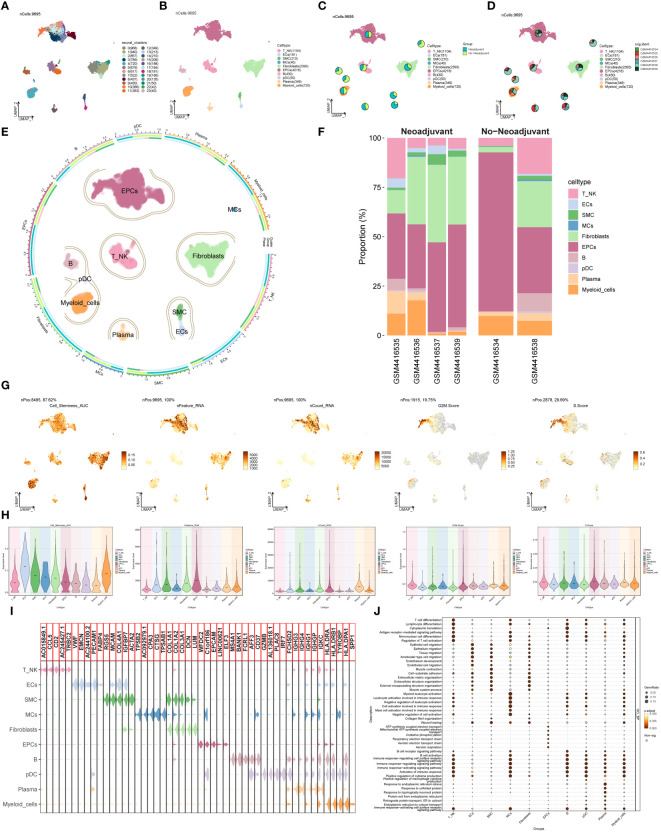
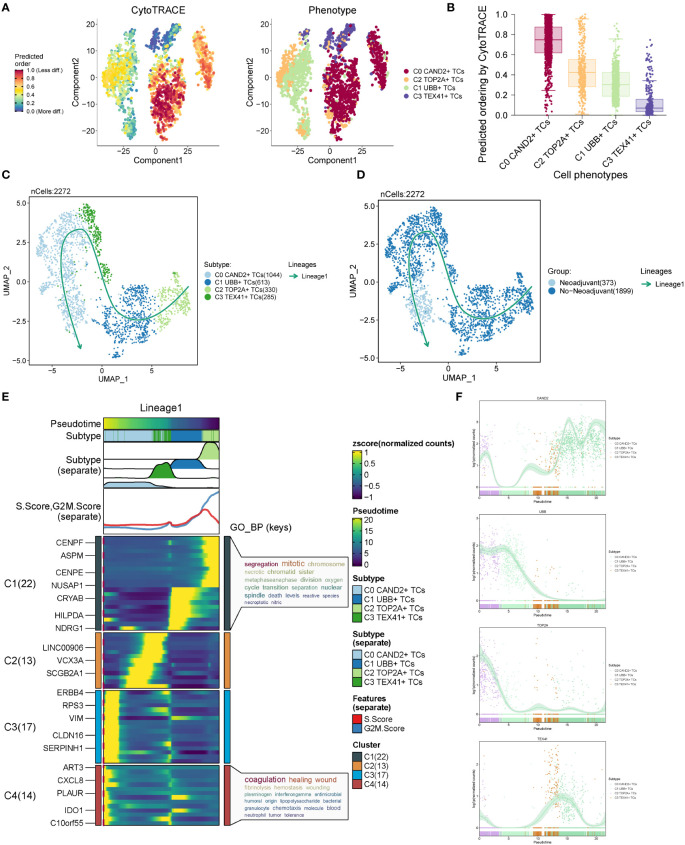
Materials and methods: Utilizing single-cell RNA sequencing (scRNA-seq), we comprehensively investigated the cellular composition across six ovarian cancer patients with omental metastasis. Our focus centered on analysis of the malignant epithelial cells. Employing CytoTRACE and slingshot pseudotime analyses, we identified critical subpopulations and explored associated transcription factors (TFs) influencing ovarian cancer progression. Furthermore, by integrating clinical factors from a large cohort of bulk RNA sequencing data, we have established a novel prognostic model to investigate the impact of the tumor immune microenvironment on ovarian cancer patients. Furthermore, we have investigated the condition of immunological exhaustion.

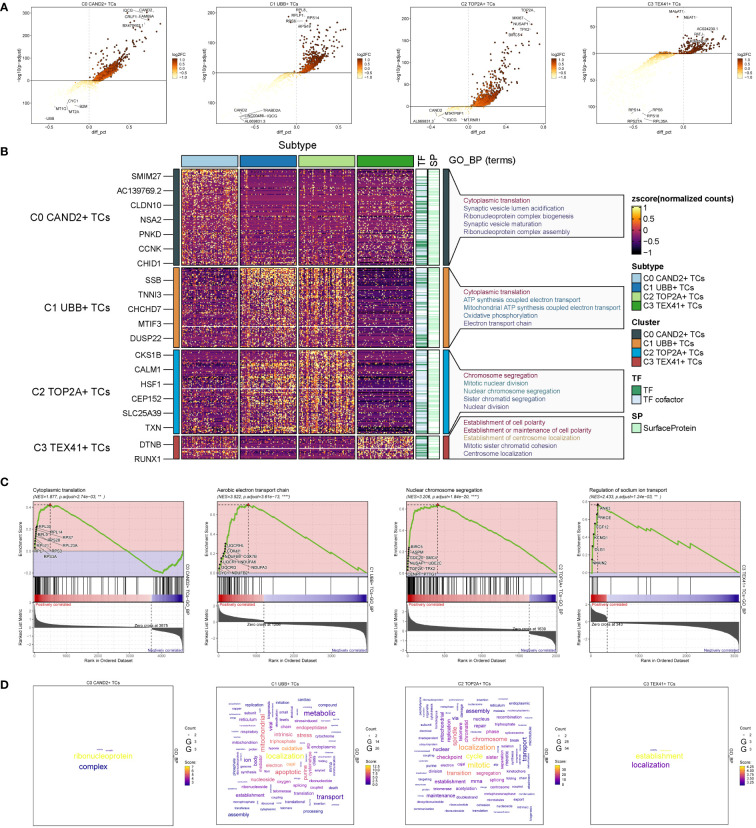
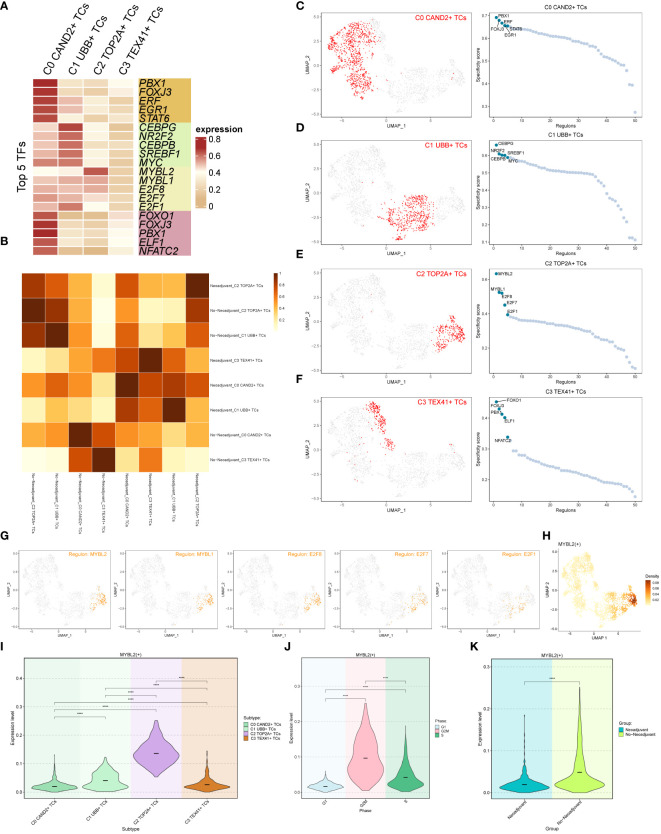
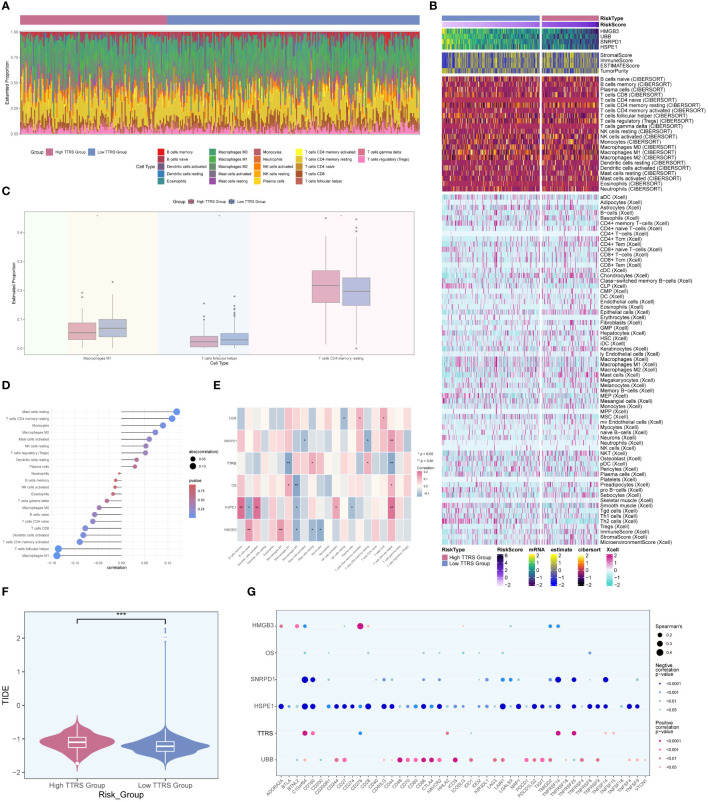
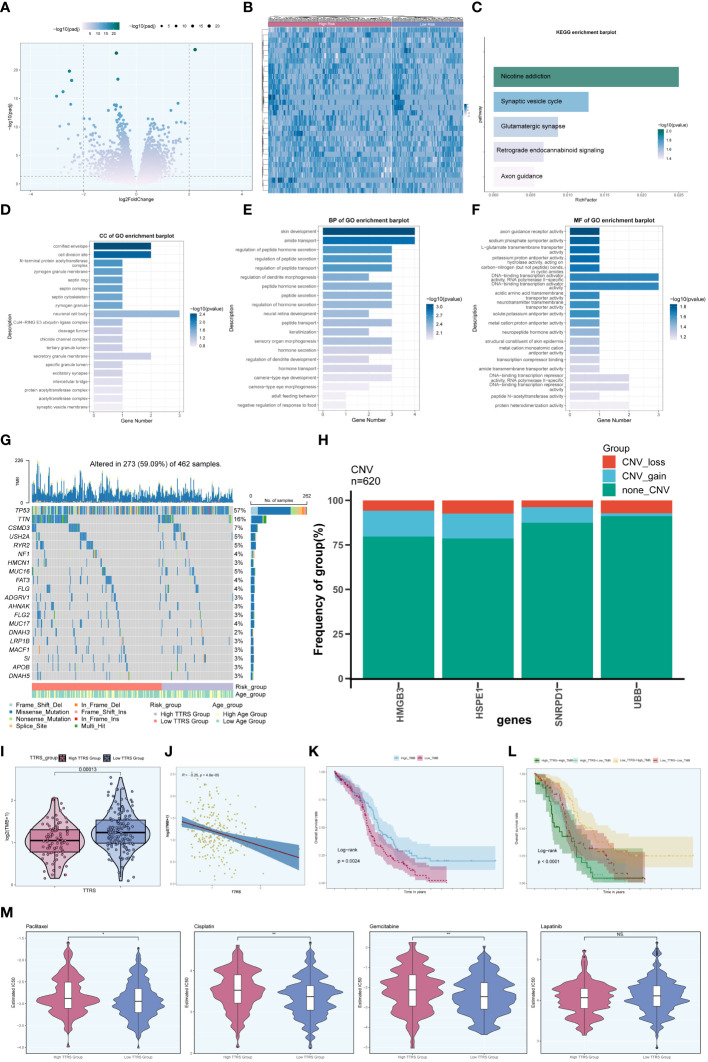
Results: Our study identified a distinct and highly proliferative subgroup of malignant epithelial cells, known as C2 TOP2A+ TCs. This subgroup primarily consisted of patients who hadn't received neoadjuvant chemotherapy. Ovarian cancer patients with elevated TOP2A expression exhibited heightened sensitivity to neoadjuvant chemotherapy (NACT). Moreover, the transcription factor MYBL2 in this subgroup played a critical role in ovarian cancer development. Additionally, we developed an independent prognostic indicator, the TOP2A TCs Risk Score (TTRS), which revealed a correlation between the High TTRS Group and unfavorable outcomes. Furthermore, immune infiltration and drug sensitivity analyses demonstrated increased responsiveness to Paclitaxel, Cisplatin, and Gemcitabine in the Low TTRS Group.

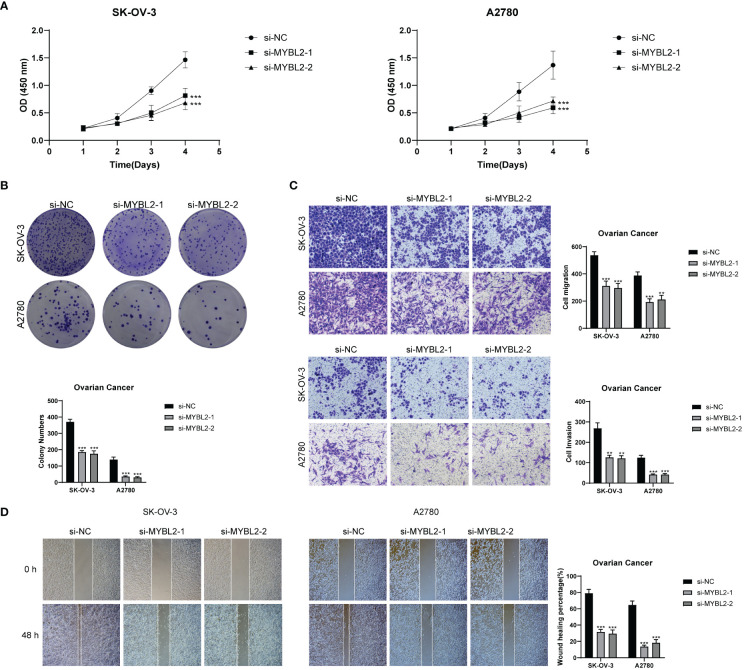
Conclusion: This research deepens our understanding of malignant epithelial cells in ovarian cancer and enhances our knowledge of the ovarian cancer immune microenvironment and immune exhaustion. We have revealed the heightened susceptibility of the C2 TOP2A+ TCs subgroup to neoadjuvant chemotherapy and emphasized the role of MYBL2 within the C2 subgroup in promoting the occurrence and progression of ovarian cancer. These insights provide valuable guidance for the management of ovarian cancer treatment.

Keywords: epithelial cells; immune microenvironment; neoadjuvant chemotherapy; omentum; ovarian cancer; single-cell RNA sequencing.


Conflict of interest statement

The authors declare that the research was conducted in the absence of any commercial or financial relationships that could be construed as a potential conflict of interest.

Figures

Figure 1
Figure 1
Main cell types of ovarian cancer. (A) UMAP visualization exhibited 24 distinct seurat clusters comprising 9,695 high-quality cells from ovarian cancer. (B) UMAP plot showcasing the distribution of 10 cell types. (C, D) UMAP plots combined with pie charts illustrating tissue types (Neoadjuvant and No−Neoadjuvant) and sample sources for each cell type. (E) Comprehensive UMAP plot displaying the distribution of each cell type, along with its cell cycle and tissue type ratio. (F) Bar graph demonstrating sample sources and the proportion of cell types in two tissue types (Neoadjuvant and No−Neoadjuvant). (G, H) UMAP and violin plots revealing the Cell_Stemness_AUC, nFeature_RNA, nCount_RNA, G2M.Score, and S.Score for each cell type, respectively. (I) Violin plot displaying the top 5 marker genes of each cell type. (J) Bubble chart presenting the results of GOBP enrichment analysis for DEGs from diverse cell types.
Figure 2
Figure 2
Subgroup identification of ovarian cancer. (A) UMAP visualization showing the arrangement of four distinct seurat clusters within ovarian cancer epithelial cells. (B-D) UMAP plots and pie charts displaying the origins of samples, cell cycle stages (G1, G2M, and S), and various tissue categories (Neoadjuvant and No−Neoadjuvant) within the four subgroups. (E) A comprehensive UMAP plot illustrating the distribution of each sub-cluster, along with its cell cycle ratio and tissue type ratio. (F, G) Cell_Stemness_AUC, CNVScore, nFeature_RNA, nCount_RNA, G2M.Score, and S.Score of each subgroup displayed in UMAP plots and violin plots. (H) Bar graphs illustrating the subgroup proportion and tissue types of different samples. (I, J) Heatmaps showing the tissue types and cell cycle preferences of the four subgroups, respectively. (K, L) Distribution of named genes for the four subgroups visualized using UMAP plots and violin plots for each subgroup. (M) Bubble chart displaying the top 10 marker genes for each subgroup, along with their expression levels in various tissue types. *P < 0.05; **P < 0.01; ***P < 0.001; and ****P < 0.0001; ns indicated no significant difference.
Figure 3
Figure 3
Identification and enrichment analysis of subgroup DEGs in ovarian cancer. (A) Volcano plots presenting DEGs of four cell subsets. (B) Heatmap displaying the Gene Ontology Biological Process enrichment terms of Differentially Expressed Genes in four distinct cell populations. (C) Results of GSEA enrichment analysis on four cell subsets. (D) Cloud charts displaying the outcomes of GO-BP enrichment analysis based on the gene count.
Figure 4
Figure 4
CytoTRACE analysis and pseudotime analysis of cell subsets. (A) CytoTRACE analysis results of four cell subsets. In the left panel, dark green indicated greater differentiation (low stemness), while dark red indicated less differentiation (high stemness). In the right panel, different colors represented different ovarian cancer subgroups. (B) CytoTRACE scores for four cell subsets were displayed. (C) UMAP plot presenting the results of slingshot pseudotime analysis of four cell subsets. The specific pseudotime trajectories of the four cell subsets were C2 TOP2A+ TCs → C1 UBB+ TCs → C3 TEX41+ TCs → C0 CAND2+ TCs, constituting one lineage in total. (D) UMAP plots showing the pseudotime trajectory of different tissue types: No−Neoadjuvant →Neoadjuvant. (E) Heatmap displaying the changes of DEGs in each subset with pseudotime and the results of GO-BP enrichment analysis. (F) Scatter plots exhibiting the changing trend of named genes in four subgroups with pseudotime.
Figure 5
Figure 5
Transcription factor (TF) analysis of ovarian cancer subgroups. (A) Heatmap displaying the top 5 transcription factors (TFs) of the four subgroups. (B) Heatmap illustrating the correlation between two tissue types (Neoadjuvant and No−Neoadjuvant) of the four subgroups. (C-F) UMAP plots and scatter plots showcasing the TF ranking of each subgroup and its distribution, respectively. (G) UMAP plot displaying the distribution of the C2 subgroup’s top 5 TFs in each subgroup. (H) Density distribution of the C2 subgroup Top 1 TF (MYBL2). (I-K) Violin plots exhibiting the expression level of MYBL2 in each subgroup (I), each cell cycle (J), and each tissue type (K), respectively.
Figure 6
Figure 6
Subgroup interaction analysis. (A, B) Circle plots displaying the intensity (A) and number (B) of interactions between large groups and subgroups of ovarian cancer. The thicker the line between the two cell types, the greater the strength or quantity of the interaction. (C) Sankey diagrams presenting the deduced incoming communication patterns of target cells. (D) Sankey charts illustrating the deduced outward communication patterns in secreting cells. (E) Heatmap revealing outgoing and incoming signaling patterns for all subgroups. (F, G) Dot plots showing the receptor-ligand pairs of the C2 subgroup and other subgroups, along with their interaction intensity.
Figure 7
Figure 7
Exhaustion pathway analysis. (A) The UMAP and violin plots respectively displayed the expression of different subtypes of malignant ovarian cancer epithelial cells in the Associated with Epithelial-Mesenchymal-Transition Mediated T Cell Exhaustion Pathway. (B) The UMAP and violin plots respectively displayed the expression of different phases of malignant ovarian cancer epithelial cells in the Associated with Epithelial-Mesenchymal-Transition Mediated T Cell Exhaustion Pathway. (C) The UMAP and violin plots respectively displayed the expression of different groups of malignant ovarian cancer epithelial cells in the Associated with Epithelial-Mesenchymal-Transition Mediated T Cell Exhaustion Pathway. (D–F) The UMAP and violin plots respectively displayed the expression of different subtypes (D), different phases (E), and different groups (F) of malignant ovarian cancer epithelial cells in the Immunomodulatory Interplay Pathway Involving Exhausted Cells. *P < 0.05; **P < 0.01; ***P < 0.001; and ****P < 0.0001; ns indicated no significant difference.
Figure 8
Figure 8
Further analysis of the exhaustion pathway. (A-C) UMAP plots and violin plots respectively showed the expression of the Immunosuppressive Microenvironment Pathway Associated with Exhausted T Cells pathway in different subtypes (A), phases (B), and groups (C) of malignant ovarian epithelial cells. (D–F) UMAP plots and violin plots respectively showed the expression of the pathway Mediate the Crosstalk Between Tumor Intermediate State and the T Exhausted State in different subtypes (D), phases (E), and groups (F) of malignant ovarian epithelial cells. *P < 0.05 and ****P < 0.0001; ns indicated no significant difference.
Figure 9
Figure 9
Development and correlation analysis of the TOP2A TCs Risk Score (TTRS). (A) LASSO regression analysis yielding optimal results with a lambda.min value of 0.003. (B) Kaplan-Meier survival curve of the high TOP2A TCs Risk Score (TTRS) group and the low TTRS group. (C) ROC curves displaying the AUCs for 1, 3, and 5-year intervals. (D) Scatter plots and curve plots illustrating the survival state of high and low TTRS groups over time and the situation of TOP2A TCs Risk Score (TTRS) (left). Heatmap displaying the distribution of prognosis-related genes in the high TTRS group and the low TTRS group (right). (E) Forest plot presenting the outcomes of multivariate Cox analysis for clinical factors and risk scores in the training cohort. (F) Nomogram model constructed based on the TOP2A TCs Risk Score (TTRS), incorporating race, age, and grade. (G) ROC curves evaluating the prediction sensitivity of the nomogram model through the analysis of AUC scores. (H) Boxplot displaying the C-index of the AUC at 1, 3, and 5 years. (I) Scatter plots and heatmaps showing the pairwise correlations among four prognosis-related genes, OS, and TOP2A TCs Risk Score (TTRS). (J) Ridge plots and boxplots illustrating the expression levels of four prognosis-associated genes in groups with high and low TTRS. (K) Boxplots displaying the expression levels of four predictive genes in high and low Age groups. **P < 0.01 and ***P < 0.001; ns indicated no significant difference.
Figure 10
Figure 10
Analysis of immune infiltration in high and low TTRS groups. (A) Stacked bar chart displaying the distribution of 22 types of immune infiltrating cells in the high TTRS group and the low TTRS group. (B) Heatmap showing the expression of immune infiltrating cells in the high TTRS group and the low TTRS group. (C) Boxplot illustrating variations in the levels of Macrophages M1, T cells follicular helper, and T cells CD4 memory resting between the high TTRS group and the low TTRS group. (D) Lollipop chart displaying the results of the correlation analysis between immune-infiltrating cells and the TTRS (TOP2A TCs Risk Score). (E) Heatmap displaying the relationship between immune cell infiltration, prognosis-related genes, overall survival (OS), and the risk score of TOP2A tumor cells (TTRS). (F) Violin showing the difference in the TIDE value between the high TTRS group and the low TTRS group. (G) Bubble chart illustrating the relationship between immune checkpoint genes, prognosis-related genes, OS, and the TTRS. *P < 0.05; **P < 0.01; and ***P < 0.001; ns indicated no significant difference.
Figure 11
Figure 11
Enrichment analysis. (A) Volcano plot presenting DEGs in high and low TTRS groups. (B) Heatmap displaying the differential distribution of DEGs in the high TTRS group and the low TTRS group. (C) KEGG enrichment analysis results of DEGs. (D-F) GOCC, GOBP and GOMF enrichment analysis results of DEGs. (G) Mutation waterfall plot depicting the occurrence of mutations in the high and low TTRS groups within the training cohort. The top row illustrated the mutation burden for each sample, while the side column showed the overall percentage of genes in these samples. (H) Bar graph showing chromosome copy number variation (CNV) for four genes. Red represented chromosome losses, blue represented chromosome gains, and green represented no chromosome losses or gains. (I) Violin plot displaying Tumor Mutation Burden (TMB) values for high and low TTRS groups (P = 0.00013). (J) Scatter plot illustrating the relationship between TMB and the risk score of TOP2A TCs, known as TTRS. (K, L) Kaplan-Meier survival curves for the high TMB group and the low TMB group, the high TTRS-high TMB group, the high TTRS-low TMB group, the low TTRS-high TMB group, and the low TTRS-low TMB group. (M) Violin plots showing the difference in drug sensitivity between high and low TTRS groups. *P < 0.05 and **P < 0.01; ns indicated no significant difference.
Figure 12
Figure 12
In Vitro Experimental Validation. (A) CCK-8 assay showing a notable reduction in cell viability in the SK-OV-3 and A2780 cell lines after MYBL2 knockdown. (B) Plate cloning assay demonstrating a significant decrease in cell colony counts following MYBL2 knockdown compared to the negative control group. (C) Transwell assay displaying a significant reduction in cell migration and invasion in both SK-OV-3 and A2780 cell lines after MYBL2 knockdown. (D) The wound healing assay revealed a significant decrease in the migration rate of SK-OV-3 and A2780 cells with MYBL2 knockdown. **P < 0.01 and ***P < 0.001.

Similar articles

Cited by

References

    1. Lengyel E. Ovarian cancer development and metastasis. Am J Pathol. (2010) 177:1053–64. doi: 10.2353/ajpath.2010.100105 - DOI - PMC - PubMed
    1. Kipps E, Tan DS, Kaye SB. Meeting the challenge of ascites in ovarian cancer: new avenues for therapy and research. Nat Rev Cancer. (2013) 13:273–82. doi: 10.1038/nrc3432 - DOI - PMC - PubMed
    1. Lheureux S, Braunstein M, Oza AM. Epithelial ovarian cancer: Evolution of management in the era of precision medicine. CA Cancer J Clin. (2019) 69:280–304. doi: 10.3322/caac.21559 - DOI - PubMed
    1. Matulonis UA, Lorusso D, Oaknin A, Pignata S, Dean A, Denys H, et al. . Efficacy and safety of mirvetuximab soravtansine in patients with platinum-resistant ovarian cancer with high folate receptor alpha expression: results from the SORAYA study. J Clin Oncol. (2023) 41:2436–45. doi: 10.1200/JCO.22.01900 - DOI - PMC - PubMed
    1. Eisenhauer EA. Real-world evidence in the treatment of ovarian cancer. Ann Oncol. (2017) 28:viii61–65. doi: 10.1093/annonc/mdx443 - DOI - PubMed

MeSH terms

LinkOut - more resources