. 2024 Jul 29:15:1381091.
doi: 10.3389/fimmu.2024.1381091. eCollection 2024.

The longitudinal characterization of immune responses in COVID-19 patients reveals novel prognostic signatures for disease severity, patients' survival and long COVID

Affiliations

The longitudinal characterization of immune responses in COVID-19 patients reveals novel prognostic signatures for disease severity, patients' survival and long COVID

Maddalena Noviello et al. Front Immunol. .

Abstract

Introduction: SARS-CoV-2 pandemic still poses a significant burden on global health and economy, especially for symptoms persisting beyond the acute disease. COVID-19 manifests with various degrees of severity and the identification of early biomarkers capable of stratifying patient based on risk of progression could allow tailored treatments.

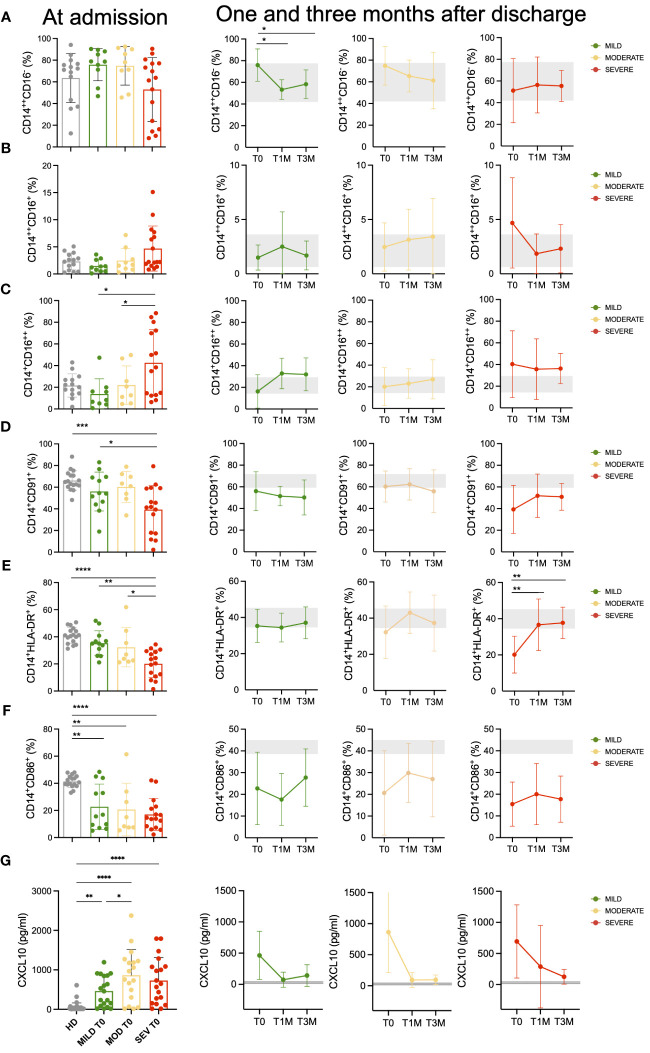
Methods: We longitudinally analyzed 67 patients, classified according to a WHO ordinal scale as having Mild, Moderate, or Severe COVID-19. Peripheral blood samples were prospectively collected at hospital admission and during a 6-month follow-up after discharge. Several subsets and markers of the innate and adaptive immunity were monitored as putative factors associated with COVID-19 symptoms.

Results: More than 50 immunological parameters were associated with disease severity. A decision tree including the main clinical, laboratory, and biological variables at admission identified low NK-cell precursors and CD14+CD91+ monocytes, and high CD8+ Effector Memory T cell frequencies as the most robust immunological correlates of COVID-19 severity and reduced survival. Moreover, low regulatory B-cell frequency at one month was associated with the susceptibility to develop long COVID at six months, likely due to their immunomodulatory ability.

Discussion: These results highlight the profound perturbation of the immune response during COVID-19. The evaluation of specific innate and adaptive immune-cell subsets allows to distinguish between different acute and persistent COVID-19 symptoms.

Keywords: COVID-19 patients’ survival; COVID-19 severity; SARS-CoV-2 adaptive immunity; SARS-CoV-2 innate immunity; long COVID.


Conflict of interest statement

The authors declare that the research was conducted in the absence of any commercial or financial relationships that could be construed as a potential conflict of interest. The author(s) declared that they were an editorial board member of Frontiers, at the time of submission. This had no impact on the peer review process and the final decision.

Figures

Figure 1
Figure 1
Monocytes landscape in COVID-19 patients. Monocytes phenotypic characterization of COVID-19 patients compared to age-matched healthy donors (HD). (A-C) Frequencies of classical (CD14++CD16-, (A) intermediate (CD14++CD16+, (B) and non-classical (CD14+CD16++, (C) monocytes on total CD14+ monocytes for Mild, Moderate (MOD) and Severe (SEV) patients at hospital admission are shown and compared to those observed in HD (left panels). Longitudinal analysis at the indicated timepoints: hospital admission (T0), 1 month (T1M) and 3 months after discharge (T3M; middle and right panels). (D-F) Frequencies of CD14+CD91+ (D), CD14+HLA-DR+ (E) and CD14+CD86+ (F) monocytes on total CD14+ monocytes for Mild, Moderate and Severe patients at hospital admission are shown and compared to those observed in HD (left panels). Longitudinal analysis at the indicated timepoints: T0, T1M and T3M (middle and right panels). (G) Plasma levels of CXCL10 for Mild, Moderate and Severe patients at hospital admission are shown and compared to those observed in HD (left panels). Longitudinal analysis at the indicated timepoints: T0, T1M and T3M (middle and right panels). Statistics were calculated by ordinary one-way ANOVA (multiple comparisons). Asterisks represent statistical difference between each patient group and HD: * p<0.05, ** p<0.01, *** p<0.001, **** p<0.0001. Mean with SD are shown.
Figure 2
Figure 2
NK cell subsets are impaired during acute SARS-CoV-2 infection. (A) Percentage of CD56+ NK cell subpopulations (exhausted CD16- and effector CD16+) in healthy donor (HD) and mild, moderate and severe COVID-19 patients, at hospital admission (T0). (B) Longitudinal evaluation of the percentage of exhausted and effector CD16+ NK cells in Mild, Moderate and Severe COVID-19 patients, at the indicated timepoints: hospital admission (T0), 1 month (T1M) and 3 months (T3M) after discharge. Follow-up samples were analyzed from 17 out of 20 mild and 16 out of 20 moderate patients enrolled in the study at T1M and/or T3M, together with 8 patients from severe group that survived to COVID-19 disease. (C) Percentage of NK cell precursors and memory-like NK cells in Mild, Moderate and Severe COVID-19 patients, at T0. (D) Longitudinal evaluation of the percentage of NK-cell precursors and memory-like NK cell subset in Mild, Moderate and Severe COVID-19 patients, at T0, T1M and T3M. (E) Percentage of CD69 positive cells in NK subpopulations (exhausted CD16- and effector CD16+) of HD and Mild, Moderate and Severe COVID-19 patients, at T0. (F) Percentage of activated CD69+ cells in exhausted and effector NK subpopulations of Mild, Moderate and Severe COVID-19 patients, at T0, T1M and T3M. (G) Percentage of NKG2A+ CD69+ (left) and NKG2C+ CD69+ (right) exhausted NK cells in HD and Mild, Moderate and Severe COVID-19 patients, at T0. (H) Percentage of NKG2A+ CD69+ (left) and NKG2C+ CD69+ (right) effector CD16+ NK cells in HD and Mild, Moderate and Severe COVID-19 patients, at T0. Comparison between percentage of activated (CD69+) NKG2A and NKG2C-positive cells in both exhausted (I) and effector CD16+ (J) NK cells of HD and Mild, Moderate and Severe COVID-19 patients, at T0. (A, C, E, G–J) Error bars represent standard deviation (SD). (B, D, F): Gray area represents percentage between the first and third quartiles observed in HD. The dashed gray line represents the average percentage observed in HD. Mean with SEM are shown. Statistical significance is calculated by Kurskal-Wallis’s test, following Dunn correction for multiple comparisons. Asterisks represent statistical difference between each patient group and HD. * p<0.05; ** p<0.01; *** p<0.001; # p < 0.001 of HD population vs all COVID-19 patients. (I, J) Asterisks highlight significant differences by Mann-Whitney’s test.
Figure 3
Figure 3
Phenotype dynamic of peripheral B cells in COVID-19 patients. A 21-color based panel was designed to define B cell phenotype by flow cytometry from 14 healthy donors and COVID-19 patients at T0, T1M, and T3M from hospital discharge with mild (21 pts at T0, 14 pts at T1M, 15 pts at T3M), moderate (17 pts at T0, 16 pts at T1M, 10 pts at T3M) or severe infection (19 pts at T0, 6 pts at T1M, 4 pts at T3M). B cell subsets were defined as naïve CD27-IgD+, unswitched memory (USM) CD27+IgD+, memory CD27+IgD- and double negative memory (DNM) CD27-IgD-. (A) B cell frequency in Naive, USM, Memory and DNM B cell subsets from healthy donors, mild, moderate and severe patients at hospital admission. B cell frequency in the same subsets as in A at T0, T1M, and T3M is reported for (B) mild (C) moderate (D) severe patients (dots as indicated) in comparison with healthy donors (grey bar). Statistics were calculated by tTest multiple comparison: * p<0.05, ** p<0.01. Standard Deviation is reported for each data set.
Figure 4
Figure 4
High dimensional analysis of FACS data revealed the presence of several T-cell clusters deregulated in COVID-19 patients. T-cell phenotypic characterization of COVID-19 patients compared to age-matched healthy donors (HD; unsupervised high dimensional analysis). (A) metaclusters frequencies on total CD3+ cells for Mild, Moderate and Severe patients at hospital admission (T0) are shown and compared to those observed in HD. (B) t-SNE maps and the overlay of HD-specific (left; light and dark gray) and patients-specific (right; yellow and red) metaclusters. (C) percentage of events positive for the indicated markers in HD- and patients-specific metaclusters. Unsupervised high dimensional analysis and clusterization of CD3+ events were performed by cytoChain. (D, E) Validation of the phenotypic signatures associated to HD (D) and patients (E) -specific metaclusters by manual gating. Metacluster frequencies are shown for Mild, Moderate and Severe patients and compared to HD at hospital admission (T0). Mean with Standard deviation are shown. Statistical analysis in A and C were performed by 2way ANOVA (multiple comparisons). Statistical analysis in D and E were performed by ordinary one-way ANOVA (multiple comparisons). (F, G) Longitudinal analysis of the frequencies of the metaclusters of interest on CD3+ T cells at the indicated timepoints: hospital admission (T0), 1 month (T1M) and 3 months (T3M) after discharge for HD (F) and COVID-19 (G)-specific metaclusters. Frequencies are shown for Mild (green), Moderate (yellow) and Severe (red) patients and compared to HD. Grey area represents frequencies of each metacluster on CD3+ T cells between the first and third quartiles observed in HD. The dashed gray line represents the average percentage observed in HD. Mean with SEM are shown. Statistical analysis were performed by 2way ANOVA (multiple comparisons). Asterisks represent statistical difference between each patient group and HD. * p<0.05; ** p<0.01; *** p<0.001; **** p<0.0001.
Figure 5
Figure 5
Magnitude and kinetics of SARS-CoV-2 specific humoral and T-cell responses. Longitudinal analysis of SARS-CoV-2 specific antibody levels (BAU/ml) and neutralizing antibody titers (IC50) (A) in mild, moderate and severe COVID-19 patients at T0, T1M and T3M. Mean with SEM are shown. Gray area represents the values measured in HD included between the first and third quartiles. The dashed gray line represents the average value observed in HD. The dashed black line represents the cutoff of the ELISA tests (10000 BAU/ml) or the lowest dilution (1:77.7) of the neutralization assays. Statistical analysis was performed by Kruskal-Wallis test, following Dunn correction for multiple comparisons. Asterisks represent statistical difference between each patient group and HD. * p<0.05; ** p<0.01; *** p<0.001; **** p<0.0001. (B) IC50 of IgA- and IgG-purified fractions and IgA-IgG-depleted fractions from plasma collected from ten randomly selected moderate and severe patients. Functional T-cell responses measured by IFN-γ ELISpot at the indicated timepoints after stimulation with CD3 and CD28 specific antibodies (C-E) and SARS-CoV-2 Spike and Nucleocapsid peptide pools (F-H). Results are expressed as spot forming cells (SFC)/400’000 PBMC. Frequencies are shown for Mild (green), Moderate (yellow) and Severe (red) patients and compared to HD (grey). Median with 95% CI are shown. Statistical analysis in (C, D, F, G) were performed by ordinary one-way ANOVA (multiple comparisons). Statistics in (E, H) were performed by unpaired tTest. * p<0.05; ** p<0.01; **** p<0.0001.
Figure 6
Figure 6
Decision tree for the classification of disease severity and its impact on patient survival (A) Decision tree for the classification of disease severity. (B) Kaplan−Meier curves and log-rank test for comparing the three groups obtained from the decision tree analysis. The three groups were defined based on the highest frequently category in the final nodes of the decision tree. P-value of pairwise comparisons were adjusted with Bonferroni’s correction.
Figure 7
Figure 7
Decision trees for the occurrence of long COVID at 6 months (A) Decision tree for the occurrence of long COVID at 6 months considering variables evaluated at T0. (B) Decision tree for the occurrence of long COVID at 6 months considering variables evaluated at T1M.

References

    1. Planas D, Saunders N, Maes P, Guivel-benhassine F, Planchais C, Buchrieser J, et al. . Considerable escape of SARS-CoV-2 Omicron to antibody neutralization. Nature. (2022) 602:671–5. doi: 10.1038/s41586-021-04389-z - DOI - PubMed
    1. Markov PV, Ghafari M, Beer M, Lythgoe K, Simmonds P, Stilianakis NI, et al. . The evolution of SARS-coV-2. Nat Rev Microbiol. (2023) 21:361–79. doi: 10.1038/s41579-023-00878-2 - DOI - PubMed
    1. Augello M, Bono V, Rovito R, Tincati C, Marchetti G. Immunologic interplay between HIV/AIDS and COVID−19: adding fuel to the flames? Curr HIV/AIDS Rep. (2023) 20(2):51–75. doi: 10.1007/s11904-023-00647-z - DOI - PMC - PubMed
    1. Corradini P, Agrati C, Apolone G, Mantovani A, Giannarelli D, Marasco V, et al. . Humoral and T-cell immune response after 3 doses of messenger RNA severe acute respiratory syndrome coronavirus 2 vaccines in fragile patients: the italian VAX4FRAIL study. Clin Infect Dis. (2023) 76:426–38. doi: 10.1093/cid/ciac404 - DOI - PMC - PubMed
    1. Wouters OJ, Shadlen KC, Salcher-konrad M, Pollard AJ, Larson HJ, Teerawattananon Y, et al. . Health Policy Challenges in ensuring global access to COVID-19 vaccines: production, affordability, allocation, and deployment. Lancet. (2021) 397:1023–34. doi: 10.1016/S0140-6736(21)00306-8 - DOI - PMC - PubMed