. 2024 Oct;11(39):e2406936.
doi: 10.1002/advs.202406936. Epub 2024 Aug 13.

Targeting Neuraminidase 4 Attenuates Kidney Fibrosis in Mice

Affiliations

Targeting Neuraminidase 4 Attenuates Kidney Fibrosis in Mice

Ping-Ting Xiao et al. Adv Sci (Weinh). 2024 Oct.

Abstract

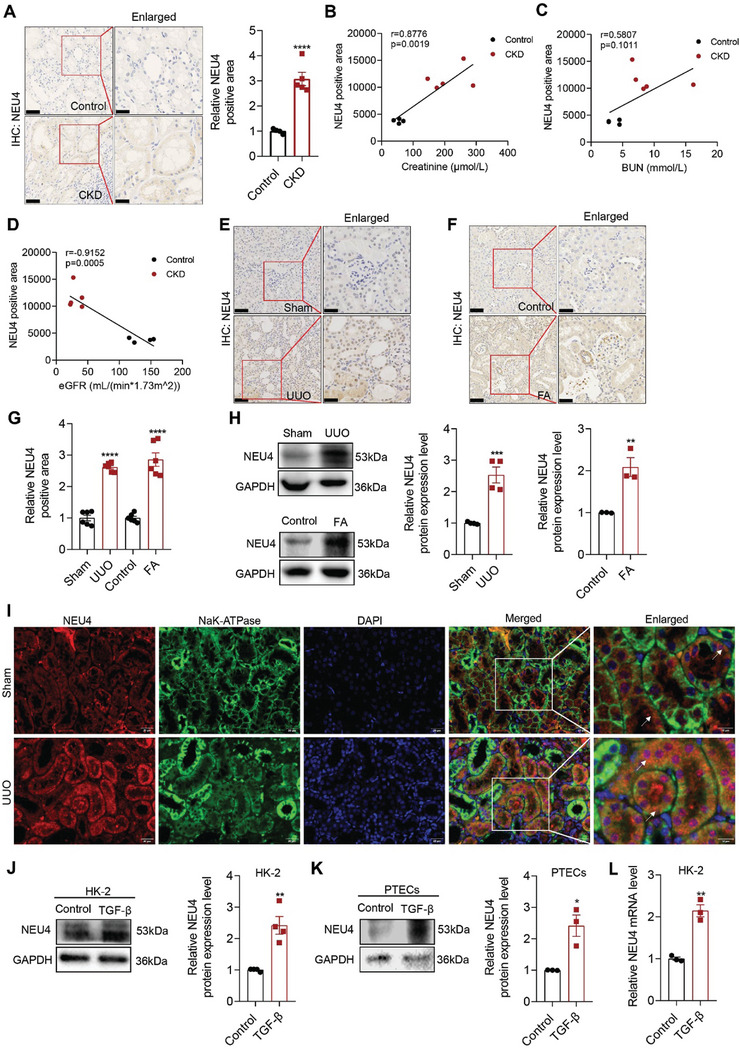
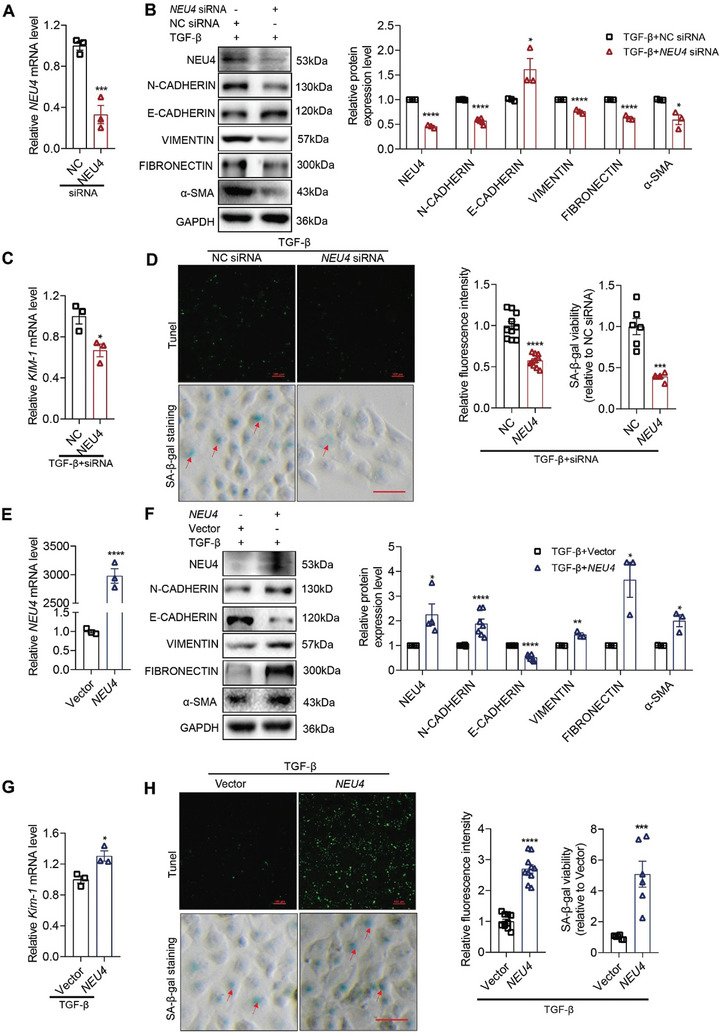
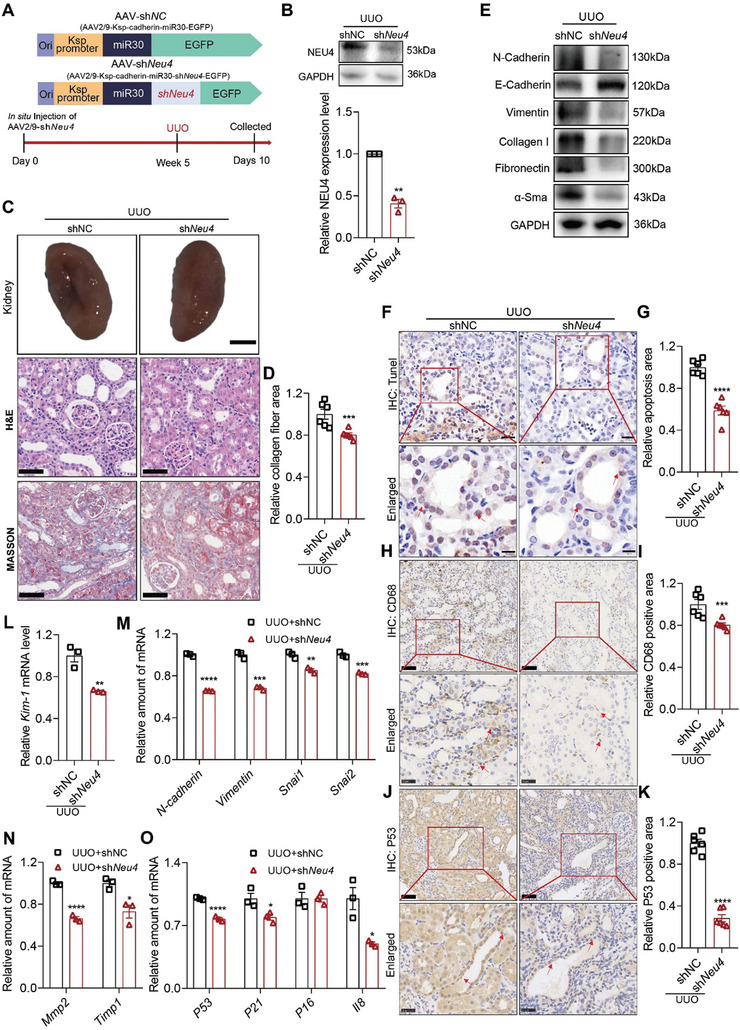
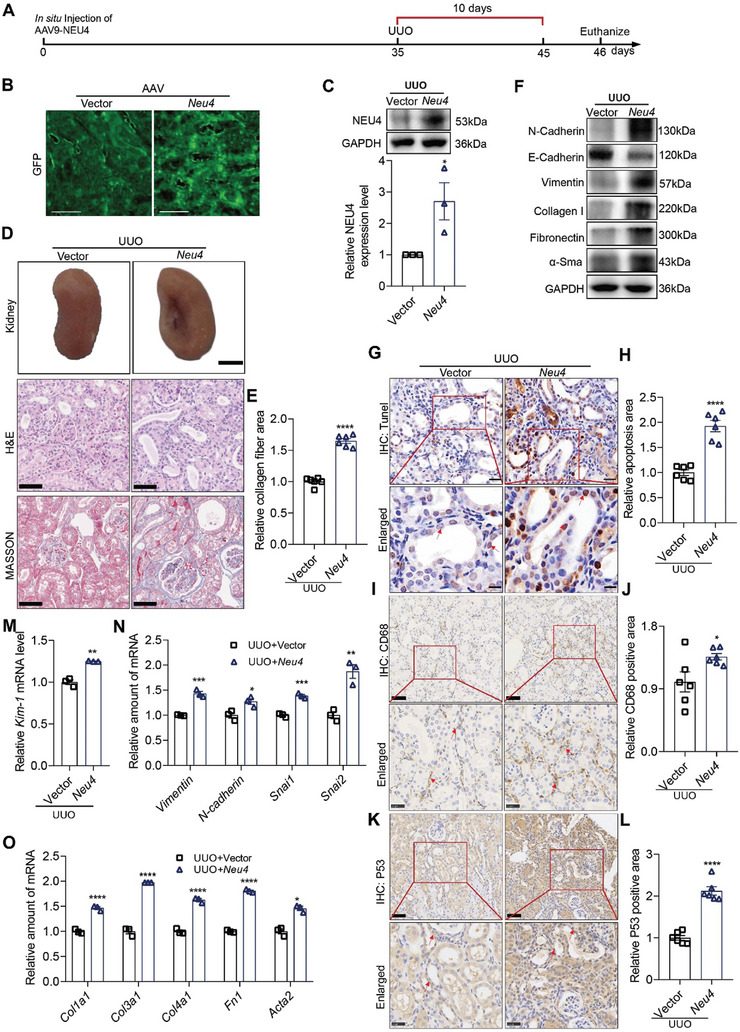
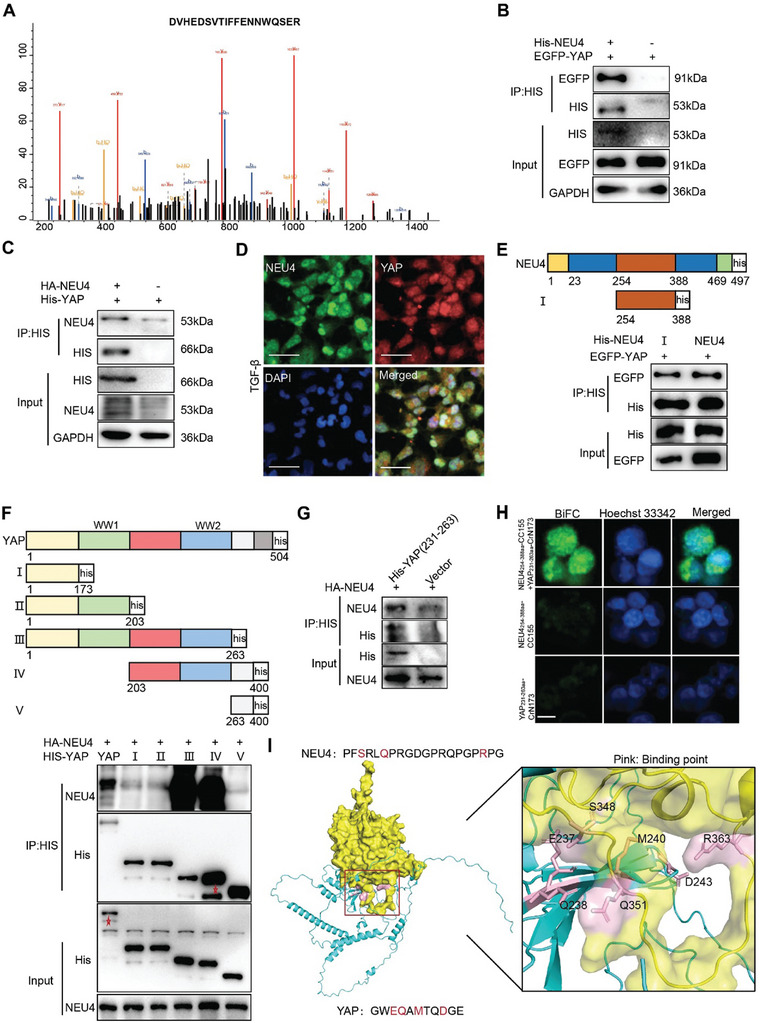
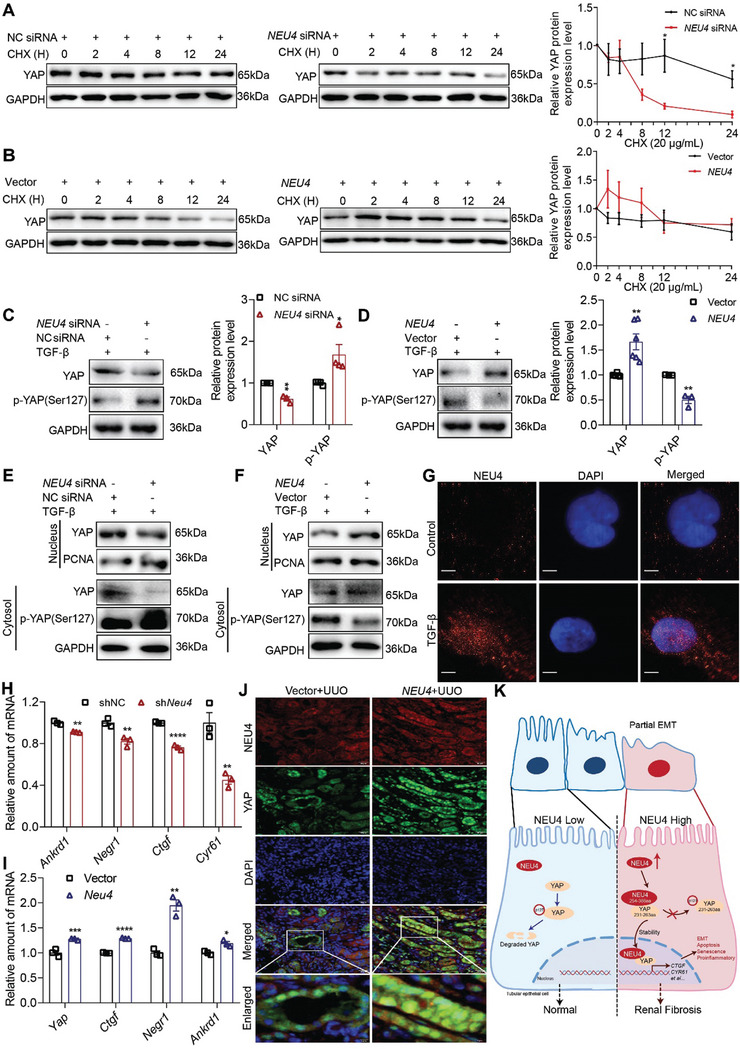
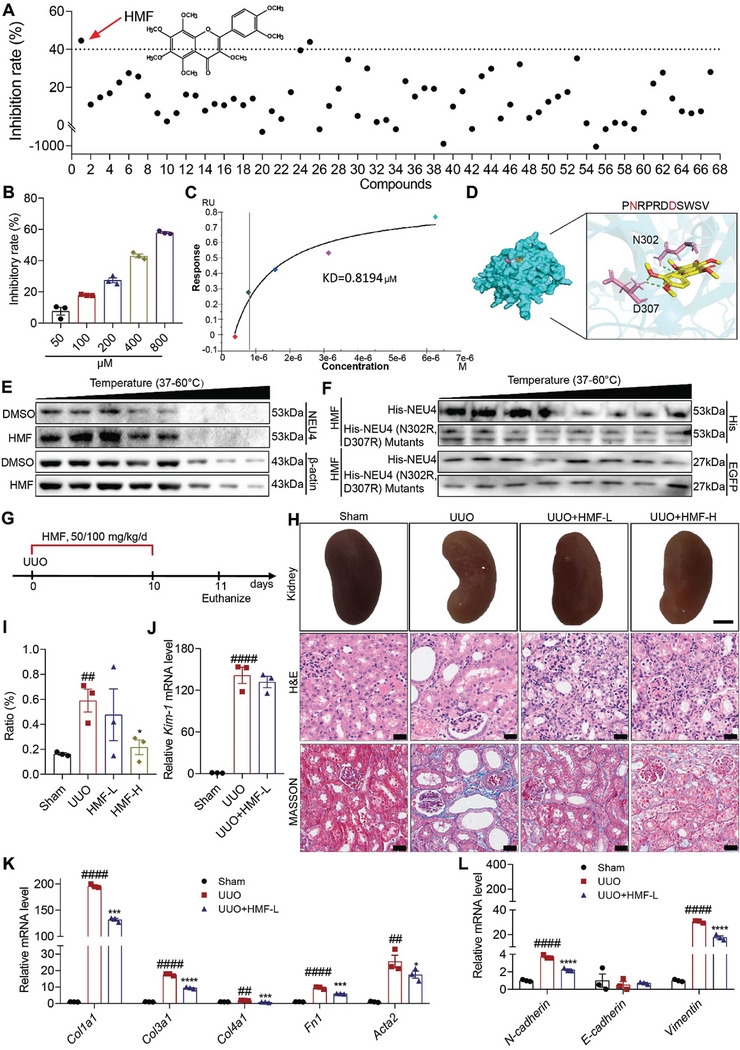
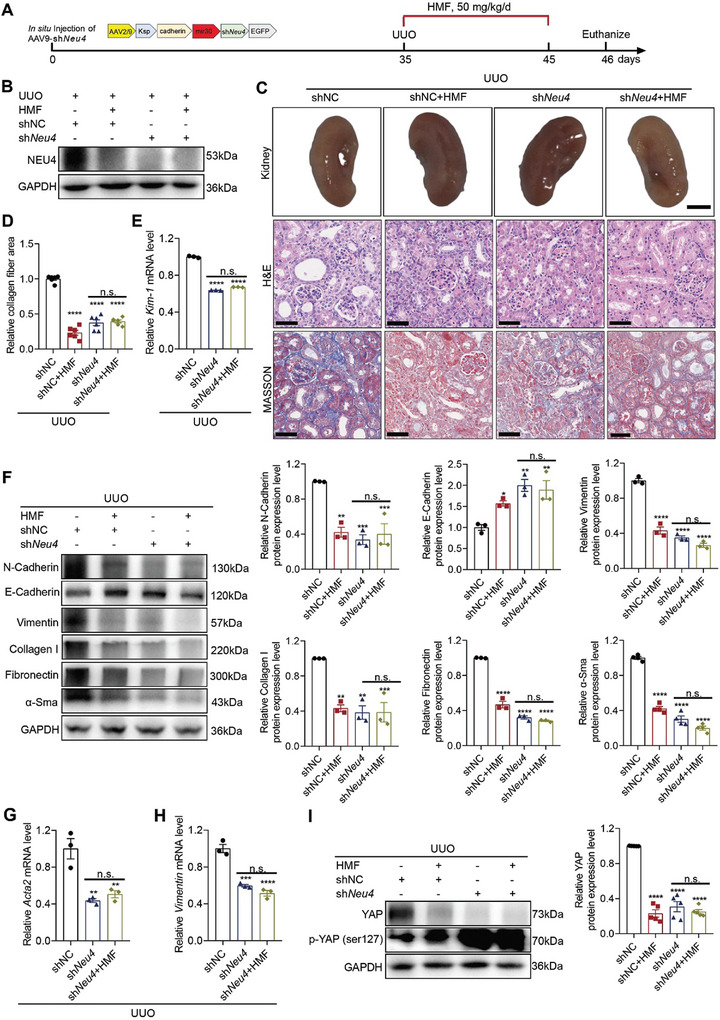
Despite significant progress in therapy, there remains a lack of substantial evidence regarding the molecular factors that lead to renal fibrosis. Neuraminidase 4 (NEU4), an enzyme that removes sialic acids from glycoconjugates, has an unclear role in chronic progressive fibrosis. Here, this study finds that NEU4 expression is markedly upregulated in mouse fibrotic kidneys induced by folic acid or unilateral ureter obstruction, and this elevation is observed in patients with renal fibrosis. NEU4 knockdown specifically in the kidney attenuates the epithelial-to-mesenchymal transition, reduces the production of pro-fibrotic cytokines, and decreases cellular senescence in male mice. Conversely, NEU4 overexpression exacerbates the progression of renal fibrosis. Mechanistically, NEU4254-388aa interacts with Yes-associated protein (YAP) at WW2 domain (231-263aa), promoting its nucleus translocation and activation of target genes, thereby contributing to renal fibrosis. 3,5,6,7,8,3',4'-Heptamethoxyflavone, a natural compound, is identified as a novel NEU4 inhibitor, effectively protecting mice from renal fibrosis in a NEU4-dependent manner. Collectively, the findings suggest that NEU4 may represent a promising therapeutic target for kidney fibrosis.

Keywords: 3,5,6,7,8,3ʹ,4ʹ‐Heptamethoxyflavone; NEU4; YAP; renal fibrosis.


Conflict of interest statement

The authors declare no conflict of interest.

Figures

Figure 1
Figure 1
NEU4 was significantly increased in human and mouse fibrotic kidneys. A) Representative immunohistochemical micrographs and quantification of NEU4 expression in kidney from patients with CKD. Scale bar, 50 µm. patients, n = 4–5 samples. B–D) Pearson's correlation of NEU4 with serum creatinine level (B), blood urea nitrogen (BUN) (C), and estimated glomerular filtration rate (eGFR) (D) (n = 9, Pearson χ2 test). E,F) Representative immunohistochemical micrographs of NEU4 in kidney from mice subjected to UUO (E) and mice subjected to folic acid (F). Scale bar, 50 µm. n = 6 mice. G) Quantification of NEU4 expression in Figure 1E,F. H) Western blot (left panel) and quantification (right panel) of the protein expression of NEU4 in left kidneys from mice subjected to UUO or folic acid. GAPDH served as loading control, n = 3–4 mice. I) Immunofluorescence images of NEU4 and Na+/K+‐ATPase in kidney from mice subjected to UUO. Na+/K+‐ATPase was used as tubular epithelial cell marker. Scale bar, 50 µm. n = 3 mice. J) Western blot (left panel) and quantification (right panel) of the protein expression of NEU4 in HK‐2 cells treatment with TGF‐β 24 h. GAPDH served as loading control, n = 4 samples. K) Western blot (top panel) and quantification (bottom panel) of the protein expression of NEU4 in PTECs treatment with TGF‐β 24 h. GAPDH served as loading control, n = 3 samples. L) NEU4 mRNA level in HK‐2 cells treatment with TGF‐β 24 h. n = 3 samples. Error bars represent mean ± SEM. Comparisons between two groups were analyzed by using a two‐tailed Studentʹs t test. *p < 0.05, **p < 0.01, ***p < 0.001, ****p < 0.0001 versus the Sham or Control group.
Figure 2
Figure 2
NEU4 promoted epithelial‐mesenchymal transition, programmed cell death, and cellular senescence in TGF‐β‐induced HK‐2. A) NEU4 mRNA level. n = 3 samples. B) Western blot (left panel) and quantification (right panel) of the protein expression of NEU4, α‐SMA, N‐CADHERIN, E‐CADHERIN, VIMENTIN and FIBRONECTIN in HK‐2 cells. GAPDH served as loading control, n = 3–6 samples. C) Kim‐1 mRNA level. n = 3 samples. D) Measurement (left panel) and the quantification (right panel) of apoptosis by TUNEL staining and SA‐β‐gal activity by SA‐β‐gal staining in HK‐2 cells. n = 6–10 samples. Scale bar, 100 µm. E) NEU4 mRNA level. n = 3 samples. F) Western blot (left panel) and quantification (right panel) of the protein expression of NEU4, α‐SMA, N‐CADHERIN, E‐CADHERIN, VIMENTIN and FIBRONECTIN in HK‐2 cells. GAPDH served as loading control, n = 3–7 samples. G) Kim‐1 mRNA level. n = 3 samples. H) Measurement (left panel) and the quantification (right panel) of apoptosis by TUNEL staining and SA‐β‐gal activity by SA‐β‐gal staining in HK‐2 cells. n = 6–10 samples. Scale bar, 100 µm. (A–D) HK‐2 cells treatment with TGF‐β 24 h after transfection with NEU4 siRNA. (E–H) HK‐2 cells treatment with TGF‐β 24 h after transfection with NEU4‐overexpression plasmids. Error bars represent mean ± SEM. Comparisons between two groups were analyzed by using a two‐tailed Studentʹs t test. *p < 0.05, **p < 0.01, ***p < 0.001, ****p < 0.0001 versus the NC siRNA or Vector group.
Figure 3
Figure 3
Neu4 knockdown alleviated UUO‐induced renal fibrosis in mice. A) Scheme of the experimental approach. Mice were in situ injected with adeno‐associated virus (AAV2/9) carrying a coding sequence of mouse shNeu4 under kidney‐specific cadherin promoter (AAV2/9‐cadherin‐miR30‐shNeu4‐EGFP, referred as shNeu4) or shNC (AAV2/9‐cadherin‐miR30‐EGFP). Five weeks after injection, the mice were subjected to UUO surgery for 10 days. UUO, unilateral ureteral obstruction. B) Western blot (top panel) and quantification (bottom panel) of the protein expression of NEU4 in left kidney. GAPDH served as loading control, n = 3 mice. C,D) The gross appearance of kidneys (n = 3 mice. Scale bar, 2 mm), H&E staining and Masson's trichrome staining from left kidneys, and renal interstitial fibrosis scores based on Masson's trichrome staining (D). n = 6 mice. Scale bar, 50 µm. E) Western blot of the expression of N‐Cadherin, E‐Cadherin, Vimentin, Collagen I, Fibronectin and α‐Sma. GAPDH served as loading control. n = 3–5 mice. F,G) Measurement (F) and quantification (G) of apoptosis by TUNEL staining in left kidney. n = 6 mice. Scale bar, 20 µm. H–K) Immunohistochemistry staining analysis and quantification of CD68 (H and I) and P53 (J and K) in kidney tissues. n = 6 mice. Scale bar, 50 µm. L) Kim‐1 mRNA level. n = 3 mice. M–O) Relative mRNA level of EMT‐associated genes (M), extracellular matrix‐associated genes (N) and senescence‐associated genes (O) were determined by RT‐qPCR, n = 3 mice. Error bars represent mean ± SEM. Comparisons between two groups were analyzed by using a two‐tailed Studentʹs t test. *p < 0.05, **p < 0.01, ***p < 0.001, ****p < 0.0001 versus the shNC.
Figure 4
Figure 4
Neu4 overexpression aggravated UUO‐induced renal fibrosis. A) Schematic diagram of Neu4 overexpression in mice. The cortex of the kidney in mice was in situ injected with AAV9 encoding GFP‐Neu4 or scramble. After the injection for 5 weeks, the mice were subjected to UUO surgery for 10 days. B) Immunofluorescence images of GFP in kidney from Vector or Neu4 overexpression mice. Scale bar, 500 µm. C) Western blot (top panel) and quantification (bottom panel) of the protein expression of NEU4. GAPDH served as loading control, n = 3 mice. D,E) The gross appearance of kidneys. n = 3 mice. Scale bar, 2 mm. H&E staining and Masson's trichrome staining from left kidneys of UUO mice, and quantification of fibrosis area (D). n = 6 mice. H&E staining, scale bar, 50 µm. Masson's trichrome staining, scale bar, 100 µm. F) Western blot of the protein expression of α‐Sma, N‐Cadherin, E‐Cadherin, Vimentin, Fibronectin and Collagen I in kidneys. GAPDH served as loading control, n = 3–5 mice. G,H) Measurement and quantification of apoptosis by TUNEL staining in left kidney. n = 6 mice. Scale bar, 20 µm. I–L) Immunohistochemistry staining analysis and quantification of CD68 (I and J) and P53 (K and L) in kidney tissues. n = 6 mice. Scale bar, 50 µm. M) Kim‐1 mRNA level. n = 3 mice. N,O) Relative EMT associated gene (N), and ECM associated gene (O) mRNA level in left kidney. n = 3 mice. Error bars represent mean ± SEM. Comparisons between two groups were analyzed by using a two‐tailed Studentʹs t test. *p < 0.05, **p < 0.01, ***p < 0.001, ****p < 0.0001 versus the Vector group.
Figure 5
Figure 5
NEU4 interacted with Yes‐associated protein (YAP). A) YAP peptide fragment was precipitated with NEU4 by mass spectrometry (MS). B,C) Western blotting of CoIP of NEU4 and YAP in HK‐2 cells treated with TGF‐β. Two independent experiments were performed. D) Colocalization of NEU4 and YAP was analyzed by immunofluorescence in HK‐2 cells stimulated with TGF‐β. Scale bar, 100 µm. E) HEK293T cells were co‐transfected with indicated EGFP‐YAP and His‐NEU4 deletion mutants’ plasmid. Cell lysates were IP with His antibody. F) HEK293T cells were co‐transfected with indicated HA‐NEU4 and His‐YAP deletion mutants plasmid. Cell lysates were IP with His antibody. G) Coimmunoprecipitation of NEU4 and His‐YAP 231–263aa in HEK293T cells. H) BiFC signals were detected in 293T cells. Representative fluorescence images of 293T cells co‐expression of pBiFC‐NEU4254‐388aa‐CC155 and pBiFC‐YAP231‐263aa‐CrN173. For the control group, cells were transfected with pBiFC‐NEU4254‐388aa‐CC155 or pBiFC‐YAP231‐263aa‐CrN173 plasmids. Scale bar, 10 µm. I) Molecular docking of 3D structures shows the interaction of NEU4 domain (yellow) with YAP domain (blue).
Figure 6
Figure 6
NEU4 inhibited activation of YAP. A,B) Western blot (left panel) and quantification (right panel) of the protein expression of YAP in HK‐2 cells treatment with TGF‐β for 24 h, and then with cycloheximide (CHX, 20 µg mL−1) for the indicated periods of time (0, 2, 4, 8, 12, 24 h) after transfection either with NEU4 siRNA (A) or NEU4 overexpression plasmid (B). GAPDH served as loading control. n = 3 biologically independent samples. C,D) Western blot (left panel) and quantification (right panel) of the protein expression of YAP and phosphorylation of YAP in HK‐2 cells treatment with TGF‐β 24 h after transfection either NEU4 siRNA (C) or NEU4 overexpression plasmid (D). GAPDH served as loading control. n = 3–6 samples. E,F) Western blot of YAP and phosphorylation of YAP in nuclear and cytosol of HK‐2 cells following 24 h after treatment with TGF‐β subsequent to transfection with either NEU4 siRNA (E) or NEU4 overexpression plasmid (F). G) Localization of NEU4 was analyzed by immunofluorescence in HK‐2 cells stimulated with TGF‐β for 24 h. Scale bar, 5 µm. H,I) mRNA abundance of Yap target genes in left kidney tissue of UUO‐mice treated with shNeu4 (H) or Neu4 overexpression plasmid (I). n = 3 mice. J) Colocalization of NEU4 and YAP was analyzed by immunofluorescence in left kidneys. Scale bar, 50 µm. K) The proposed mechanisms of NEU4‐mediated renal fibrosis. Error bars represent mean ± SEM. Comparisons between two groups were analyzed by using a two‐tailed Studentʹs t test. *p < 0.05, **p < 0.01, ***p < 0.001, ****p < 0.0001 versus the NC siRNA, shNC or Vector group.
Figure 7
Figure 7
3,5,6,7,8,3ʹ,4ʹ‐Heptamethoxyflavone (HMF) was screened as a novel inhibitor of NEU4. A) Inhibitory rate of 67 compounds on NEU4 enzyme activity. The dashed line represents a 40% inhibitory rate. B) The inhibitory rate of HMF on NEU4 enzyme activity at different concentrations. C) SPR assay showed the interaction of HMF with NEU4. D) Molecular docking analysis of the interaction between HMF and NEU4. E) CETSA assays confirmed the binding of HMF to NEU4 in HK‐2 cells. β‐actin was used as the internal control. F) CETSA assays confirmed the binding of HMF to NEU4 or NEU4 (N302R, D307R) Mutants in HK‐2 cells treatment with TGF‐β. HK‐2 cells treated with HMF 24 h after transfection with EGFP and NEU4 or NEU4 mutants. EGFP was used as the internal control. G) The schematic of experimental design. Vehicle, or HMF (50 or 100 mg kg−1/day) was administrated to UUO mice by gastric irrigation once daily for 10 days. H,I) The gross appearance of kidneys (n = 3 mice. Scale bar, 2 mm), H&E staining and Masson's trichrome staining from left kidneys of UUO mice, and renal interstitial fibrosis scores based on Masson's trichrome staining (I), n = 3 mice. Scale bar, 50 µm. J) Kim‐1 mRNA level. n = 3 mice. K,L) Relative mRNA levels of ECM associated genes (K) and EMT‐associated genes (L) were determined by RT‐qPCR. n = 3 mice. Error bars represent mean ± SEM. Comparisons those among three or more groups by using one‐way analysis of variance (ANOVA) followed by Dunnettʹs post hoc tests. *p < 0.05, ***p < 0.001, ****p < 0.0001 versus the UUO group, ## p < 0.01, #### p < 0.0001 versus the Sham group.
Figure 8
Figure 8
Neu4 knockdown relieved the anti‐fibrotic effects of HMF in UUO model. A) Schematic diagram of experimental approach. Mice were in situ injected with AAV2/9 encoding shNC or shNeu4. Five weeks after injection, the mice were subjected to UUO surgery, then vehicle or HMF (50 mg kg−1/day) was administrated to mice by gastric irrigation once daily for 10 days. B) Western blot of NEU4 in kidney. GAPDH served as loading control. C,D) Picture of left kidneys of mice with different treatments, H&E staining and Masson's trichrome staining from left kidneys of UUO mice and renal interstitial fibrosis scores based on Masson's trichrome staining (D). n = 6 mice. Scale bar, 50 µm. E) Kim‐1 mRNA level. n = 3 mice. F) Western blot (left panel) and quantification (right panel) of the protein expression of N‐Cadherin, E‐Cadherin, Vimentin, Collagen I, Fibronectin and α‐Sma. GAPDH served as loading control. n = 3–4 mice. G,H) Acta2 (G) and Vimentin (H) mRNA level. n = 3 mice. I) Western blot (left panel) and quantification (right panel) of the protein expression of YAP and phosphorylation of YAP in kidneys. GAPDH served as loading control. n = 5 mice. Error bars represent mean ± SEM. Comparisons those among three or more groups by using one‐way analysis of variance (ANOVA) followed by Dunnettʹs post hoc tests. *p < 0.05, **p < 0.01, ***p < 0.001, ****p < 0.0001 versus the shNC group. n.s.: no significance.

References

    1. Wynn T. A., Ramalingam T. R., Nat. Med. 2012, 18, 1028. - PMC - PubMed
    1. Bozic M., Caus M., Rodrigues‐Diez R. R., Pedraza N., Ruiz‐Ortega M., Gari E., Gallel P., Panades M. J., Martinez A., Fernandez E., Valdivielso J. M., Nat. Commun. 2020, 11, 1943. - PMC - PubMed
    1. Huang R., Fu P., Ma L., Signal Transduct Target Ther. 2023, 8, 129. - PMC - PubMed
    1. Chen Q. Q., Liu K., Shi N., Ma G. X., Wang P. P., Xie H. M., Jin S. J., Wei T. T., Yu X. Y., Wang Y., Zhang J. Y., Li P., Qi L. W., Zhang L., Nat. Commun. 2023, 14, 1713. - PMC - PubMed
    1. Zhou W., Wu W. H., Si Z. L., Liu H. L., Wang H. Y., Jiang H., Liu Y. F., Alolga R. N., Chen C., Liu S. J., Bian X. Y., Shan J. J., Li J., Tan N. H., Zhang Z. H., Nat. Commun. 2022, 13, 6081. - PMC - PubMed

LinkOut - more resources