. 2024 Oct;11(38):e2400918.
doi: 10.1002/advs.202400918. Epub 2024 Aug 13.

Profiling Dynamic Patterns of Single-Cell Motility

Affiliations

Profiling Dynamic Patterns of Single-Cell Motility

Debonil Maity et al. Adv Sci (Weinh). 2024 Oct.

Abstract

Cell motility plays an essential role in many biological processes as cells move and interact within their local microenvironments. Current methods for quantifying cell motility typically involve tracking individual cells over time, but the results are often presented as averaged values across cell populations. While informative, these ensemble approaches have limitations in assessing cellular heterogeneity and identifying generalizable patterns of single-cell behaviors, at baseline and in response to perturbations. In this study, CaMI is introduced, a computational framework designed to leverage the single-cell nature of motility data. CaMI identifies and classifies distinct spatio-temporal behaviors of individual cells, enabling robust classification of single-cell motility patterns in a large dataset (n = 74 253 cells). This framework allows quantification of spatial and temporal heterogeneities, determination of single-cell motility behaviors across various biological conditions and provides a visualization scheme for direct interpretation of dynamic cell behaviors. Importantly, CaMI reveals insights that conventional cell motility analyses may overlook, showcasing its utility in uncovering robust biological insights. Together, a multivariate framework is presented to classify emergent patterns of single-cell motility, emphasizing the critical role of cellular heterogeneity in shaping cell behaviors across populations.

Keywords: cell motility; high‐throughput cell phenotyping; single‐cell behaviors.


Conflict of interest statement

D.M. and J.M.P. are co‐inventors on a patent application related to this work. All other authors declare no other conflicts of interest.

Figures
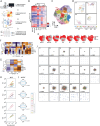
Figure 1
Figure 1
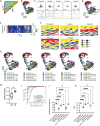
Identifying and classifying cell motility patterns across short durations. A) Illustration of CaMI workflow. B) Heatmap showing the magnitude of eight motility parameters per cell (n = 74,253 cells). Each row represents a single cell, and each column represents a motility parameter. C,D) 2D tSNE plot showing the 17 motility clusters (C) where each dot is a single cell and (D) contour plots that highlight the spatial distribution of cells/clusters that are further separated into four short‐duration behavior classes within the reduced dimensionality space. E) 2D t‐SNE plot showing the magnitude of the eight motility parameters per cluster region. F,G) Heatmap showing the average magnitude of the eight cell motility parameters among each of the 17 cell motility clusters and the four short duration behavioral classes (G). H) Mean squared displacements per long duration (F) motility clusters separated based on the four short‐duration behavior classes (SG1‐SG4). I) Probability density function profiles of the angular velocity magnitudes for the four short duration behavior classes. High circularity values (less ellipsoidal profiles) indicate that cells have a similar likelihood of moving in multiple directions. J) Visualization of single‐cell trajectories per cluster, the top panel shows the origin‐centered trajectories for all cells within a given cluster, bottom panel shows 16 randomly selected cells per cluster. Scalebar denotes 100 µm.
Figure 2
Figure 2
Application of CaMI workflow to short‐duration datasets. A) Heatmaps indicating the fractional abundance of distinct cell types in our dataset across the seventeen short‐duration motility clusters (left), four short‐duration behavior classes (center), and the average magnitude of the eight motility parameters within each cell group (right). B) Heatmap of scaled higher order motility parameters for low‐density (LD) and high‐density (HD) MDA231 cells at baseline in response to 50nM Reparixin exposure. C) Barplots showing the fractional abundance of MDA231 cells within each of the seventeen short‐duration motility clusters by condition. D) Linear regression plots indicating the correlation between LD and HD fractional abundance across the seventeen short‐duration clusters at baseline and in response to Reparixin exposure. R and p indicate results from a Spearmen correlation test. E) 2D tSNE map with the four behavior classes shown as shadings and the contours of each MDA231 cell condition. F) Heatmap showing the magnitudes of the eight motility parameters for the LY12 T‐cell lymphoma cells treated with Actin modulators (Jasplakinolide (Jasp.) and Cucurbitacin E (CucE)). G) Bar plots showing the fractional abundance of cells per short‐duration motility clusters treated with Actin modulators. H) Contour maps showing the distributions and localizations of cells at baseline (DMSO) and treated with varying concentrations of Jaspand CucE.
Figure 3
Figure 3
Quantification of cell motility patterns in primary monocytes. A) Bar plots showing the abundance of cells among the 17 cell motility clusters for three donors at baseline and after exposure to conditioned media. B) Scatter plot showing the decrease in cellular heterogeneity after CM‐exposure. C) Correlation map of cell motility clusters among donor samples. D) Bar plots showing the magnitude of the total diffusivities at baseline and after CM‐exposure. E) Bar plots showing the distributions of cell motility clusters across testing conditions. F) Bar plot showing the total diffusivities across testing conditions. G) Correlation map indicating similarities in the cell motility clusters among testing conditions.
Figure 4
Figure 4
Identifying and classifying cell motility patterns across long durations. A) Heatmap showing eight motility parameters per cell (n = 24,753 cells). Each row represents a single cell, and each column represents a motility parameter. B,C) 2D t‐SNE scatter plot where each dot is a cell and colors indicate the 25 identified long‐duration cell motility clusters (B) and contour plots further separated into four long‐duration behavior classes (CG1‐4) that show the distributions and localization of cells per motility cluster (C). D) 2D t‐SNE plot showing the magnitude of the eight motility parameters per cluster region. E) Heat map showing the magnitude of the eight cell motility parameters for the twenty‐five long‐duration cell motility clusters (left) and within each of the four long‐duration behavior classes (right). F) Visualization of cell trajectories for cells classified within each cluster, the top panel shows the origin‐centered trajectories for all cells within a cluster, and the bottom panel shows 16 randomly selected cells per cluster. Scalebar denotes 100µm. G) Sankey plot showing the transitions based on the fractional abundance of cells within each short‐duration behavior class for three‐time segments (2.5 h each) and how they ultimately connect to the four long‐duration behavior classes. H) Box‐and‐whisker plots of the stability fraction of cells within each short‐duration behavior class.
Figure 5
Figure 5
Quantifying functional heterogeneity and biological insights using CaMI. A) Cross‐correlation heatmap highlighting the grouping of the 409 biological conditions based on similarities in overall cell behaviors. B) 2D t‐SNE plot showing the 409 conditions painted based on the identified groupings. Each dot denotes a single biological condition (n = 409). C) Single‐cell trajectories of LY12 cells as a function of increasing collagen concentrations. The top panel shows origin‐centered trajectories for all cells analyzed, and the bottom panel shows 25 randomly selected cells per condition. D) 2D t‐SNE plot shows a bi‐phasic/switching effect with increasing collagen concentration. LY12 cells moving in 4 mg mL−1 gels are more similar to LY12 cells moving in 1mg mL−1 gels relative to cells moving in 3mg mL−1 collagen‐I gels. E) Heatmap showing the abundance of cells within each cluster per collagen concentration. The line plot on the right shows a bi‐phasic change in the Shannon entropy, denoting the lowest cellular heterogeneity for cells moving in 3mg mL−1 collagen‐I gels. F) Sankey plots show the temporal transitions of cells across short‐duration classes as a function of increasing concentration. Sankey plots also indicate a switch in temporal kinetics and temporal heterogeneity. G) 2D t‐SNE plot showing the location of matched 2D and 3D conditions of ht1080 cells. H) Box plot showing the Shannon entropy of cell moving in 2D microenvironments are significantly lower than for cells moving in 3D microenvironments. I) ROC curve showing prediction accuracy, denoted by the true and false positive rates, for higher order motility parameters and different spatio‐temporal entropies. J,K) Box‐and‐whisker plots show the prediction accuracy (J) and area under the curve (K) for higher‐order motility parameters and various spatio‐temporal entropies. Data indicates that combining entropies yields the same prediction accuracy as using the higher‐order parameters.

References

    1. Swann J. B., Smyth M. J., J. Clin. Invest. 2007, 117, 1137. - PMC - PubMed
    1. Choe K., Hontani Y., Wang T., Hebert E., Ouzounov D. G., Lai K., Singh A., Béguelin W., Melnick A. M., Xu C., Nat. Immunol. 2022, 23, 330. - PMC - PubMed
    1. Crainiciuc G., Palomino‐Segura M., Molina‐Moreno M., Sicilia J., Aragones D. G., Li J. L. Y., Madurga R., Adrover J. M., Aroca‐Crevillén A., Martin‐Salamanca S., del Valle A. S., Castillo S. D., Welch H. C. E., Soehnlein O., Graupera M. Sánchez‐Cabo F., Zarbock A., Smithgall T. E. Di Pilato M., Mempel T. R., Tharaux P. L., González S. F., Ayuso‐Sacido A., Ng L. G., Calvo G. F., González‐Díaz I., Díaz‐de‐María F., Hidalgo A., Nature 2022, 601, 415. - PMC - PubMed
    1. Wirtz D., Konstantopoulos K., Searson P. C., Nat. Rev. Cancer 2011, 11, 512. - PMC - PubMed
    1. Efremova M., Teichmann S. A., Nat. Methods 2020, 17, 14. - PubMed

LinkOut - more resources