. 2024 Oct;11(38):e2309755.
doi: 10.1002/advs.202309755. Epub 2024 Aug 13.

Dissecting the Distinct Tumor Microenvironments of HRD and HRP Ovarian Cancer: Implications for Targeted Therapies to Overcome PARPi Resistance in HRD Tumors and Refractoriness in HRP Tumors

Affiliations

Dissecting the Distinct Tumor Microenvironments of HRD and HRP Ovarian Cancer: Implications for Targeted Therapies to Overcome PARPi Resistance in HRD Tumors and Refractoriness in HRP Tumors

Junjun Qiu et al. Adv Sci (Weinh). 2024 Oct.

Abstract

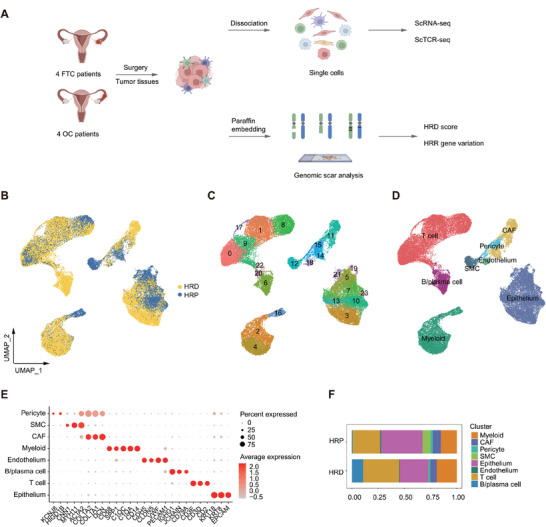
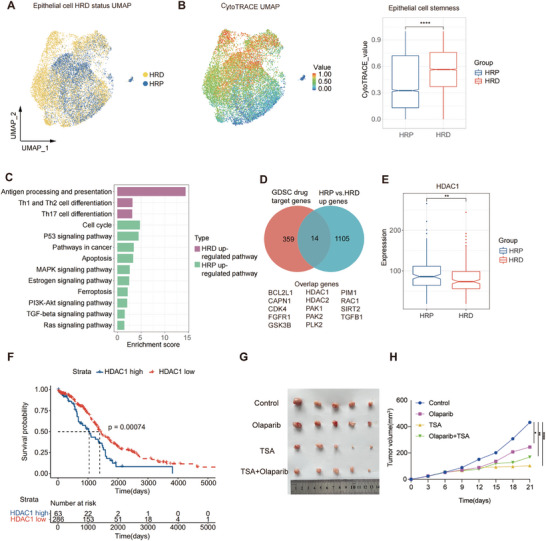
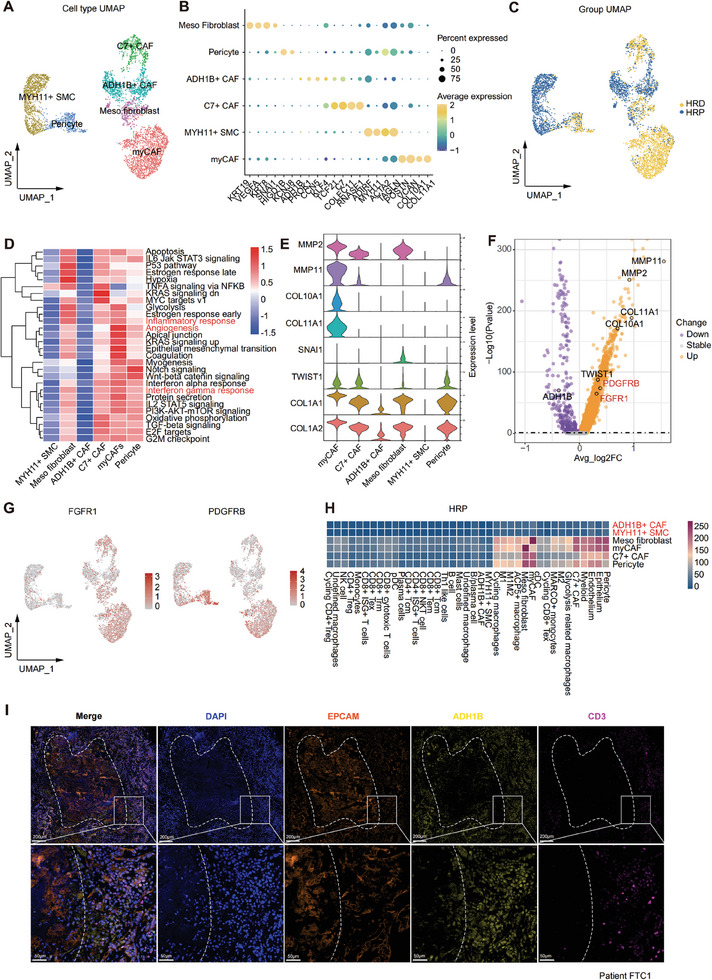
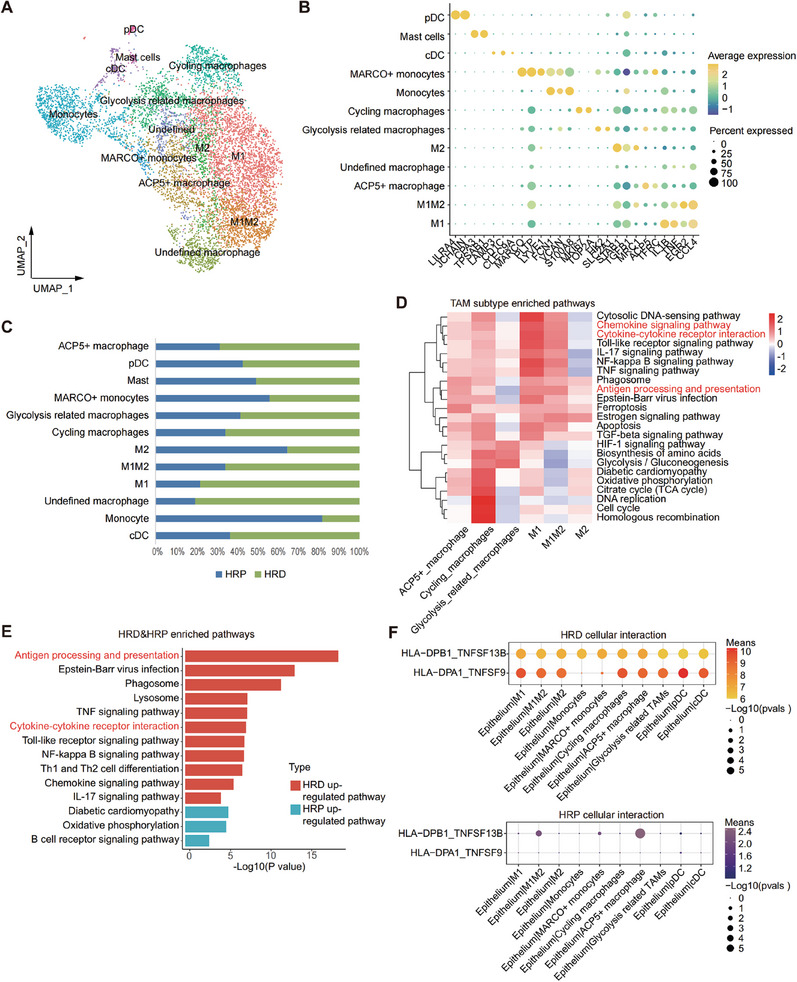
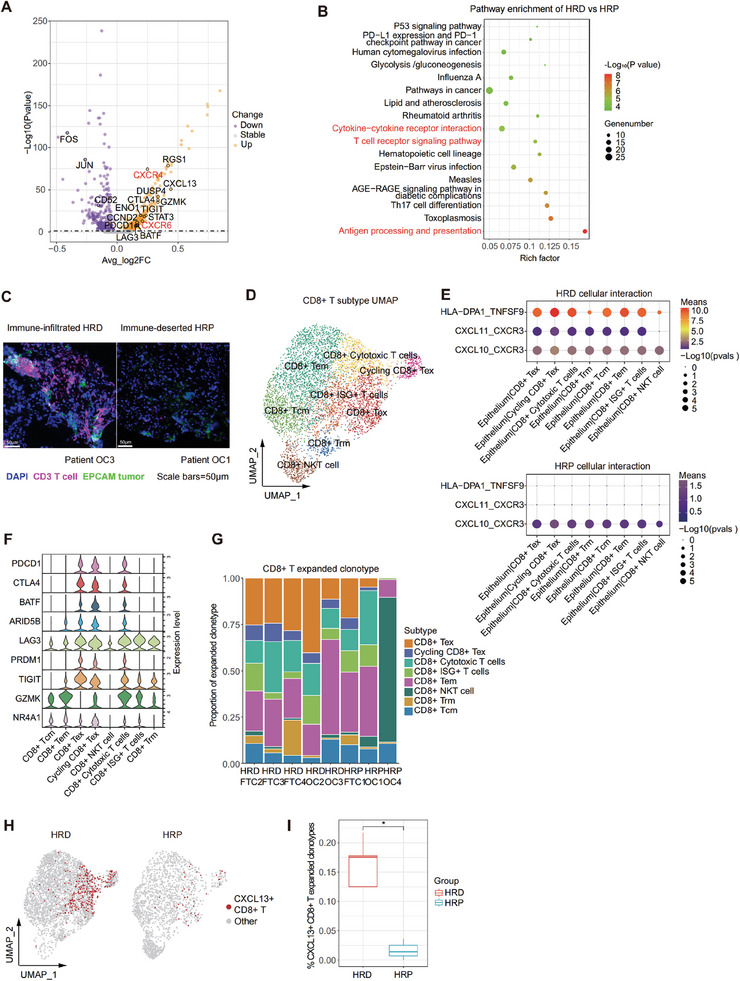
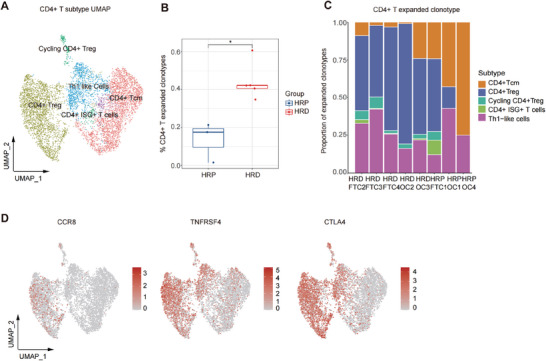
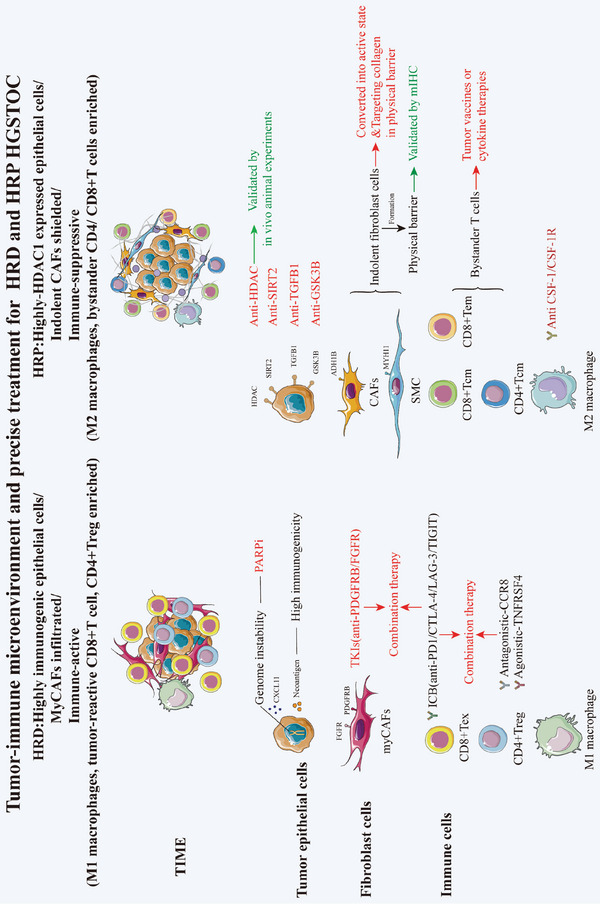
High-grade serous tubo-ovarian cancer (HGSTOC) is an aggressive gynecological malignancy including homologous recombination deficient (HRD) and homologous recombination proficient (HRP) groups. Despite the therapeutic potential of poly (ADP-ribose) polymerase inhibitors (PARPis) and anti-PDCD1 antibodies, acquired resistance in HRD and suboptimal response in HRP patients necessitate more precise treatment. Herein, single-cell RNA and single-cell T-cell receptor sequencing on 5 HRD and 3 HRP tumors are performed to decipher the heterogeneous tumor immune microenvironment (TIME), along with multiplex immunohistochemistry staining and animal experiments for validation. HRD tumors are enriched with immunogenic epithelial cells, FGFR1+PDGFRβ+ myCAFs, M1 macrophages, tumor reactive CD8+/CD4+ Tregs, whereas HRP tumors are enriched with HDAC1-expressing epithelial cells, indolent CAFs, M2 macrophages, and bystander CD4+/CD8+ T cells. Significantly, customized therapies are proposed. For HRD patients, targeting FGFR1+PDGFRβ+ myCAFs via tyrosine kinase inhibitors, targeting Tregs via anti-CCR8 antibodies/TNFRSF4 stimulation, and targeting CXCL13+ exhausted T cells by blocking PDCD1/CTLA-4/LAG-3/TIGIT are proposed. For HRP patients, targeting indolent CAFs, targeting M2 macrophages via CSF-1/CSF-1R inhibitors, targeting bystander T cells via tumor vaccines, and targeting epithelial cells via HDAC inhibitors. The study provides comprehensive insights into HRD and HRP TIME and tailored therapeutic approaches, addressing the challenges of PARPi-resistant HRD and refractory HRP tumors.

Keywords: HRD; HRP; high grade tubo‐ovarian cancer; precise treatment strategies; single‐cell RNA sequencing; single‐cell T cell receptor sequencing; tumor immune microenvironment.


Conflict of interest statement

The authors declare no conflict of interest.

Figures

Figure 1
Figure 1
Single‐Cell transcriptome atlas of HRD and HRP HGSTOC. A) A schematic diagram illustrating the process of collecting and analyzing single‐cell profiles and genomic scars from eight HGSTOC biopsies. B) A UMAP plot demonstrating 45159 cells from 8 HGSTOC patient origins, colored by HRD status of each patient. C) A UMAP plot demonstrating 45159 cells grouped into 24 clusters. D) A UMAP plot demonstrating 45159 cells grouped into 8 cell types. E) A dot plot demonstrating the expression of specific marker genes of each cell type. Dot size represented the percentage of marker gene expressed cells. Dot color represented the average expression level of marker genes. Red, higher expression; grey, lower expression. F) A column plot demonstrating the average proportion of different cell types in HRD and HRP HGSTOC samples.
Figure 2
Figure 2
Epithelial cells: epithelial cells with great stemness in HRD group versus epithelial cells highly expressing HDAC1 in HRP group. A) A UMAP plot demonstrating epithelial cells from eight HGSTOC patient origins, colored by HRD status. Yellow, HRD; blue, HRP. B) CytoTRACE value UMAP and boxplot demonstrating distinct stemness of epithelial cells from HRD and HRP groups. The color gradient indicates the cytotrace stemness value (red, higher stemness; blue, lower stemness). P value was calculated by a Wilcoxon signed rank test. ****P < 0.0001. C) A bar plot demonstrating the enriched pathways of upregulated gene expression in HRD and HRP epithelial cells, respectively. Purple, HRD; Green, HRP. D) A venn plot demonstrating the intersection of upregulated genes in HRP epithelial cells versus HRD epithelial cells and drug target genes from GDSC database. E) A box plot demonstrating the higher expression of HDAC1 in HRP tumors compared to HRD tumors in TCGA bulk RNA seq datasets. P value was calculated by a Wilcoxon signed rank test. **P < 0.01. F) Kaplan–Meier overall survival curves illustrating the prognostic value of HDAC1 gene expression, validated in TCGA HGSTOC cohorts. P value was calculated by a log‐rank test. G) Photographs of tumor sizes attained from SKOV3 xenograft nude mices by indicated treatment (n = 5 for each group). H) A growth curve demonstrating superior tumor control effects of the HDAC inhibitor (TSA) and the combination therapy of PARPis + TSA in comparison to the control group (n = 5 for each group). P value was calculated by two‐way ANOVA analysis with Tukey's pairwise comparisons. *Adjusted P < 0.05, **Adjusted P < 0.01, **Adjusted P < 0.0001).
Figure 3
Figure 3
CAFs: immune‐active CAFs in HRD group versus “indolent CAFs” in HRP group. A) A UMAP plot demonstrating 4924 CAF‐SMC‐pericyte cells reclustered by 6 subtypes. B) A dot plot showing the classic marker genes of stromal cell subtypes. Dot size represented the percentage of marker gene expressed cells. Dot color represented the average expression level of marker genes (Yellow, higher expression; blue, lower expression). C) A UMAP plot representations of CAF‐SMC‐pericyte cells in HRD and HRP groups. D) A heatmap showing the enriched functional pathways of CAF‐SMC‐pericytes. Color bar represented scaled enrichment score of each subtype. Red, higher scaled enrichment score; blue, lower scaled enrichment score. E) A violin plot representing the expression signatures of collagens and MMPs that characterize different CAF‐SMC‐pericyte subtypes. F) A volcano plot demonstrating differentially expressed genes in CAFs of HRD and HRP group. The abscissa represented −log10(p value). P value was calculated by a Wilcoxon signed rank test. The ordinate represented average log2(fold change) of each cell. Purple, down regulated genes; orange, up regulated genes. G) A UMAP plot showing FGFR1 and PDGFRΒ expression levels in CAF‐SMC‐pericyte cells. Bar color represented the gene expression level (Red, higher expression; grey, lower expression). H) A cellphonedb heatmap representing the cellular interactions between CAF subtypes and other cell types (epithelial cells, myeloid cells, T cells) in HRP group. The color gradient indicates the ligand‐receptor interaction number (red, higher number; blue, lower number). I) Multiplex IHC showing the tumor epithelial cells area (EPCAM+, orange) inside the dotted line, surrounded by the indolent CAF (ADH1B+, yellow) barrier, so T cells (CD3+, mauve) are blocked by the CAF barrier and difficult to infiltrate the tumor area. Scale bar = 100 µM (upper), Scale bar = 50 µM (lower).
Figure 4
Figure 4
Macrophages: antigen presentation cells in HRD group versus anti‐inflammatory M2 in HRP group. A) A UMAP plot demonstrating myeloid cells reclustered into 12 subtypes. B) A dot plot showing classic marker genes of myeloid subtypes marker genes. Dot size represented the percentage of marker gene expressed cells. Dot color represented the average expression level of marker genes (Yellow, higher expression; blue, lower expression). C) A column plot showing the infiltration of 12 myeloid cell subtypes in HRD and HRP group. Blue, HRP group; green, HRD group. D) A Qusage heatmap representing enriched functional pathways of TAM subtypes with an enrichment score presented. Color bar represented with a scaled enrichment score of each subtype presented (color key from blue to red). Red, higher scaled enrichment score; blue, lower scaled enrichment score. E) A pathway barplot presenting enriched functional pathways of myeloid cells in HRD and HRP group. P value was calculated by fisher exact test. F) A cellphonedb dot plot showing receptor‐ligand interactions between epithelial cell and TAMs subtypes in HRD (upper) and HRP (lower) group. Dot size represented the p value of ligand‐receptor interaction. Dot color represented the means of ligand‐receptor interaction (Red, higher mean expression; purple, lower mean expression).
Figure 5
Figure 5
CD8+ T cells: clonal expanded tumor‐reactive T cells in HRD group versus bystander T cells in HRP group. A) A volcano plot demonstrating the differentially expressed genes of CD8+ T cell in HRD and HRP groups. The abscissa represented ‐log10(p value). P value was calculated by a Wilcoxon signed rank test. The ordinate represented average log2(fold change) of each cell. Purple, down regulated genes; orange, up regulated genes. B) A dot plot showing significant enriched pathways of CD8+ T cells in HRD and HRP tumors. P value was calculated by fisher exact test. C) Multiplexed IHC staining showing epithelial cells (EPCAM+, green) and T cells (CD3+, mauve) in representative samples of HRD and HRP group. Scale bar = 50 µM. D) A UMAP plot demonstrating CD8+ T cells reclustered into 8 subtypes. E) A cellphonedb dot plot of receptor‐ligand interactions between epithelial cell and CD8+ T cell subtypes in HRD (upper) and HRP (lower) groups. Dot size represented the p value of ligand‐receptor interaction. Dot color represented the means of ligand‐receptor interaction (Red, higher mean expression; purple, lower mean expression). F) A violin plot showing exhausted and cytotoxic signatures of CD8+ T cell subtypes. G) A column plot demonstrating the clonal expansion of CD8+ T cell subtypes in HRP and HRD samples. H) A UMAP plot showing tumor‐reactive CD8+ CXCL13+ T cells (clonal expansion ≥ 2) in HRD and HRP groups. Red, CD8+ CXCL13+ T cells; grey, other CD8+ T cells. I) A column plot showing tumor‐reactive CD8+ CXCL13+ T cells(clonal expansion ≥ 2) in HRD and HRP groups. P value was calculated by a Wilcoxon signed rank test. *P < 0.05.
Figure 6
Figure 6
CD4+ T cells: massive clonal expanded Treg in HRD group versus quiescent Tcm cells in HRP group. A) A UMAP plot demonstrating CD4+ T cells reclustered into 5 subtypes. B) A boxplot showing clonal expansion of CD4+ T cell in HRD and HRP groups. P value was calculated by a Wilcoxon signed rank test. *P < 0.05. C) A column plot representing the proportion of CD4+ T cell subtypes (expanded clonotypes ≥ 2) in each sample. D) UMAP plots demonstrating the expression level of CCR8, TNFRSF4 and CTLA4 in CD4+ T cells. Bar color, represented the gene expression level (Red, higher expression; grey, lower expression).
Figure 7
Figure 7
A summary diagram of tumor immune microenviroment and precise treatment for HRD and HRP HGSTOC patients.

References

    1. Sung H., Ferlay J., Siegel R. L., Laversanne M., Soerjomataram I., Jemal A., Bray F., Ca‐Cancer J. Clin. 2021, 71, 209. - PubMed
    1. Reid B. M., Permuth J. B., Sellers T. A., Cancer Biol. Med. 2017, 14, 9. - PMC - PubMed
    1. Lheureux S., Braunstein M., Oza A. M., Ca‐Cancer J. Clin. 2019, 69, 280. - PubMed
    1. Coleman R. L., N. Engl. J. Med. 2020, 382, 686. - PubMed
    1. Miller R. E., Leary A., Scott C. L., Serra V., Lord C. J., Bowtell D., Chang D. K., Garsed D. W., Jonkers J., Ledermann J. A., Nik‐Zainal S., Ray‐Coquard I., Shah S. P., Matias‐Guiu X., Swisher E. M., Yates L. R., Ann. Oncol. Off. J. Eur. Soc. Med. Oncol. 2020, 31, 1606. - PubMed

MeSH terms

Substances

LinkOut - more resources