. 2024 Oct;11(38):e2400666.
doi: 10.1002/advs.202400666. Epub 2024 Aug 13.

CDK4/6 Inhibitors Impede Chemoresistance and Inhibit Tumor Growth of Small Cell Lung Cancer

Affiliations

CDK4/6 Inhibitors Impede Chemoresistance and Inhibit Tumor Growth of Small Cell Lung Cancer

Yang Wen et al. Adv Sci (Weinh). 2024 Oct.

Abstract

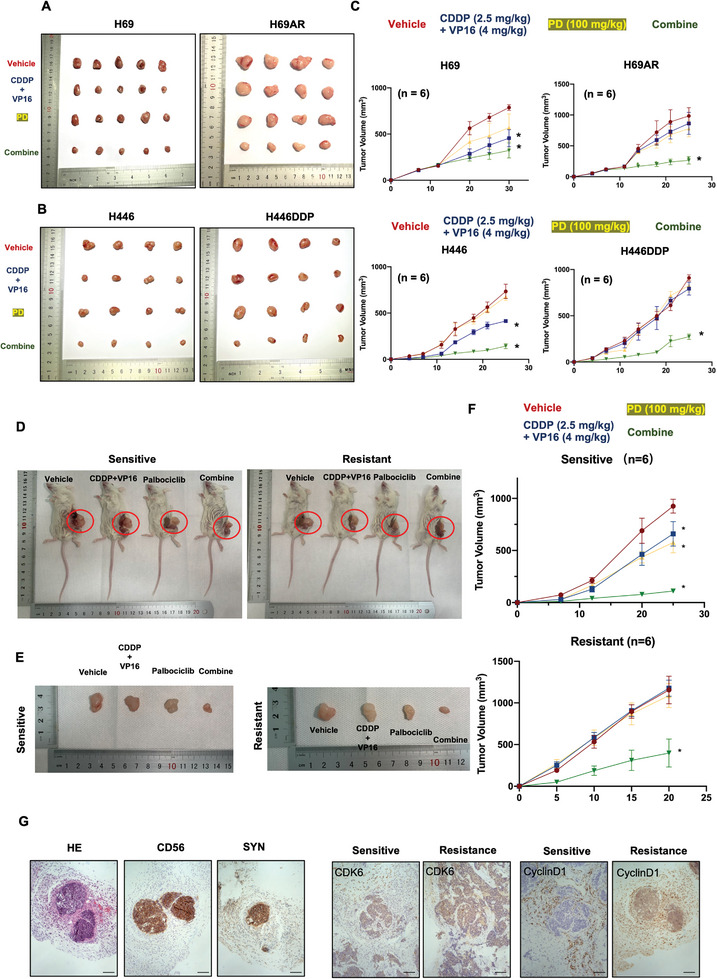
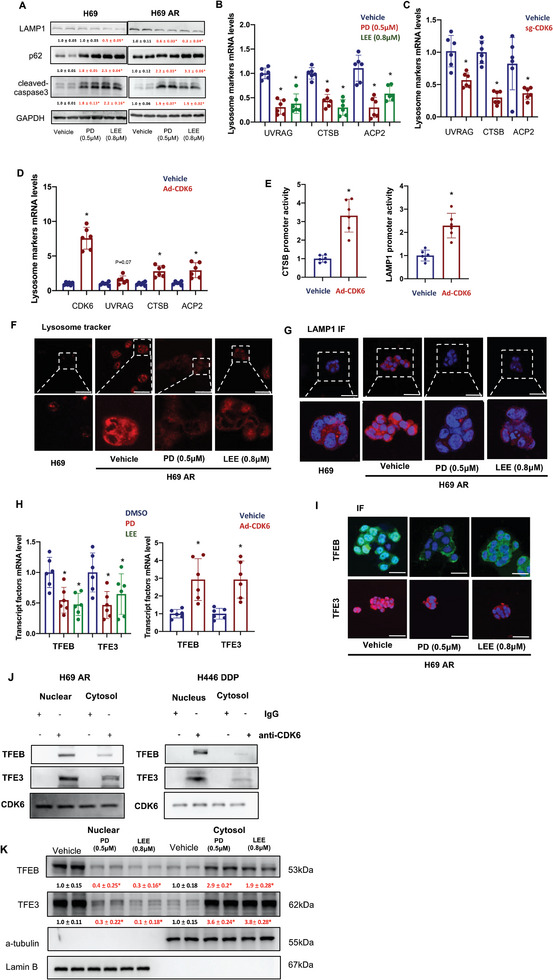
Small cell lung cancer (SCLC) is characterized by rapid development of chemoresistance and poor outcomes. Cyclin-dependent kinase 4/6 inhibitors (CDK4/6is) are widely used in breast cancer and other cancer types. However, the molecular mechanisms of CDK4/6 in SCLC chemoresistance remain poorly understood. Here, Rb1flox/flox, Trp53flox/flox, Ptenflox/flox (RTP) and Rb1flox/flox, Trp53flox/flox, MycLSL/LSL (RPM) spontaneous SCLC mouse models, SCLC cell line-derived xenograft (CDX) models, and SCLC patient-derived xenograft (PDX) models are established to reveal the potential effects of CDK4/6is on SCLC chemoresistance. In this study, it is found that CDK4/6is palbociclib (PD) or ribociclib (LEE) combined with chemotherapeutic drugs significantly inhibit SCLC tumor growth. Mechanistically, CDK4/6is do not function through the classic Retionblastoma1 (RB) dependent axis in SCLC. CDK4/6is induce impair autophagy through the AMBRA1-lysosome signaling pathway. The upregulated AMBRA1 protein expression leads to CDK6 degradation via autophagy, and the following TFEB and TFE3 nuclear translocation inhibition leading to the lysosome-related genes levels downregulation. Moreover, it is found that the expression of CDK6 is higher in SCLC tumors than in normal tissue and it is associated with the survival and prognosis of SCLC patients. Finally, these findings demonstrate that combining CDK4/6is with chemotherapy treatment may serve as a potential therapeutic option for SCLC patients.

Keywords: AMBRA1; CDK6; SCLC; autophagic flux; chemoresistance; lysosomal depletion.


Conflict of interest statement

The authors declare no conflict of interest.

Figures

Figure 1
Figure 1
Cyclin‐dependent kinase 6 is involved in chemoresistance of SCLC. A) Differentially expressed genes in H69AR cells compared with H69 cells determined by RNA sequencing, p < 0.05. B) The synergy score of PD and LEE with VP16, etoposide of cell viability inhibiton in H69AR cells. C) The protein expression of CDK4 and CDK6 in H69, H69AR, H446, and H446DDP cells (n = 6). D) IC50 values detected in CDK6 sgRNA‐transfected H69AR cells, CDK6 siRNA‐transfected H69AR cells, CDK6‐overexpressing adenovirus‐infected H69 cells, CDK6 siRNA‐transfected H446DDP cells, and CDK6‐overexpressing adenovirus‐infected H446 cells treated with or without chemotherapeutic drugs. ADM, adriamycin; DDP, cisplatin; VP16, etoposide. E) IC50 values detected in H69, H69AR, H446, and H446DDP cells treated with or without PD (0.5 µm) and LEE (0.8 µm). PD, palbociclib; LEE, ribociclib. (n = 6). F) CDK4 and CDK6 protein expression in H69AR cells treated with PD (0.5 µm) and LEE (0.8 µm) for 0, 6, 12, or 24 h. The right panel is the statistical graph of CDK4 and CDK6 protein expressions. The data are shown as the mean ± SD, *p < 0.05.
Figure 2
Figure 2
CDK4/6 inhibitors inhibits tumor growth and enhances tumor response to chemotherapy in spontaneous SCLC mouse models. A) Working protocol of chemotherapy (cisplatin 2.5 mg kg−1, i.p. injection; etoposide 4 mg kg−1, i.p. injection) with or without PD combination (100 mg kg−1, administered by gavager on days 1–5, weekly, 1 cycle per week for 4 weeks) in RB1flox/flox, Trp53flox/flox,Myclsl/lsl (RPM) mice. B) Kaplan‒Meier survival curve of RPM mice with or without chemotherapy and PD treatment single or combination (n = 6). C) MRI images of RPM mice with or without chemotherapy and PD treatment single or combination (n = 3). D) HE staining images of RPM mice with or without chemotherapy and PD treatment single or combination. E) Working protocol of chemotherapy (cisplatin 2.5 mg kg−1, i.p. injection; etoposide 4 mg kg−1, i.p. injection) with or without PD combination (100 mg kg−1, administered by gavager on days 1–5, weekly, 1 cycle per week for 6 weeks) in RB1flox/flox, Trp53flox/flox, Ptenflox/flox (RTP) mice (n = 6). F) Kaplan‒Meier survival curve of RTP mice with or without chemotherapy and PD treatment single or combination (n = 6). G) MRI images of RTP mice with or without chemotherapy and PD treatment single or combination (n = 3). H) HE staining images of RTP mice with or without chemotherapy and PD treatment single or combination (n = 6). The data are shown as the mean ± SD, **p < 0.01; ***p < 0.001.
Figure 3
Figure 3
CDK4/6 inhibitors improve chemosensitivity and reverse chemoresistance in xengrafts SCLC mice model. A,B) Images of subcutaneous tumors derived from H69, H69AR, H446, or H446DDP cells after (cisplatin 2.5 mg kg−1, i.p. injection; etoposide 4 mg kg−1, i.p. injection) with or without PD combination (100 mg kg−1, administered by gavager on days 1–5, weekly) are shown (n = 6). C) The growth curves of xenografted tumors derived from SCLC cells treated with (cisplatin 2.5 mg kg−1, i.p. injection; etoposide 4 mg kg−1, i.p. injection) with or without PD combination (100 mg kg−1, administered by gavager on days 1–5, weekly) are shown (n = 6). D,E) Representative image of chemosensitive and chemotherapy‐resistant PDX model mice that received (cisplatin 2.5 mg kg−1, i.p. injection; etoposide 4 mg kg−1, i.p. injection), PD treatment (100 mg kg−1, administered by gavager on days 1–5, weekly), or combination treatment. The treatment lasted 25 and 20 days respectively. (n = 6). F) Tumor growth curves of chemosensitive and chemotherapy‐resistant patient‐derived xenografts after treatment for 25 and 20 days respectively (n = 6). G) Left panel. HE, CD56, and SYN staining in SCLC PDX tumors. CD56 and SYN are neuroendocrine markers. Right panel. CDK6 and Cyclin D1 immunostaining in chemosensitive and chemotherapy‐resistant PDX tumors. Scale bar: 50 µm. The data are shown as the mean ± SD, *p < 0.05.
Figure 4
Figure 4
Autophagic flux is involved in CDK4/6 inhibitor‐induced cell apoptosis. A) After RNA sequencing in H69AR cells and H69AR cells treated with CDK4/6 inhibitors, KEGG analysis of differentially expressed genes in bubble plots was performed (the pathway which p < 0.05 were shown). B) The Human GeCKOv2A CRISPR knockout pooled library was used to identify genes related to CDK4/6 inhibitors in H69AR cells. KEGG analysis of the negatively regulated genes in H69AR cells treated with CDK4/6 inhibitors was performed (the pathway which p < 0.05 were shown). C) Transmission electron microscopy images of H69 and H69AR cells treated with or without PD (0.5 µm) and LEE (0.8 µm). Thin arrow, mitochondria. Thick arrow, autophagosome. Triangle, lysosome. Scale bar: 2 µm. D) Autophagic flux was analyzed in H69 and H69AR cells treated with or without PD (0.5 µm) and LEE (0.8 µm) and transfected with the mRFP‐GFP‐LC3 dual reporter virus (n = 6). Scale bar: 10 µm. E,F) Protein expression levels of LC3B, p62 and cleaved caspase‐3 in H69 and H69 AR cells treated with PD and CQ alone or in combination (n = 6). The data are shown as the mean ± SD, *p < 0.05. In panel D, *p < 0.05 and # p < 0.05 indicating the different total autophagosomes and impaired autophagosomes between groups, respectively.
Figure 5
Figure 5
Lysosomal dysfunction mediated by CDK4/6 inhibitors. A) Protein expression levels of LAMP1, p62 and cleaved caspase‐3 were detected in H69 and H69AR cells with or without PD (0.5 µm) and LEE (0.8 µm) treatment (n = 6). B) Lysosome‐associated genes (UVRAG, CTSB, and ACP2) were detected in H69AR cells treated with PD (0.5 µm) and LEE (0.8 µm) (n = 6). C,D) UVRAG, CTSB, and ACP2 mRNA levels in CDK6 sgRNA‐transfected H69AR and CDK6‐overexpressing adenovirus‐infected H69 cells (n = 6). E) CTSB and LAMP1 promoter activities in blank vector‐infected and CDK6‐overexpressing adenovirus‐infected H69 cells (n = 6). F,G) Images of lysosome marker and LAMP1 immunofluorescence in H69 and H69AR cells with or without PD and LEE treatment (n = 3). Scale bar: 10 µm. H) mRNA levels of TFEB and TFE3 in H69AR cells treated with PD and LEE or in H69 cells infected with CDK6‐overexpressing adenovirus (n = 6). I) Immunofluorescence images of TFEB and TFE3 in H69AR cells with or without PD (0.5 µm) and LEE (0.8 µm) treatment. Scale bar: 10 µm. J) Immunoprecipitation of CDK6 with TFEB and TFE3 in the nucleus and cytoplasm of H69AR and H446DDP cells. K) Protein expression levels of TFEB and TFE3 in the nucleus and cytoplasm of H69AR cells with or without PD and LEE treatment (n = 6). The data are shown as the mean ± SD, *p < 0.05.
Figure 6
Figure 6
AMBRA1 is a target of CDK4/6 inhibitors in SCLC cells. A) Proteomic analysis of CDK6‐interacting proteins in H69AR cells treated with PD.B) AMBRA1 protein expression in H69AR cells with or without PD (0.5 µm) and LEE (0.8 µm) treatment. C) Protein expression of AMBRA1 and CDK6 in H69AR cells or siAMBRA1‐transfected H69AR cells with or without PD (0.5 µm) and LEE (0.8 µm) treatment. CUL4A, AMBRA1, and CDK6 protein expression in H69AR cells or siCUL4A‐transfected H69AR cells with or without PD and LEE treatment (n = 6). D,E) Immunoprecipitation of CDK6 with AMBRA1 and CUL4A in PD‐ and LEE‐treated H69AR cells. F) Immunoprecipitation of CDK6 with ubiquitin, AMBRA1, LC3B, and CUL4A in scramble‐ or siAMBRA1‐transfected H69AR cells with or without PD and LEE treatment. G) Direct interaction between CDK6 and LC3B confirmed by GST pull‐down assays. H) xLIR domain mutation inhibited the CDK6 and LC3B interaction in PD (0.5 µm) and LEE (0.8 µm) treated H69AR cells. I) Immunoprecipitation of CDK6 with K27 ubiquitin, K48 ubiquitin and K63 ubiquitin in PD‐treated H69AR cells. CDK6 is ubiquitinated by K63 ubiquitin and K48 ubiquitin but not K27 ubiquitin. The data are shown as the mean ± SD, *p < 0.05.
Figure 7
Figure 7
CDK6 expression is upregulated in SCLC tissues and predicts a poor prognosis. A) Immunohistochemistry images showing CDK6 expression in paraffin tissues from SCLC patients (n = 34). The left panel is a representative picture of patient tissue with high CDK6 expression. The center panel is a representative picture of patient tissue with low CDK6 expression. Scale bar: 50 µm. B) Differential CDK6 expression was compared between SCLC tissue samples (n = 34) and matched normal tissue samples (n = 10). The median CDK6 expression level in each group is represented by a horizontal line in the scatter plot. C) Kaplan‒Meier survival curve showing the correlation between CDK6 expression and overall survival in 34 SCLC patients. D) Immunohistochemistry images of AMBRA1, LAMP1, Beclin1, p62, and LC3B expression in tumors with high CDK6 expression and tumors with low CDK6 expression (n = 34). Scale bar: 50 µm. E) Pearson correlation coefficient results for CDK6‐AMBRA1 and CDK6‐LAMP1 (n = 34). F) A signaling pathway map illustrating how CDK4/6 inhibitors ameliorate SCLC chemotherapy resistance by regulating autophagy. The data are shown as the mean ± SD, ****p < 0.001.

References

    1. a) Sabari J. K., Lok B. H., Laird J. H., Poirier J. T., Rudin C. M., Nat. Rev. Clin. Oncol. 2017, 14, 549; - PMC - PubMed
    2. b) Tsoukalas N., Aravantinou‐Fatorou E., Baxevanos P., Tolia M., Tsapakidis K., Galanopoulos M., Liontos M., Kyrgias G., Ann. Transl. Med. 2018, 6, 145; - PMC - PubMed
    3. c) van Meerbeeck J. P., Fennell D. A., De Ruysscher D. K., Lancet 2011, 378, 1741. - PubMed
    1. Kahnert K., Kauffmann‐Guerrero D., Huber R. M., Clin. Lung Cancer 2016, 17, 325. - PubMed
    1. a) Veronesi G., Bottoni E., Finocchiaro G., Alloisio M., Lung Cancer 2015, 90, 582; - PubMed
    2. b) Thai A. A., Solomon B. J., Sequist L. V., Gainor J. F., Heist R. S., Lancet 2021, 398, 535. - PubMed
    1. a) Gazdar A. F., Bunn P. A., Minna J. D., Nat. Rev. Cancer 2017, 17, 725; - PubMed
    2. b) Belani C. P., Dahlberg S. E., Rudin C. M., Fleisher M., Chen H. X., Takebe N., Velasco M. R., Tester W. J., Sturtz K., Hann C. L., Shanks J. C., Monga M., Ramalingam S. S., Schiller J. H., Cancer 2016, 122, 2371. - PMC - PubMed
    1. Ko J., Winslow M. M., Sage J., EMBO Mol. Med. 2021, 13, 13122. - PMC - PubMed

MeSH terms

LinkOut - more resources