. 2024 Oct 15;30(20):4768-4779.
doi: 10.1158/1078-0432.CCR-23-1242.

Integrative Multiomic Profiling of Triple-Negative Breast Cancer for Identifying Suitable Therapies

Affiliations

Integrative Multiomic Profiling of Triple-Negative Breast Cancer for Identifying Suitable Therapies

Bojana Jovanović et al. Clin Cancer Res. .

Abstract

Purpose: Triple-negative breast cancer (TNBC) is a heterogeneous disease that carries the poorest prognosis of all breast cancers. Although novel TNBC therapies in development are frequently targeted toward tumors carrying a specific genomic, transcriptomic, or protein biomarker, it is poorly understood how these biomarkers are correlated.

Experimental design: To better understand the molecular features of TNBC and their correlation with one another, we performed multimodal profiling on a cohort of 95 TNBC. Our approach involved quantifying tumor-infiltrating lymphocytes through hematoxylin and eosin staining, assessing the abundance of retinoblastoma, androgen receptor, and PDL1 proteins through IHC, and carrying out transcriptomic profiling using the NanoString BC360 platform, targeted DNA sequencing on a subset of cases, as well as evaluating associations with overall survival.

Results: Levels of RB1 mRNA and RB proteins are better correlated with markers of retinoblastoma functionality than RB1 mutational status. Luminal androgen receptor tumors clustered into two groups with transcriptomes that cluster with either basal or mesenchymal tumors. Tumors classified as PDL1-positive by the presence of immune or tumor cells showed similar biological characteristics. HER2-low TNBC showed no distinct biological phenotype when compared with HER2-zero. The majority of TNBC were classified as basal or HER2-enriched by PAM50, the latter showing significantly improved overall survival.

Conclusions: Our study contributes new insights into biomarker utility for identifying suitable TNBC therapies and the intercorrelations between genomic, transcriptomic, protein, and cellular biomarkers. Additionally, our rich data resource can be used by other researchers to explore the interplay between DNA, RNA, and protein biomarkers in TNBC.


Conflict of interest statement

S.E. Church reports other support from NanoString Technologies outside the submitted work. K. North reports employment with NanoString Technologies Inc when completing this work. E.T. Richardson reports personal fees and nonfinancial support from Merck & Co, Inc and grants from AstraZeneca outside the submitted work. V. Attaya reports personal fees from Olema Oncology outside the submitted work. N.U. Lin reports grants from Genentech, Zion Pharmaceuticals, and Merck; grants and personal fees from Pfizer/SeaGen, AstraZeneca, and Olema Pharmaceuticals; and personal fees from Stemline/Menarini, Artera Inc, Daiichi Sankyo, Blueprint Medicines, and Janssen outside the submitted work. E.A. Mittendorf reports other support from AstraZeneca, BioNTech, Merck, Moderna, Merck Sharp & Dohme, Gilead, and American Society of Clinical Oncology; nonfinancial support from BMS and Roche/Genentech; and grants from Roche/Genentech and Susan G. Komen outside the submitted work. S.M. Tolaney reports grants from Eli Lilly during the conduct of the study as well as grants and personal fees from Genentech/Roche, Merck, Pfizer, Novartis, Bristol Myers Squibb, Eisai, AstraZeneca, Gilead, Seattle Genetics, and Jazz Pharmaceuticals; grants from Exelixis, NanoString Technologies, and OncoPep; and personal fees from Eli Lilly, Sanofi, CytomX Therapeutics, Daiichi Sankyo, OncXerna, Zymeworks, Zentalis, Blueprint Medicines, Reveal Genomics, ARC Therapeutics, Infinity Therapeutics, Sumitovant Biopharma, Umoja Biopharma, Artios Pharma, Menarini/Stemline, Aadi Bio, Bayer, Incyte Corp, Natera, Tango Therapeutics, Systimmune, eFFECTOR, Hengrui USA, Cullinan Oncology, Circle Pharma, Arvinas, BioNTech, and Johnson & Johnson outside the submitted work. S. Goel reports grants from Eli Lilly during the conduct of the study as well as grants from Gi Therapeutics and Incyclix Bio and personal fees from Pfizer, Novartis, Regor Pharmaceuticals, and Beigene outside the submitted work. No disclosures were reported by the other authors.

Figures
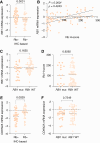
Figure 1.
Figure 1.
Correlations between RB1 genomic alterations, RB1 gene expression, and RB protein levels in TNBC. A,RB1 mRNA levels in Rb-positive versus Rb-negative tumors. Horizontal lines represent the mean level of normalized RB1 expression; error bars, SEM (P = 0.0031 for Mann-Whitney test, two-tailed). B, Correlation between normalized RB1 mRNA expression and Rb protein levels (H-score; Pearson correlation, ρ = 0.4243, P < 0.0001, two-tailed). C, Normalized RB1 mRNA expression in RB1-altered versus wild-type (WT) tumors. Horizontal lines represent the mean level of normalized RB1 expression; error bars, SEM (P = 0.1635 for Mann-Whitney test, two-tailed). D, Rb protein levels (H-scores) in RB1-altered versus WT tumors. Horizontal lines represent the mean percent of Rb H-score; error bars, SEM (P = 0.9292 for Mann-Whitney test, two-tailed). E, Normalized CDKN2A mRNA expression in Rb-positive versus Rb-negative tumors. Horizontal lines represent the mean level of normalized CDKN2A expression; error bars, SEM (P = 0.0029 for Mann-Whitney test, two-tailed). F, Normalized CDKN2A mRNA expression in RB1-altered versus WT tumors. Horizontal lines represent the mean level of normalized CDKN2A expression; error bars, SEM (P = 0.7249 for Mann-Whitney test, two-tailed).
Figure 2.
Figure 2.
Comparison of gene expression profiles in AR-positive versusAR-negative TNBC. A, Volcano plot comparing gene expression/gene signatures in AR-positive versus AR- negative tumors. The vertical dashed line indicates zero log2 fold-change. The left side of the dashed line indicates a decrease in AR-positive tumors, whereas the right side indicates an increase in AR-positive tumors. Blue points indicate adjusted P < 0.05, whereas green points indicate adjusted P ≥ 0.05. B, Normalized AR mRNA expression in AR-positive versus AR-negative tumors. Horizontal lines represent the mean level of normalized AR expression; error bars, SEM (P < 0.0001 for Mann-Whitney test, two-tailed). C, Correlation between normalized AR mRNA expression and AR protein levels (H-score; Pearson correlation, ρ = 0.6629, P < 0.0001, two-tailed). D, Distribution of PAM50 subtypes in AR-positive versus AR-negative tumors (P = 0.001 for Fisher’s exact test, two-sided). E, Distribution of TNBC subtypes in AR-positive versus AR-negative tumors (P < 0.0001 for χ2 test). TNBC subtypes are abbreviated as follows: BLIA, basal-like immune-activated; BLIS, basal-like immune-suppressed; LAR, luminal androgen receptor; MES, mesenchymal. F, Dendrogram depicting relatedness among TNBC based on unsupervised hierarchical clustering of gene expression. Annotations are included for PAM50 and TNBC subtypes. G, Normalized AR mRNA levels in LAR-cluster 1 (CL1), LAR-cluster 2 (CL2), and non-LAR-cluster (non-CL) tumors. Horizontal lines represent the mean levels of normalized AR mRNA expression; error bars, SEM (P = 0.0048, P < 0.0001, P < 0.0001 for a two-tailed unpaired t test). H, Normalized ERBB2 mRNA expression in AR-positive versus AR-negative tumors. Horizontal lines represent the mean level of normalized ERRB2 expression; error bars, SEM (P = 0.0012 for Mann-Whitney test, two-tailed). I, Normalized ERBB2 mRNA expression in LAR-cluster 1 (CL1), LAR-cluster 2 (CL2), and non-LAR-cluster (non-CL) tumors. Horizontal lines represent the mean level of normalized ERBB2 expression; error bars, SEM (P = 0.0335, P = 0.2400, P < 0.0001 for a two-tailed unpaired t test). J, Normalized TIGIT mRNA expression in AR-positive versus AR-negative tumors. Horizontal lines represent the mean level of normalized TIGIT expression; error bars, SEM (P = 0.0102 for Mann-Whitney test, two-tailed).
Figure 3.
Figure 3.
Gene expression profiles of PDL1-positive versus PDL1-negative TNBC. A, Correlation between percentage PDL1-positive tumor cells and PDL1 IC (Pearson correlation, ρ = 0.2167, P = 0.0567, two-tailed). B, Correlation of gene expression in PDL1-positive versus PDL1-negative (TC) and PDL1-positive versus PDL1-negative (IC) tumors both depicted as genes’ log fold-change (Pearson correlation, ρ = 0.8253, P < 0.0001, two-tailed). C, Distribution of PAM50 subtypes in PDL1-positive versus PDL1-negative (both by IC and TC) tumors (PDL1 IC and TC, P > 0.9999 for Fisher’s exact test, two-sided). D, Distribution of TNBC subtypes in PDL1-positive versus PDL1 (both by IC and TC) tumors (PDL1 IC, P = 0.2373 and PDL1 TC, P = 0.3209 for χ2 test). TNBC subtypes are abbreviated as follows: BLIA, basal-like immune-activated; BLIS, basal-like immune-suppressed; LAR, luminal androgen receptor; MES, mesenchymal. E, Distribution of PDL1-positive versus PDL1-negative (both by IC and TC) tumors based on alteration status of PI3K pathway genes (P > 0.9999 for Fisher’s exact test, two-sided), BRCA genes (P = 0.1603 for Fisher’s exact test, two-sided), TP53 (P = 0.7766 for Fisher’s exact test, two-sided) or RB1 (P = 0.4142 for Fisher’s exact test, two-sided).
Figure 4.
Figure 4.
Comparison of gene expression and immune profiles in TNBC harboring specific genomic alterations. A, Distribution of PAM50 subtypes in tumors with or without alterations in PI3K pathway genes, (P = 0.0400), BRCA genes (P = 0.5879), TP53 (P = 0.7017), or RB1 (P = 0.2903) for Fisher’s exact test, two-sided. B, Distribution of TNBC subtypes in tumors with or without alterations in PI3K pathway genes (P = 0.0285), BRCA genes (P = 0.2636), TP53 (P = 0.0158), or RB1 (P = 0.7617) for χ2 test. TNBC subtypes are abbreviated as follows: BLIA, basal-like immune-activated; BLIS, basal-like immune-suppressed; LAR, luminal androgen receptor; MES, mesenchymal. C, Normalized AR mRNA expression in TNBC based on genetic alteration status for genes in PI3K pathway (P = 0.0285), BRCA genes (P = 0.8346), TP53 (P = 0.0473), or RB1 (P = 0.1635). Horizontal lines represent the mean level of normalized AR expression; error bars, SEM, and P values for the Mann-Whitney test, two-tailed. D, Normalized RB1 mRNA levels in TNBC based on genetic alteration status for genes in PI3K pathway (P = 0.0011), BRCA genes (P = 0.9697), TP53 (P = 0.5262) or RB1 (P = 0.0545). Horizontal lines represent the mean level of normalized RB1 expression; error bars, SEM, and P values for the Mann-Whitney test, two-tailed. E, Distribution of PDL1-positive versus PDL1-negative (IC) tumors based on alteration status for genes in PI3K pathway (P = 0.7942), BRCA genes (P = 0.2857), TP53 (P > 0.9999), or RB1 (P = 0.1643) for Fisher’s exact test, two-sided. F, Distribution of PDL1-positive versus PDL1-negative (TC) tumors based on alteration status for genes in PI3K pathway (P > 0.9999), BRCA genes (P = 0.1603), TP53 (P = 0.7766), or RB1 (P = 0.4142) for Fisher’s exact test, two-sided.
Figure 5.
Figure 5.
Gene expression profile associations with OS in TNBC (A) Swimmer’s plot for 94 patients with TNBC indicating vital status; arrowed lines denote “alive” and lines without arrows denote “deceased” status. B, Kaplan–Meier plot showing overall survival for patients with TNBC based on PAM50 gene subtype. Basal is marked in red and HER2 is marked in pink. Numbers of patients at risk over time are depicted under the graph (log-rank test, P = 0.055). C, Volcano plot comparing gene expression/gene signatures in patients with OS above versus below median OS (in all deceased patients). The vertical dashed line indicates zero log2 fold-change. The left side of the dashed line indicates a decrease in patients with high median survival, whereas the right side indicates an increase in patients with high median survival. Blue points indicate adjusted P < 0.05, whereas green points indicate adjusted P ≥ 0.05.

References

    1. Perou CM, Sørlie T, Eisen MB, van de Rijn M, Jeffrey SS, Rees CA, et al. . Molecular portraits of human breast tumours. Nature 2000;406:747–52. - PubMed
    1. Garrido-Castro AC, Lin NU, Polyak K. Insights into molecular classifications of triple-negative breast cancer: improving patient selection for treatment. Cancer Discov 2019;9:176–98. - PMC - PubMed
    1. Dent R, Trudeau M, Pritchard KI, Hanna WM, Kahn HK, Sawka CA, et al. . Triple-negative breast cancer: clinical features and patterns of recurrence. Clin Cancer Res 2007;13:4429–34. - PubMed
    1. Carey LA, Dees EC, Sawyer L, Gatti L, Moore DT, Collichio F, et al. . The triple negative paradox: primary tumor chemosensitivity of breast cancer subtypes. Clin Cancer Res 2007;13:2329–34. - PubMed
    1. Siegel RL, Miller KD, Wagle NS, Jemal A. Cancer statistics, 2023. CA Cancer J Clin 2023;73:17–48. - PubMed

MeSH terms