. 2024 Nov;66(11):2379-2394.
doi: 10.1111/jipb.13762. Epub 2024 Aug 13.

MYB52 negatively regulates ADF9-meditated actin filament bundling in Arabidopsis pavement cell morphogenesis

Affiliations

MYB52 negatively regulates ADF9-meditated actin filament bundling in Arabidopsis pavement cell morphogenesis

Tianqi Qiu et al. J Integr Plant Biol. 2024 Nov.

Abstract

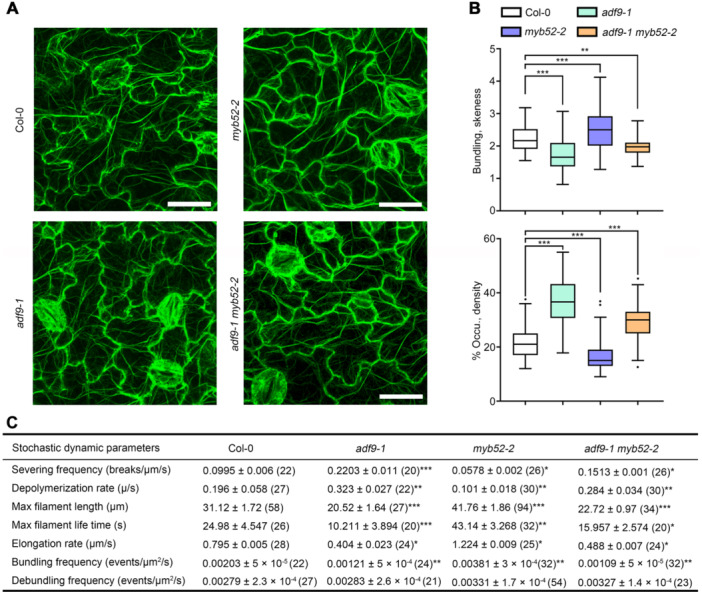
It has been proposed that cortical fine actin filaments are needed for the morphogenesis of pavement cells (PCs). However, the precise role and regulation mechanisms of actin filaments in PC morphogenesis are not well understood. Here, we found that Arabidopsis thaliana ACTIN DEPOLYMERIZING FACTOR9 (ADF9) is required for the morphogenesis of PC, which is negatively regulated by the R2R3 MYELOBLASTOSIS (MYB) transcription factor MYB52. In adf9 mutants, the lobe number of cotyledon PCs was significantly reduced, while the average lobe length did not differ significantly compared to that of wild type (Col-0), except for the variations in cell area and circularity, whereas the PC shapes in ADF9 overexpression seedlings showed different results. ADF9 decorated actin filaments, and colocalized with plasma membrane. The extent of filament bundling and actin filament bundling activity in adf9 mutant decreased. In addition, MYB52 directly targeted the promoter of ADF9 and negatively regulated its expression. The myb52-2 mutant showed increased lobe number and cell area, reduced cell circularity of PCs, and the PC phenotypes were suppressed when ADF9 was knocked out. Taken together, our data demonstrate that actin filaments play an important role in the morphogenesis of PC and reveal a transcriptional mechanism underlying MYB52 regulation of ADF9-mediated actin filament bundling in PC morphogenesis.

Keywords: ADF9; MYB52; actin filament bundling; pavement cell.


Conflict of interest statement

The authors declare no conflict of interest.

Figures

Figure 1
Figure 1
Actin depolymerizing factor9 (ADF9) regulates morphogenesis of cotyledon pavement cells (A) Phenotypes of cotyledons in Columbia (Col‐0), adf9‐1, adf9‐2, ADF9‐OE (overexpression) #2, ADF9‐OE #12, and ADF9‐COM (complementation) grown on ½ Murashige and Skoog (MS) medium for 7 d. Scale bars = 0.25 cm. (B) Statistical data of leaf area and length : width ratio for 7‐d‐old cotyledons of the genotypes depicted in (A). The values presented as mean ± SD, n > 30 cotyledons per genotype in each experiment. The significant differences are indicated with different letters (P < 0.05) using one‐way analysis of variance (ANOVA) and Tukey's test. (C) Cotyledon pavement cell phenotypes of Col‐0, adf9‐1, adf9‐2, ADF9‐OE #2, ADF9‐OE #12, and ADF9‐COM grown on ½ MS for 7 d. Scale bars = 100 µm. (D) Quantification of cell area, average lobe number, circularity, and average lobe length in (D). Values are means ± SD, n > 100 cells from about 30 leaves per genotype in each experiment. The significant differences are indicated with different letters (P < 0.05) using one‐way ANOVA and Tukey's test. Boxplots: the middle line of the box is the median. The upper and lower limits of the box are the upper quartile and the lower quartile. The line above and below the box represent the maximum and minimum values. Asterisks represent the mean value of samples. The dots represent the outliers.
Figure 2
Figure 2
Actin depolymerizing factor9 (ADF9) localizes to both plasma membrane and actin filaments (A) Subcellular localization of ADF9‐enhanced green fluorescent protein (eGFP)T7 genomic DNA (gDNA) controlled by its native promoter in the pavement cells (PCs) from fatty acid binding protein 2 (fABD2)‐mCherry seedlings. Images were processed using Z‐stacks (Z‐step size 0.4 μm) consisting of 15 individual images. Scale bars = 50 µm. (B) The 4‐d‐old seedlings that expressed ADF9‐eGFPT7 gDNA driven by native promoter dyed with FM4‐64. Scale bars = 50 µm. (C) Plot of the relative signal intensities along the line drawn in (A). It shows a strong association between the spatial localization of ADF9‐eGFPT7 and fABD2‐mCherry. (D) Plot of the relative signal intensities along the blue dotted line drawn in (B). It shows a strong association between the spatial localization of ADF9‐eGFPT7 and plasma membrane (PM).
Figure 3
Figure 3
Actin depolymerizing factor9 (ADF9) promotes actin filament bundling (A) Actin arrays in the pavement cells (PCs) of Columbia (Col‐0), adf9‐1 and ADF9‐COM (complementation) #5 cotyledons. Scale bars = 25 µm. (B) Quantification of the skewness and density of actin arrays in (A). All of the density and skewness values of Col‐0, adf9‐1 and ADF9‐COM #5 were statistically analyzed using Student's t‐test. **P < 0.01, and ***P < 0.001. Values are means ± SD, n = 3 experiments (approximately 300 images from 30 seedlings per genotype).
Figure 4
Figure 4
Time‐lapse imaging of actin filaments revealed a reduction in the bundling frequency in actin depolymerizing factor9 (adf9) cotyledon pavement cells (PCs) (A) Dynamics of single actin filaments in Columbia (Col‐0), adf9‐1 and ADF9‐COM (complementation) #5 cotyledon PCs. Images represent optical cuts. A filament highlighted with red dots are cut, green scissors indicate cutting events. Orange and purple dots indicate constriction of filament ends. (B) Quantification of dynamic parameters of single actin filament in the PCs of Col‐0, adf9‐1 and ADF9‐COM #5. More than 24 PCs from the Col‐0, adf9‐1 and ADF9‐COM #5 were used. Values given are means ± SE. *P < 0.05, **P < 0.01, and ***P < 0.001 by Student's t‐test.
Figure 5
Figure 5
MYELOBLASTOSIS52 (MYB52) recognizes Actin depolymerizing factor9 (ADF9) and negatively regulates ADF9 transcription (A) AA(A/C) AAAC motif in the promoter regions of ADF9 and PECTIN METYLESTERASE 16 (PMEI6) and a random sequence in the promoter of ACTIN7 (ACT7) as negative controls. Arrows are employed to indicate sequences, while numbers represent the nucleotide position in relation to the initiation codon of the gene. (B, C, and D) Electrophoretic mobility shift (EMSA) for MYB52 bond to the ADF9 promoter on different positions of the MYB binding site (MBS) in vitro. The biotin‐labeled promoter sequence was supplemented with an excess of unlabeled cold probe for competition. Arrows indicate the binding signals resulting from MYB52 binding to the ADF9 promoter. (E) Analysis of the protein expression of ADF9 in total protein from cotyledons of ADF9‐enhanced green fluorescent protein (eGFP)T7 and ADF9‐eGFPT7/myb52‐2 seedlings using western blot assay, and the numbers indicate the band intensity that was quantified by densitometric analyses. (F) Fluorescence signals of ADF9‐eGFPT7 in the pavement cells (PCs) of adf9‐1 and adf9‐1 myb52‐2 cotyledons. Scale bar = 50 µm. (G) β‐glucuronidase (GUS) staining in cotyledons of different genotypes carrying pADF9::GUS. Scale bar = 500 μm. (H) Chromatin immunoprecipitation (ChIP) – quantitative polymerase chain reaction analysis of 35S‐HA‐MYB52 (MYB52‐OE (overexpression)) transgenic plants using anti‐hemagglutinin (anti‐HA) antibodies. pPMEI6 and pACT7 were positive and negative controls respectively. Data represent means ± SD of triplicates, and asterisks indicate significant differences as determined by Student's t‐test (***P < 0.001). (I) Relative expression levels of ADF9 in cotyledons of Columbia (Col‐0), myb52‐2, and MYB52‐OE seedlings. Data represent the mean ± SD of three replicates. Asterisks indicate statistical differences from Col‐0 using Student's t‐test (***P < 0.001). (J) Quantitative analysis of the relative fluorescence intensity of ADF9‐eGFPT7 in the PCs of adf9‐1 and adf9‐1 myb52‐2 cotyledons. The results represent the means ± SEs (n = 30). ***P < 0.001 (Student's t‐test). Three independent experiments were conducted. (K) Analysis of relative GUS activity in G.
Figure 6
Figure 6
MYELOBLASTOSIS52 (MYB52) regulates the morphogenesis of cotyledon pavement cells (PCs) (A) Phenotypes of cotyledons in 7‐d‐old Columbia (Col‐0), myb52‐2, and MYB52‐OE (overexpression) seedlings. Scale bars = 0.25 cm. (B) Statistical data of leaf area and length : width ratio in Col‐0, myb52‐2, and MYB52‐OE cotyledons. Values are means ± SD, n > 30 leaves per genotype in each experiment. Different letters indicate significant differences (P < 0.05) using one‐way analysis of variance (ANOVA) and Tukey's test. (C) PC phenotypes in Col‐0, myb52‐2, and MYB52‐OE grown on ½ Murashige and Skoog for 7 d. Scale bars = 100 µm. (D) Quantitative determination of cell area, circularity, average lobe number and lobe length of PCs. Values are means ± SD, n > 100 cells from about 30 leaves per genotype in each experiment. Different letters indicate significant differences (P < 0.05) using ANOVA and Tukey's test.
Figure 7
Figure 7
Actin depolymerizing factor9 (ADF9) mutation suppresses the phenotypes of cotyledon pavement cells of myeloblastosis52 (myb52) mutant (A) The cotyledon phenotypes of Columbia (Col‐0), adf9‐1, myb52‐2, and adf9‐1 myb52‐2 grown on ½ Murashige and Skoog medium for 7 d. Scale bars = 0.25 cm. (B) Quantitative analysis of leaf area and length : width ratio of the genotypes in (A). Values are means ± SD, n > 30 leaves per genotype in each experiment. The significant differences are indicated with different letters (P < 0.05) using one‐way analysis of variance (ANOVA) and Tukey's test. (C) Pavement cell (PC) phenotypes of 7‐d‐old Col‐0, myb52‐2, and adf9‐1 myb52‐2. Scale bars = 100 µm. (D) Data of cell area, average lobe number, circularity and average lobe length of the PCs in (C). Values are means ± SD, n > 100 cells from about 30 leaves per genotype in each experiment. The significant differences are indicated with different letters (P < 0.05) using one‐way ANOVA and Tukey's test.
Figure 8
Figure 8
MYELOBLASTOSIS52 (MYB52) regulates Actin depolymerizing factor9 (ADF9)‐mediated actin filament bundling in the cotyledon pavement cells (PCs) (A) Actin arrays in the PCs of Columbia (Col‐0), adf9‐1, myb52‐2, and adf9‐1 myb52‐2 grown on 1/2 Murashige and Skoog medium for 5 d. Scale bars = 25 µm. (B) Skewness and density of actin arrays in PCs of Col‐0, adf9‐1, myb52‐2, and adf9‐1 myb52‐2. All density and skewness values were statistically analyzed using Student's t‐test. *P < 0.05, **P < 0.01, and ***P < 0.001. Values are means ± SD, n = 30 cells from 10 seedlings per genotype. (C) Quantification of the dynamics parameters of single actin filaments in PCs of Col‐0, adf9‐1, myb52‐2, and adf9‐1 myb52‐2 seedlings. More than 24 cotyledon PCs from Col‐0, adf9‐1, myb52‐2, and adf9‐1 myb52‐2 were used. The given values are means ± SE. *P < 0.05, **P < 0.01, and ***P < 0.001 by Student's t‐test.
Figure 9
Figure 9
Working model of MYELOBLASTOSIS52 (MYB52) and Actin depolymerizing factor9 (ADF9) in the morphogenesis of pavement cell in Arabidopsis (A) In Columbia (Col‐0) plants, MYB52 directly suppresses the expression of ADF9, which leads to decreases in actin filament bundles, thereby properly controlling the morphogenesis of pavement cells (PCs). (B) In the adf9 mutant lines, loss of ADF9 resulted in a reduction of actin filament bundling, leading to suppression of PC morphogenesis. (C) In myb52‐2 plants, the expression of ADF9 was upregulated, which resulted in an increase of actin filament bundling, promoting the morphogenesis of PCs.

Similar articles

References

    1. Altartouri, B. , Bidhendi, A.J. , Tani, T. , Suzuki, J. , Conrad, C. , Chebli, Y. , Liu, N. , Karunakaran, C. , Scarcelli, G. , and Geitmann, A. (2019). Pectin chemistry and cellulose crystallinity govern pavement cell morphogenesis in a multi‐step mechanism. Plant Physiol. 181: 127–141. - PMC - PubMed
    1. Andrianantoandro, E. , and Pollard, T.D. (2006). Mechanism of actin filament turnover by severing and nucleation at different concentrations of ADF/cofilin. Mol. Cell 24: 13–23. - PubMed
    1. Armour, W.J. , Barton, D.A. , Law, A.M.K. , and Overall, R.L. (2015). Differential growth in periclinal and anticlinal walls during lobe formation in Arabidopsis cotyledon pavement cells. Plant Cell 27: 2484–2500. - PMC - PubMed
    1. Belteton, S.A. , Li, W. , Yanagisawa, M. , Hatam, F.A. , Quinn, M.I. , Szymanski, M.K. , Marley, M.W. , Turner, J.A. , and Szymanski, D.B. (2021). Real‐time conversion of tissue‐scale mechanical forces into an interdigitated growth pattern. Nat Plants 7: 826–841. - PubMed
    1. Bi, S. , Li, M. , Liu, C. , Liu, X. , Cheng, J. , Wang, L. , Wang, J. , Lv, Y. , He, M. , Cheng, X. , et al. (2022). Actin depolymerizing factor ADF7 inhibits actin bundling protein VILLIN1 to regulate root hair formation in response to osmotic stress in Arabidopsis. PLoS Genet. 18: e1010338. - PMC - PubMed

MeSH terms

LinkOut - more resources