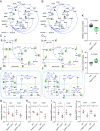
. 2024 Aug 20;121(34):e2404199121.
doi: 10.1073/pnas.2404199121. Epub 2024 Aug 13.

Genetic improvement of phosphate-limited photosynthesis for high yield in rice

Affiliations

Genetic improvement of phosphate-limited photosynthesis for high yield in rice

Bin Ma et al. Proc Natl Acad Sci U S A. .

Abstract

Low phosphate (Pi) availability decreases photosynthesis, with phosphate limitation of photosynthesis occurring particularly during grain filling of cereal crops; however, effective genetic solutions remain to be established. We previously discovered that rice phosphate transporter OsPHO1;2 controls seed (sink) development through Pi reallocation during grain filling. Here, we find that OsPHO1;2 regulates Pi homeostasis and thus photosynthesis in leaves (source). Loss-of-function of OsPHO1;2 decreased Pi levels in leaves, leading to decreased photosynthetic electron transport activity, CO2 assimilation rate, and early occurrence of phosphate-limited photosynthesis. Interestingly, ectopic expression of OsPHO1;2 greatly increased Pi availability, and thereby, increased photosynthetic rate in leaves during grain filling, contributing to increased yield. This was supported by the effect of foliar Pi application. Moreover, analysis of core rice germplasm resources revealed that higher OsPHO1;2 expression was associated with enhanced photosynthesis and yield potential compared to those with lower expression. These findings reveal that phosphate-limitation of photosynthesis can be relieved via a genetic approach, and the OsPHO1;2 gene can be employed to reinforce crop breeding strategies for achieving higher photosynthetic efficiency.

Keywords: grain yield; phosphate transporter; photosynthesis; rice; source and sink.


Conflict of interest statement

Competing interests statement:The authors declare no competing interest.

Figures
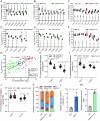
Fig. 1.
Fig. 1.
OsPHO1;2 allocates Pi to the leaves and facilitates photosynthesis. (A–C), Measurements of Pi concentration in flag leaves at the grain-filling stage from 0 DAF to 30 DAF in NILs (A), Ospho1;2-ko1 mutant (B), and OsPHO1;2 overexpression line (C). Data represent six plants (n = 6). (D–F) Measurements of net carbon assimilation rate (Anet) in flag leaves at 0 to 20 DAF in NILs (D), Ospho1;2-ko1 (E), and OsPHO1;2-OE (F). n = 6 plants in (D) and n = 12 plants in (E and F), respectively. (G), The dot plot of correlation between flag leaf Pi concentration and Anet among WT, Ospho1;2-ko1, OsPHO1;2-OE, and NILs. The trend line and R2 value were indicated in the graph. (H–J), Measurement of Pi concentration in isolated chloroplasts of NILs (H), WT/Ospho1;2-ko1 (I), and WT/OsPHO1;2-OE (J) flag leaves at the early and middle grain filling stage (n = 24). (K) 32P short-term stem-fed assay indicates the distribution ratio of newly absorbed Pi, in different tissues of the above-last-node part of rice plants. Four tissues were analyzed; error bars represent means ± SD of four plant repeats (n = 4). (L) Relative expression of OsPHO1;2 in WT and spdt-1 mutant flag leaves detected by qPCR. (M) Relative expression of SPDT in WT and Ospho1;2-ko1 mutant flag leaves detected by qPCR. The rice OsActin gene was used as internal control. Values are means ± SD (n = 3 biological repeats). P-values were indicated according to two-tailed Student’s t-tests.
Fig. 2.
Fig. 2.
OsPHO1;2 functions to relieve the Pi-limitation of photosynthesis during grain filling. (A and B), Measurements of the response of carbon assimilation rate (Anet) to intracellular CO2 concentration (Ci) (A-Ci curves) at 30 °C and 1,200 µmol photons, in NILs (A) and WT/Ospho1;2-ko1 (B) at 10 DAF. (C and D), Measurements of A-Ci curves at 30°C and 1,200 µmol photons in OsPHO1;2-OE line at 10 DAF (C) and 14 DAF (D). Flag leaves were measured. The shaded part between dotted lines represents the means ± SD of four plants (n = 4).
Fig. 3.
Fig. 3.
Loss of OsPHO1;2 causes up-regulated PSR genes, declined photosynthetic protein expression, and phosphorylation levels. (A) A heatmap of 97 differentially expressed P-starvation related (PSR) genes in flag leaves relative to WT during grain filling. The relative fold change is displayed on a log2 scale: red indicates up-regulated and blue indicates down-regulated, respectively. (B) Changes of photosynthetic proteins in flag leaves at grain filling stage detected by western blot, proteins of AtpB, PsaA, PsbA, Lhca1, Lhcb1, Rubisco activase (RCA), ndhH were detected. ko1 represents Ospho1;2-ko1, and OE represents OsPHO1;2-OE. Antibody of Actin was used as an internal control. The experiment was repeated twice with similar results. (C) The heatmap of differentially expressed photosynthetic, glycolysis-related, and photorespiration-related proteins between WT and Ospho1;2. Flag leaf proteomics was performed at early grain filling stages. (D) The heatmap of differential phosphorylation of photosynthetic and glycolysis-related proteins between WT and Ospho1;2 flag leaves. The relative fold change is displayed on a log2 scale: red indicates up-regulated and blue indicates down-regulated, respectively.
Fig. 4.
Fig. 4.
Metabolic profiles reveal decreased CBB metabolites, ATP, and NADPH levels in response to Ospho1;2 mutation. (A–F) Metabolite analysis of the Calvin–Benson–Bassham cycle (CBB, A and B), tricarboxylic acid cycle (TCA cycle, C and D), and photorespiration process (E and F) among WT and Ospho1;2-ko1 flag leaves at grain filling stages, including early grain filling (5 DAF, A, C, and E) and middle grain filling (15 DAF, B, D, and F). The relative levels of metabolites were shown as bar graphs, with gray and green columns indicate WT and Ospho1;2-ko1, respectively. (G–J), Relative ATP (G), ADP (H), NADPH (I), and NADP+ (J) contents in the flag leaves of WT and Ospho1;2-ko1 during grain filling. (K and L), Measurement of relative sucrose contents (K) and starch content (L) in WT and Ospho1;2-ko1 flag leaves at grain filling stage. For box-and-whisker plots, the central line, box, and whiskers indicate the median, IQR, and 1.5 times the IQR, respectively. Data represent five biologically independent samples (n = 5). *P < 0.05, **P < 0.01, ***P < 0.001, according to two-tailed Student’s t-tests.
Fig. 5.
Fig. 5.
Loss of OsPHO1;2 results in decreased photosynthetic electron transport activities and trans-thylakoid proton motive force. (A) Detection of the electron transport rate at photosystem II (ETRII) in WT, Ospho1;2-ko1, OsPHO1;2-OE (n = 5 plants). (B and C), Measurement of representative P700+ reduction curves in Photosystem I (B) and analysis of the initial rate of P700+ reduction (C) in WT, Ospho1;2-ko1, OsPHO1;2-OE (n = 6 plants). (D–F) Analysis of the representative light-off response curves (D), ΔpH components (slow rise phase amplitude indicates estimated ΔpH components of pmf, E), and decline amplitude (indicates estimated proton motive force, pmf, F) (n = 4 plants), the pmf and ΔpH components labeling in (D) is based on the blue curve of WT. Measurements were performed among WT, Ospho1;2-ko1, and OsPHO1;2-OE flag leaves at 5 DAF. P-values were indicated according to two-tailed Student’s t-tests.
Fig. 6.
Fig. 6.
High OsPHO1;2 expression and foliage Pi application improve leaf photosynthesis and yield potential in different rice varieties. (A–C), Measurements of flag leaf Pi concentration (A), net photosynthetic rates (Anet, B) at 5 DAF and 15 DAF, and grain yield (C) of 20 varieties from the Mini-Core Collection (with high or low OsPHO1;2 expression). The “High” or “Low” group each contains 10 varieties, n = 10 plants for each variety in (A and B) and n = 8 plants for each variety in (C). (D) Dot plot of the correlation between Anet and Pi contents among the 20 selected varieties at 5 DAF. (E) Dot plot of the correlation between grain yield and leaf Pi concentration among the 20 varieties. (F) Dot plot of the correlation between grain yield and Anet (5 DAF). The trend lines and R2 values were indicated in (D–F). (G), Measurements of flag leaf Pi concentration among cultivars NIP, WYJ, and WS3 under different foliar Pi supplements at 5 DAF (n = 12 plants). (H) Anet of cultivars NIP, WYJ, and WS3 detected under different foliar Pi supplements (n = 20 plants). (I–K) The plant morphologies of NIP (I), WYJ (J), and WS3 (K) at mature stage. (Scale bars, 20 cm.) (L) The grain yield per plant of NIP, WYJ, and WS3 under different foliar Pi supplements (n = 36 plants). (M) The grain yield per plot of NIP, WYJ, and WS3 under different foliar Pi supplements (n = 5 plots). Each plot includes 48 plants from NIP, WYJ, and WS3. Different lower-case letters indicate significant differences (P < 0.05) assessed by one-way ANOVA followed by Tukey’s HSD tests.
Fig. 7.
Fig. 7.
Proposed model of OsPHO1;2 in regulating leaf photosynthesis in rice. During grain filling, OsPHO1;2 is responsible for Pi allocation to leaves through the node, and proper Pi accumulation level in flag leaves constantly facilitate photosynthetic light reactions and carbon assimilation. While loss-of-function of OsPHO1;2 causes severe Pi-deficiency in leaves, which markedly represses the phosphorylation of photosynthetic proteins, CBB cycle components, ATP and NADPH synthesis, as well as the TP-Pi translocation efficiency. Additively, mutation of OsPHO1;2 causes earlier occurrence of Pi-limitation of photosynthesis, whereas overexpression of OsPHO1;2 delays it, thus greatly contributing to longer duration of high photosynthetic rate and higher grain yield. The purple arrowheads indicate the transport function of OsPHO1;2, and the brown arrowheads indicate the transport function of SPDT in the model.

References

    1. Plaxton W. C., Tran H. T., Metabolic adaptations of phosphate-starved plants. Plant Physiol. 156, 1006–1015 (2011). - PMC - PubMed
    1. Heuer S., et al. , Improving phosphorus use efficiency: A complex trait with emerging opportunities. Plant J. 90, 868–885 (2017). - PubMed
    1. Gamuyao R., et al. , The protein kinase Pstol1 from traditional rice confers tolerance of phosphorus deficiency. Nature 488, 535–539 (2012). - PubMed
    1. MacDonald G. K., Bennett E. M., Potter P. A., Ramankutty N., Agronomic phosphorus imbalances across the world’s croplands. Proc. Natl. Acad. Sci. U.S.A. 108, 3086–3091 (2011). - PMC - PubMed
    1. Veneklaas E. J., et al. , Opportunities for improving phosphorus-use efficiency in crop plants. New Phytol. 195, 306–320 (2012). - PubMed

MeSH terms

LinkOut - more resources