Randomized Controlled Trial
. 2024 Aug 13;134(18):e177492.
doi: 10.1172/JCI177492.

Teplizumab induces persistent changes in the antigen-specific repertoire in individuals at risk for type 1 diabetes

Affiliations
Randomized Controlled Trial

Teplizumab induces persistent changes in the antigen-specific repertoire in individuals at risk for type 1 diabetes

Ana Lledó-Delgado et al. J Clin Invest. .

Abstract

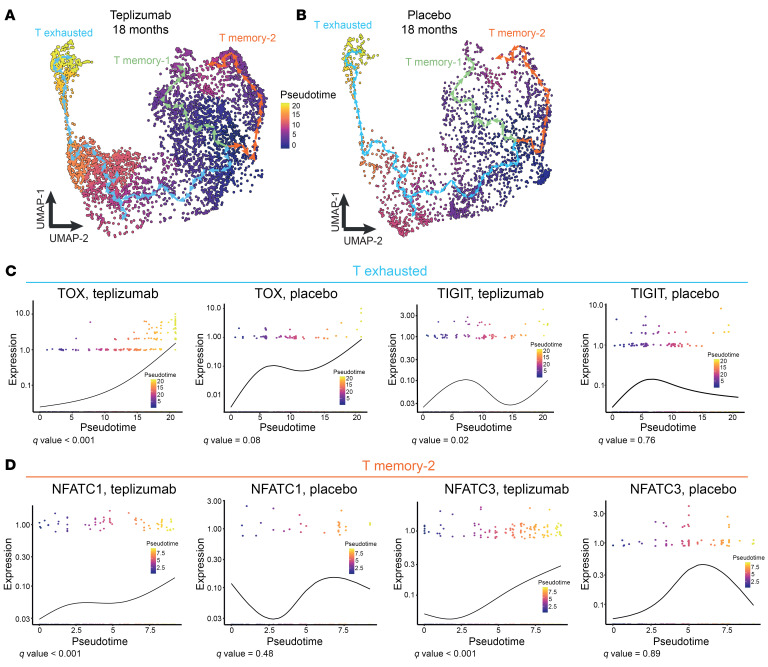
BACKGROUNDTeplizumab, a non-FcR-binding anti-CD3 mAb, is approved to delay progression of type 1 diabetes (T1D) in at-risk patients. Previous investigations described the immediate effects of the 14-day treatment, but longer-term effects of the drug remain unknown.METHODSWith an extended analysis of study participants, we found that 36% were undiagnosed or remained free of clinical diabetes after 5 years, suggesting operational tolerance. Using single-cell RNA sequencing, we compared the phenotypes, transcriptome, and repertoire of peripheral blood CD8+ T cells including autoreactive T cells from study participants before and after teplizumab and features of responders and non-responders.RESULTSAt 3 months, there were transcriptional signatures of cell activation in CD4+ and CD8+ T cells including signaling that was reversed at 18 months. At that time, there was reduced expression of genes in T cell receptor and activation pathways in clinical responders. In CD8+ T cells, we found increased expression of genes associated with exhaustion and immune regulation with teplizumab treatment. These transcriptional features were further confirmed in an independent cohort. Pseudotime analysis showed differentiation of CD8+ exhausted and memory cells with teplizumab treatment. IL7R expression was reduced, and patients with lower expression of CD127 had longer diabetes-free intervals. In addition, the frequency of autoantigen-reactive CD8+ T cells, which expanded in the placebo group over 18 months, did not increase in the teplizumab group.CONCLUSIONThese findings indicate that teplizumab promotes operational tolerance in T1D, involving activation followed by exhaustion and regulation, and prevents expansion of autoreactive T cells.TRIAL REGISTRATIONClinicalTrials.gov NCT01030861.FUNDINGNational Institute of Diabetes and Digestive and Kidney Diseases/NIH, Juvenile Diabetes Research Foundation.

Keywords: Adaptive immunity; Autoimmunity; Endocrinology; T cells; Tolerance.


Figures

Figure 1
Figure 1. Persistence of clinical responses to teplizumab.
(A) Kaplan-Meier curve showing the progression from stage 2 T1D to stage 3 T1D in TN10 study participants who were treated with teplizumab (n = 44) or placebo (n = 32). Median times to development of stage 3 T1D: teplizumab, 52.2 months (95% CI: 30.5–86.9); placebo, 27.3 months (95% CI: 9.5–48.4) (log rank P = 0.0026). (BD) Percentage of CD4+ T cells (B) and CD8+ T cells (C) and ratio of CD4+ to CD8+ T cells (D) by flow cytometry in clinical responders (n = 17) and non-responders (n = 27) to teplizumab treatment (*P < 0.05, **P < 0.01 by repeated-measures ANOVA corrected for the baseline values). Mean ± SEM from the mixed model is shown.
Figure 2
Figure 2. Changes across time in CD4+ T cells after teplizumab treatment.
(A and B) 3D UMAP visualization of CD4+ cells at 18 months. Points represent individual cells, and colors denote treatment arm (A) and clusters (B) as labeled (n = 7 teplizumab, n = 6 placebo). (C) Heatmap showing the z score of the pathways with statistically significant differences in the CD4+ T cell clusters at 3-month (n = 7 teplizumab, n = 7 placebo) and 18-month visit (n = 7 teplizumab, n = 6 placebo). The pathways were inferred based on the differentially expressed genes (DEGs) between teplizumab and placebo groups and selected based on adjusted P < 0.05 by IPA software. Blue scale denotes grades of prediction of lower enrichment, while red scale indicates higher enrichment of the pathways based on the z score. (D and E) Volcano plot visualization of the DEGs in teplizumab versus placebo in the CD4+ T cells at 3 months (D) and 18 months (E). The dashed lines identify average log2 fold change (log2FC) ≥ |0.2| and adjusted P value < 0.05. (F) Heatmap showing the z score of the pathways with statistically significant differences in the CD4+ T cell clusters at 18 months in the teplizumab group (n = 3 responders, n = 4 non-responders). The pathways were inferred based on the DEGs between responder and non-responder individuals and selected based on adjusted P < 0.05 by IPA software. Blue scale denotes grades of prediction of lower enrichment, while red scale indicates higher enrichment of the pathways based on the z score. (G and H) Volcano plot visualization of the DEGs in responders versus non-responders in the CD4+ T cells at 3 months (G) and 18 months (H). The dashed lines identify average log2FC ≥ |0.2| and adjusted P value < 0.05.
Figure 3
Figure 3. Changes across time in CD8+ T cells after teplizumab treatment.
(A and B) 2D UMAP visualization of CD8+ cells at 18 months. Points represent individual cells, and colors denote treatment arm (A) and clusters (B) as labeled (n = 7 teplizumab, n = 6 placebo). EM, effector memory. (C) Heatmap showing z score of pathways with statistically significant differences in the CD8+ T cell clusters at 3 months (n = 7 teplizumab, n = 7 placebo) and 18 months (n = 7 teplizumab, n = 6 placebo). The pathways were inferred based on the DEGs between teplizumab and placebo groups and selected based on adjusted P < 0.05 by IPA software. Blue scale denotes grades of prediction of lower enrichment, while red scale indicates higher enrichment of pathways based on the z score. (D) GSEA of the total CD8+ effector T cell cluster in teplizumab versus placebo DEGs at 3 months with enrichment in genes belonging to PD-1 signaling (enrichment score [ES] = 0.79, P = 0.003), CTLA4 signaling (ES = 0.75, P = 0.007), IFN-γ response (ES = 0.08, P < 0.001), and IFN signaling (ES = 0.60, P = 0.02). (E) GSEA of total CD8+ T cell cluster in teplizumab versus placebo DEGs at 18 months with less enrichment in genes belonging to IFN-γ response (ES = –0.4, P = 0.001) and INF-α response (ES = –0.48, P = 0.01) and higher enrichment in TGF-β signaling (ES = 0.8, P = 0.003). (F) Violin plot representing average expression of EOMES in CD8+ T cells at 3 months in teplizumab (n = 7) and placebo (n = 7) (P < 0.05) and the number of CD8+ T cells expressing EOMES at 18 months in teplizumab (n = 7) and placebo (n = 6) (P < 0.05). (G and H) Volcano plot visualization of DEGs in teplizumab versus placebo in CD8+ T cells at 3 months (n = 7 teplizumab, n = 7 placebo) (G) and 18 months (n = 7 teplizumab, n = 6 placebo) (H). The dashed lines identify average log2FC ≥ |0.2| and adjusted P value < 0.05.
Figure 4
Figure 4. Changes across time in CD8+ T cells after teplizumab treatment in responders versus non-responders.
(A) Volcano plot visualization of the DEGs in responders versus non-responders in CD8+ T cells at 3 months (n = 3 responders, n = 4 non-responders). The dashed lines identify average log2FC ≥ |0.2| and adjusted P value < 0.05. (B and C) Heatmap showing the z score of the pathways with statistically significant differences in the CD8+ effector and CD8+ T cell clusters at 18-month visit in the teplizumab group (n = 3 responders, n = 4 non-responders). The pathways were inferred based on the DEGs between responder and non-responder individuals and selected based on adjusted P < 0.05 by IPA software. Blue scale denotes grades of prediction of lower enrichment, while red scale indicates higher enrichment of the pathways based on the z score. (D) Volcano plot visualization of the DEGs in responders versus non-responders in CD8+ T cells at 18 months (n = 3 responders, n = 4 non-responders). The dashed lines identify average log2FC ≥ |0.2| and adjusted P value < 0.05.
Figure 5
Figure 5. Cellular signatures and responses after teplizumab.
(A) Volcano plot visualization of the DEGs in teplizumab versus placebo at 3 months (n = 10 teplizumab, n = 3 placebo) from bulk RNA-Seq. The dashed lines identify average log2FC ≥ |0.2| and P value < 0.05. (B and C) Bubble plots showing the z score and P values of the pathways with statistically significant differences in the teplizumab versus placebo groups at 3 months (n = 10 teplizumab, n = 3 placebo) (B) and in responders versus non-responders (n = 6 non-responders, n = 4 responders) in the teplizumab group at 3 months (C). (D) Volcano plot visualization of the DEGs in responders versus non-responders at 3 months from bulk RNA-Seq (n = 6 non-responders, n = 4 responders). The dashed lines identify average log2FC ≥ |0.2| and P value < 0.05. (E) Volcano plot visualization of the DEGs in teplizumab versus placebo at 3 months (n = 10 teplizumab, n = 3 placebo) and at 18 months (n = 2 teplizumab, n = 3 placebo) from bulk RNA-Seq. The dashed lines identify average log2FC ≥ |0.2| and P value < 0.05.
Figure 6
Figure 6. CD127 expression levels predict response to teplizumab.
(AC) Flow cytometry data of TN10 trial showing the difference in the MFI of CD127+ EMRA CD8+ T cells (TEMRA CD8+ T cells) (A), MFI CD127+ CM CD8+ T cells (B), and percentages of CD127+ CM CD8+ T cells (C) between teplizumab and placebo at different time points (*P < 0.05, **P < 0.01, n = 38 teplizumab, 28 placebo). The means + SEM from the mixed model are shown. (D) Kaplan Meier curves showing the difference between the median time to onset of T1D in teplizumab-treated patients with values above or below the median of the MFI of CD127 on TEMRA CD8+ cells in the placebo-treated patients at 3 months. The median times to stage 3 T1D were 83.2 months in the teplizumab-treated patients with MFI CD127 on CD8+ TEMRA cells below the median (n = 25) and 24.5 months for those above the median (n = 8) (log-rank P = 0.046). (E) The same comparison based on the median MFI of CD127 on CD8+ TEMRA cells in teplizumab-treated patients at 18 months. The median times to stage 3 T1D are 83.2 months with MFI below the median (n = 26) and 42.6 months with values below the median (n = 6) (log-rank P = 0.017). (F) Cox regression model showing the association between the time to diagnosis with stage 3 T1D based on a quantitative measure of the MFI of CD127 on TEMRA CD8+ cells in the teplizumab-treated group at 3 months (n = 32) (P = 0.05).
Figure 7
Figure 7. Pseudotime analysis of CD8+ T cells in the TN10 trial at 18 months.
(A and B) 2D UMAPs showing the pseudotime analysis of CD8+ T cells in the teplizumab and placebo groups at 18 months (n = 7 teplizumab, n = 6 placebo). Cells are colored based on the pseudotime values. (C and D) Gene expression dynamics across the pseudotime in the teplizumab and placebo groups in the exhausted and memory-2 branches of differentiation (n = 7 teplizumab, n = 6 placebo).
Figure 8
Figure 8. Effects of teplizumab treatment on antigen-reactive CD8+ T cells.
(A) Schematic experiment design for the T cell libraries. (B and C) CD8+ T cell library analysis of antigen-specific T cells. Total antigen-reactive wells from libraries of CD45RA+ (B) or CD45RO+ (C) T cells from teplizumab-treated (n = 10) and placebo-treated (n = 12) patients (*P = 0.025 by repeated-measures ANOVA with correction for the baseline). (DG) Analysis of frequency of library wells reactive to each of the peptides used in the CD8+ T cell libraries: CD45RO+ ZnT8-reactive CD8+ T cells (D), CD45RO+ PPI15-reactive CD8+ T cells (E), CD45RO+ GAD65-reactive CD8+ T cells (F), and CD45RO+ EBV-reactive CD8+ T cells (G) from teplizumab-treated (n = 10) and placebo-treated (n = 12) individuals (*P < 0.05, **P < 0.01 by repeated-measures ANOVA with correction for the baseline). Mean ± SEM from the mixed model is shown.

Similar articles

Cited by

References

    1. Herold KC, et al. An anti-CD3 antibody, teplizumab, in relatives at risk for type 1 diabetes. N Engl J Med. 2019;381(7):603–613. doi: 10.1056/NEJMoa1902226. - DOI - PMC - PubMed
    1. Long SA, et al. Partial exhaustion of CD8 T cells and clinical response to teplizumab in new-onset type 1 diabetes. Sci Immunol. 2016;1(5):eaai7793. doi: 10.1126/sciimmunol.aai7793. - DOI - PMC - PubMed
    1. Perdigoto AL, et al. Treatment of type 1 diabetes with teplizumab: clinical and immunological follow-up after 7 years from diagnosis. Diabetologia. 2019;62(4):655–664. doi: 10.1007/s00125-018-4786-9. - DOI - PMC - PubMed
    1. Herold KC, et al. Teplizumab (anti-CD3 mAb) treatment preserves C-peptide responses in patients with new-onset type 1 diabetes in a randomized controlled trial: metabolic and immunologic features at baseline identify a subgroup of responders. Diabetes. 2013;62(11):3766–3774. doi: 10.2337/db13-0345. - DOI - PMC - PubMed
    1. Herold KC, et al. Anti-CD3 monoclonal antibody in new-onset type 1 diabetes mellitus. N Engl J Med. 2002;346(22):1692–1698. doi: 10.1056/NEJMoa012864. - DOI - PubMed

Publication types

Substances

Associated data