. 2024 Aug 13;134(19):e177413.
doi: 10.1172/JCI177413.

Pediatric glioma immune profiling identifies TIM3 as a therapeutic target in BRAF fusion pilocytic astrocytoma

Affiliations

Pediatric glioma immune profiling identifies TIM3 as a therapeutic target in BRAF fusion pilocytic astrocytoma

Shashwat Tripathi et al. J Clin Invest. .

Abstract

Despite being the leading cause of cancer-related childhood mortality, pediatric gliomas have been relatively understudied, and the repurposing of immunotherapies has not been successful. Whole-transcriptome sequencing, single-cell sequencing, and sequential multiplex immunofluorescence were used to identify an immunotherapeutic strategy that could be applied to multiple preclinical glioma models. MAPK-driven pediatric gliomas have a higher IFN signature relative to other molecular subgroups. Single-cell sequencing identified an activated and cytotoxic microglia (MG) population designated MG-Act in BRAF-fused, MAPK-activated pilocytic astrocytoma (PA), but not in high-grade gliomas or normal brain. T cell immunoglobulin and mucin domain 3 (TIM3) was expressed on MG-Act and on the myeloid cells lining the tumor vasculature but not normal brain vasculature. TIM3 expression became upregulated on immune cells in the PA microenvironment, and anti-TIM3 reprogrammed ex vivo immune cells from human PAs to a proinflammatory cytotoxic phenotype. In a genetically engineered murine model of MAPK-driven, low-grade gliomas, anti-TIM3 treatment increased median survival over IgG- and anti-PD-1-treated mice. Single-cell RNA-Seq data during the therapeutic window of anti-TIM3 revealed enrichment of the MG-Act population. The therapeutic activity of anti-TIM3 was abrogated in mice on the CX3CR1 MG-KO background. These data support the use of anti-TIM3 in clinical trials of pediatric low-grade, MAPK-driven gliomas.

Keywords: Brain cancer; Cancer immunotherapy; Immunology; Oncology.


Conflict of interest statement

Conflict of interest: ABH serves on the advisory boards of WCG Oncology and Caris Life Sciences and receives research support from Moleculin, AbbVie, and Alnylam.

Figures

Figure 1
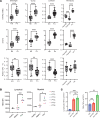
Figure 1. Estimated immune cell fractions in pediatric gliomas based on RNA deconvolution.
n = 91 IDH-MT; n = 24 IDH-WT HG; n = 39 H3F3A; n = 96 MAPK-driven. Bulk RNA-Seq immune marker signatures of pediatric glioma molecular groups. The box indicates the median, 25%, and 75% percentiles. Whiskers extend to the minimum and maximum. Data indicate the mean ± SEM. **P < 0.01 and ***P < 0.001, by unpaired Student’s t test with 2-stage step-up method (with Benjamini correction).
Figure 2
Figure 2. Inflammatory TME present in BRAF fusion PA.
(A) Schematic diagram of the workflow associated with orthogonal analyses of pediatric gliomas (created with BioRender.com). (B) UMAP plot of glioma-infiltrating immune cells analyzed with scRNA-Seq across 16 patients (n = 13 BRAF fusion PAs; n = 3 ANBs). (C) Dot plot of selected immune marker genes within the general immune cell populations. Bubble size corresponds to the percentage of cells expressing a gene marker; colors indicate average (Avg.) expression. (D) scRNA-Seq UMAP plot of the intratumoral myeloid cells shown in brown in B. (E) scRNA-Seq UMAP plot of the intratumoral lymphoid cells shown in purple in B. (F) Dot plot of immune marker genes within the myeloid subtypes (including the MG-Act cell population from E) characterized on the basis of 4 distinct immunological functions: cytotoxicity, immune suppression, antigen-presenting cell (APC), and phagocytosis. Bubble size corresponds to the percentage of cells expressing the gene and colors indicate average expression. (G) Dot plot of immune marker genes of the cell clusters shown in E, broken into the 4 distinct immunological functions: cytotoxicity, immune suppression, APC, and phagocytosis. Bubble size corresponds to the percentage of cells expressing a gene marker; colors indicate average expression.
Figure 3
Figure 3. Spatial analysis of TME in BRAF fusion PA.
(A) Strip plot showing the differential abundance of the MG-Act cell population between PA versus ANB and PA versus HGG by log (fold change [FC]). Cell types with a value of 0.1 or less are colored otherwise in gray. (B) Multiplex immunofluorescence imaging of the spatial distribution of TIM3 expression in BRAF fusion PA relative to ANB. Scale bar: 500 μm. (C) Higher-magnification image from the tumor and (D) image from the ANB. Scale bar: 100 μm. (E) Histogram of the percentage of TIM3+ cells based on anatomical location (n = 8 PAs; n = 3 ANBs). Each symbol represents a patient specimen. Data indicate the mean ± SEM. ***P < 0.001, by 2-tailed Student’s t test. (F) Histogram of the percentage of TIM3+ cells that coexpressed CD11c+, P2RY12+, CD163+, GFAP+, or CD3+ in PAs (n = 8). Data indicate the mean ± SEM. (G) Representative image of CD163+ macrophages lining the vessel walls of a BRAF fusion PA (left panel) and expressing TIM3 (right panel). Scale bar: 100 μm. (H) Representative image of the P2RY12+CD3+NKG7+ MG-Act cell population within the TME of PAs (n = 8). Scale bar: 20 μm. (I) Histogram of the percentage of MG-Act cells between ANBs (n = 3) and PAs (n = 8). Data indicate the mean ± SEM. *P < 0.05 and **P < 0.01, by 2-tailed Student’s t test.
Figure 4
Figure 4. TIM3 is upregulated in TICs compared with matched PBMCs.
(A) Comparison of HAVCR2 (TIM3), STAT3, and PDCD1 (PD-1) mRNA expression in PA and ANB samples. Data were extracted from GlioVis. mRNA expression (log2) of selected gene markers is shown. Full data are available in Supplemental Figure 4. **P < 0.01 and ****P < 0.0001, by Student’s t test or 1-way ANOVA with Tukey’s multiple-comparison test for Henriquez. (B) TIM3 MFI values for matched TICs and PBMCs from patients with BRAF fusion PA (n = 6) relative to healthy controls (n = 3). *P < 0.05 and ***P < 0.0001, by 2-tailed, paired Student’s t test. (C) Ratio of TNF-α+ to p-STAT3+ lymphocytes and myeloid cells after 48 hours of treatment ex vivo with either IgG, anti-TIM3, or anti–PD-1 in ex vivo PA samples (n = 3). **P < 0.01 and ***P < 0.001, by 1- way ANOVA with Tukey’s multiple-comparison test. Data indicate the mean ± SEM.
Figure 5
Figure 5. Anti-TIM3 effectively reprograms the immune environment.
(A) Immunocompetent GEMM were treated with anti-TIM3 (300 μg/mouse) or IgG (100 μg/mouse) once per week or anti–PD-1 (200 μg/mouse) 3 times per week starting at day 28. (B) Histological evaluation of the GEMM displaying features of a low-grade glioma such as a loose microcystic pattern. Scale bar: 100 μm. (C) H&E-stained images demonstrating heterogeneity in a region of greater cellular density. Scale bar: 100 μm. (D) H&E-stained image demonstrating that glioma cells were monotonous and lacked mitosis (higher magnification of the image in C). (E) H&E-stained image demonstrating perineuronal satellitosis at infiltrating edges of the tumors. Scale bar: 100 μm (B and C) and 50 μm (D and E). (F) Immunofluorescence imaging of TIM3 expression on MG in the GEMM (n = 4). GFAP: purple; P2RY12: green; TIM3: yellow. (G) Immunofluorescence imaging p-ERK1/2 expression in the GEMM (n = 4). GFAP: purple; p-ERK: white. Scale bar: 50 μm (F and G). (H) Survival of low-grade glioma GEMM mice using Kaplan-Meier analysis. IgG: n = 20 mice (median survival [MS]: 110.5 days), anti–PD-1: n = 20 mice (MS: 134.5 days), anti-TIM3: n = 21 mice (MS: 253 days). Statistics (log-rank test): control versus anti–PD-1, P = 0.64; control versus anti-TIM3, P < 0.01; anti-TIM3 versus anti–PD-1, P = 0.02. (I) Survival of low-grade glioma CX3CR1-KO GEMM mice using Kaplan-Meier analysis. IgG: n = 20 mice (MS: 121 days), anti-TIM3: n = 28 mice (MS: 129.5 days). P = 0.51, by log-rank test for control versus anti-TIM3. (J) Representative immunofluorescence imaging of brains from the murine LGG model. Tumors were demarcated using H&E by a neuropathologist. Scale bar: 100 μm. (K) scRNA-Seq UMAP plot of the myeloid cells. n = 3 per group. (L) scRNA-Seq UMAP plot of the lymphoid cells. (M) Strip plot showing the differential abundance of cell types in the WT GEMM with treatment, log2 FC. Cell types with a P value of 0.1 or less are shown in gray. Cell types were ranked by the mean log2 FC of anti-TIM3 versus IgG. MG-Homo, MG-homeostatic; MG-Inflam, inflammatory MG; MG-Phago, phagocytic MG; Mono, monocytes.

References

    1. Ostrom QT, et al. CBTRUS statistical report: primary brain and other central nervous system tumors diagnosed in the United States in 2016-2020. Neuro Oncol. 2023;25(12 suppl 2):iv1–iv99. doi: 10.1093/neuonc/noad149. - DOI - PMC - PubMed
    1. Petralia F, et al. Integrated proteogenomic characterization across major histological types of pediatric brain cancer. Cell. 2020;183(7):1962–1985. doi: 10.1016/j.cell.2020.10.044. - DOI - PMC - PubMed
    1. Robinson MH, et al. Subtype and grade-dependent spatial heterogeneity of T-cell infiltration in pediatric glioma. J Immunother Cancer. 2020;8(2):e001066. doi: 10.1136/jitc-2020-001066. - DOI - PMC - PubMed
    1. Haberthur K, et al. NKG2D ligand expression in pediatric brain tumors. Cancer Biol Ther. 2016;17(12):1253–1265. doi: 10.1080/15384047.2016.1250047. - DOI - PMC - PubMed
    1. Glass R, Synowitz M. CNS macrophages and peripheral myeloid cells in brain tumours. Acta Neuropathol. 2014;128(3):347–362. doi: 10.1007/s00401-014-1274-2. - DOI - PubMed

MeSH terms