. 2025 Jan 13;15(1):202-226.
doi: 10.1158/2159-8290.CD-24-0287.

Neuro-Mesenchymal Interaction Mediated by a β2-Adrenergic Nerve Growth Factor Feedforward Loop Promotes Colorectal Cancer Progression

Affiliations

Neuro-Mesenchymal Interaction Mediated by a β2-Adrenergic Nerve Growth Factor Feedforward Loop Promotes Colorectal Cancer Progression

Hiroki Kobayashi et al. Cancer Discov. .

Abstract

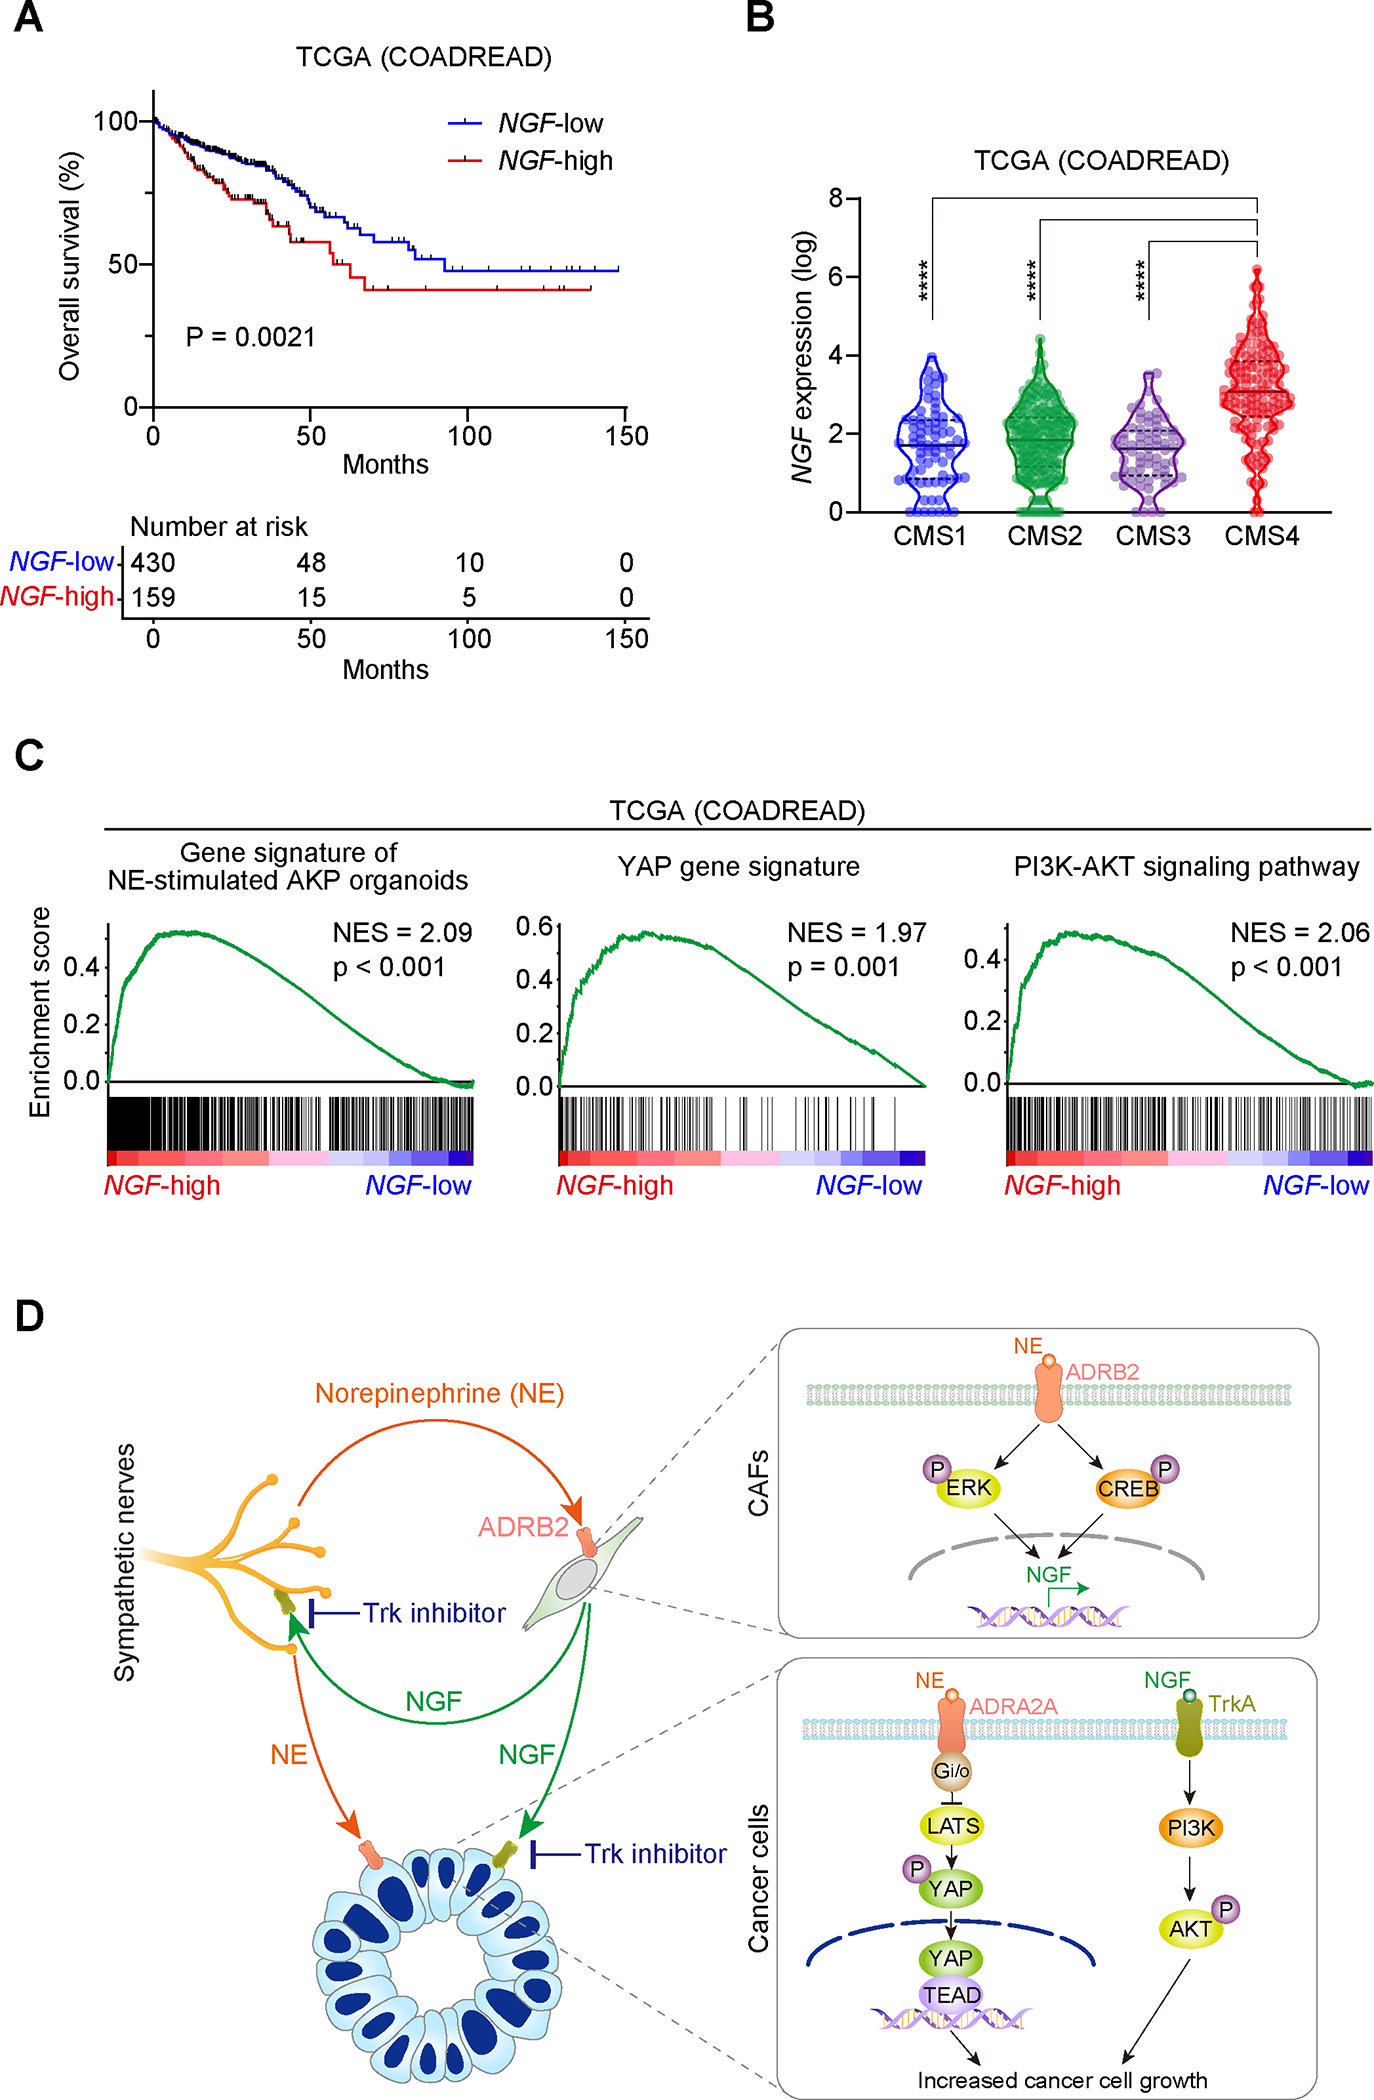
Abstract: Cancer-associated fibroblasts (CAF) and nerves, components of the tumor microenvironment, have each been shown to directly promote gastrointestinal cancers. However, it remains unknown whether these cells interact with each other to regulate cancer progression. We found that in colorectal cancer, norepinephrine induces ADRB2 (β2-adrenergic receptor)–dependent nerve growth factor (NGF) secretion from CAFs, which in turn increases intratumor sympathetic innervation and norepinephrine accumulation. Adrenergic stimulation accelerates colorectal cancer growth through ADRA2A/Gi-mediated activation of Yes-associated protein (YAP). NGF from CAFs directly enhances colorectal cancer cell growth via the phosphatidylinositol-3-kinase/AKT pathway. Treatment with a tropomyosin receptor kinase (TRK) inhibitor decreased YAP and AKT activation and colorectal cancer progression in mice. In human colorectal cancer, high NGF expression is associated with mesenchymal-like tumor subtype and poor patient survival. These findings suggest a central role for reciprocal CAF–nerve cross-talk in promoting colorectal cancer progression. Blocking this feedforward loop with a TRK inhibitor may represent a potential therapeutic approach for colorectal cancer.

Significance: Our work demonstrates that the bidirectional interplay between sympathetic nerves and NGF-expressing CAFs drives colorectal tumorigenesis. This study also offers novel mechanistic insights into catecholamine action in colorectal cancer. Inhibiting the neuro-mesenchymal interaction by TRK blockade could be a potential strategy for treating colorectal cancer.


Conflict of interest statement

Disclosures:

The authors declare no potential conflicts of interest.

Figures

Figure 1:
Figure 1:. Stromal NGF and sympathetic nerve density are elevated during human and mouse colorectal carcinogenesis.
(A) Dot plots depict the expression of neurotrophins in each cell type from human CRC tissues. Single-cell RNA-seq (scRNA-seq) data from primary human CRC tissues (GSE132465) (26) were analyzed. Cell type annotation from the original paper (26) was used. n = 47285 single cells in total, including 124 Stromal 3 fibroblasts, from 23 patients. Stromal cells (n = 1945 cells) were defined as Stromal 1–3 fibroblasts, myofibroblasts, pericytes, and smooth muscle cells. The red dotted rectangle denotes nerve growth factor (NGF) expression in the Stromal 3 fibroblast cluster in human CRC tissues. CMS, consensus molecular subtype; EC, endothelial cells; cDC, conventional dendritic cells; NK, natural killer. (B) Violin plots show NGF expression in each cell type from primary human CRC and normal colon tissues. ScRNA-seq data from primary human CRC and normal colon tissues (GSE132465) (26) were analyzed. n = 47285 single cells in total (including 1945 stromal cells) from CRC tissues (n = 23 patients). n = 16404 single cells in total (including 2176 stromal cells) from normal colon tissues (n = 10 patients). TA, transit amplifying cells. (C) In situ hybridization for NGF using human normal colon and CRC tissue sections. Representative pictures (left) and quantification of 3,3’-diaminobenzidine (DAB)-positive areas (right). Red arrowheads denote NGF expression in the stromal areas. Green dotted lines indicate borders between Stromal (S) and Epithelial (E) areas. Colorectal adenocarcinoma and normal non-neoplastic colon areas from 6 patients were evaluated. A.U., arbitrary units. (D) Immunohistochemistry (IHC) for tyrosine hydroxylase (TH) using human normal colon and colorectal cancer tissues. Red arrowheads indicate TH+ sympathetic nerves in CRC tissues. The graph shows the average value of TH+ areas in the tumor core (TC) and invasive margin (IM) for each patient, represented as a red dot. For separate quantification of TH+ areas in the tumor core and margin, see Supplementary Fig. S1C. n = 6 patients. (E-G) Ngf expression in mouse CRC tissues and normal control tissues. AKP tumors (ApcΔ/Δ, KrasG12D/Δ, and Trp53Δ/Δ mouse CRC organoids) were orthotopically transplanted into the rectum to generate a mouse model of CRC. The CRC tissues were collected 14 days after rectal injection of AKP tumor organoids. (E) Quantitative reverse transcription polymerase chain reaction (qRT-PCR) for neurotrophins using bulk tumor tissues and adjacent normal colorectal tissues. n = 3 mice each. (F) Fluorescence in situ hybridization (FISH) for Ngf. Tissue sections from rectally injected AKP tumors and control colorectums from uninjected mice were used. Green arrowheads denote Ngf ISH signals in tumor tissue sections. n = 3–4 mice each. (G) AKP tumor organoids were injected into the rectum of Lepr-Cre; Rosa26 (R26)-tdTomato mice, and Ngf FISH and co-immunofluorescence (IF) for ACTA2 and tdTomato were performed. Yellow arrowheads denote Ngf expression in tdTomato +ACTA2+ cells. The ratio of ACTA2+ cells in total Ngf+ cells (left) and the ratio of ACTA2+tdTomato+ cells in total Ngf+ cells (right) are shown. n = 3 mice. (H) Immunohistochemistry for tyrosine hydroxylase using AKP tumor tissues and the control colorectums from uninjected mice. Red arrowheads indicate TH+ sympathetic nerves in AKP tumor tissues. The CRC tissues were collected 14 days after rectal injection of AKP tumor cells. n = 3–4 mice each. Wilcoxon rank-sum test (B) and two-tailed unpaired Student’s t-test (C-F and H). In all figures, asterisks denote the following P-values. ****, P-value < 0.0001; ***, P-value of 0.0001 to 0.001; **, P-value of 0.001 to 0.01; *, P-value of 0.01 to 0.05; ns, P-value ≥ 0.05. Mean ± s.e.m (standard error of the mean). Scale bars, 50 μm.
Figure 2:
Figure 2:. Adrenergic stimulation induces fibroblast CREB/ERK activation and NGF upregulation via the β2 adrenergic receptor and promotes sympathetic innervation and CRC growth.
(A) Human colon CAFs (CAF05) were co-treated with norepinephrine and adrenergic receptor antagonists for 24 hours. qRT-PCR for NGF was performed. Norepinephrine, 10 μM; Prazosin, 5 μM; Yohimbine, 25 μM; Atenolol, 25 μM; ICI118,551, 25 μM; SR59230A, 5 μM; Clenbuterol, 10 μM. n = 3 independent replicates each. (B, C) Western blotting (B) and qRT-PCR for NGF (C) using drug-treated CAF05. NE, Norepinephrine (10 μM). ICI, ICI118,551 (β2 antagonist; 25 μM). KT, KT5720 (Protein Kinase A inhibitor; 1 μM). Tram, Trametinib (MEK inhibitor; 100 nM). ISO, Isoproterenol (non-selective β agonist; 50 nM). P-, Phosphorylated. T-, Total. n = 3 independent replicates each. (D) Experimental schematic depicting conditioned medium transfer from vehicle-, NE-, or NE+ICI-treated CAF05 to the mouse celiac ganglion explant. CAF05 cells were treated with the drugs for 3 days, and the conditioned medium was collected. The celiac ganglion tissues were isolated from mice, embedded in Matrigel, and cultured in the CAF-conditioned medium for 3 days. gRNA, guide RNA. NE, 10 μM. ICI, 25 μM. (E) Neurite outgrowth of celiac ganglia treated with CAF-conditioned medium. Red arrowheads denote neurite outgrowth from the celiac ganglion treated with conditioned medium from NE-treated CAFs. Bright-field grayscale images were inverted to help visualize the neurite structures. The sum of the length of neurites extending from the celiac ganglion was quantified. n = 3 mice each. (F) Experimental scheme showing rectal injection of AKP tumor organoids that express luciferase. ISO, isoproterenol (10 mg/kg/day); ICI, ICI118,551 (0.5 mg/kg/day). cKO, conditional knockout; IVIS, in vivo imaging system. (G) Kaplan-Meier survival curves. n = 9–10 mice each. (H) Tumor-derived luciferase signals were assessed by in vivo imaging. n = 9–10 mice per group. Radiance, photons/sec/cm2/steradian. (I) Co-Immunofluorescence for phosphorylated CREB (P-CREB) and ACTA2 (left) and for phosphorylated ERK (P-ERK) and ACTA2 (right). Red arrowheads indicate P-CREB+ACTA2+ cells (left) and P-ERK+ACTA2+ cells (right). n = 6 mice each. (J) qRT-PCR for Ngf using bulk tumor tissues. n = 3–4 mice each. (K) Immunohistochemistry (IHC) for tyrosine hydroxylase (TH). Red arrowheads denote TH+ nerves. n = 6 mice each. One-way ANOVA (analysis of variance) followed by Tukey’s post-hoc multiple comparison tests (A, C, and I-K), two-way ANOVA followed by Tukey’s post-hoc multiple comparison tests (E), log-rank test (G), and two-way repeated-measures ANOVA with post-hoc Sidak’s multiple comparison test at Week 2 (H). Mean ± s.e.m. Scale bars, 50 μm (E, I, and K) and 100 μm (F).
Figure 3:
Figure 3:. Adrenergic stimulation increases AKP colon cancer cell growth through ADRA2/Gi protein-mediated activation of YAP signaling.
(A) Luciferase-expressing AKP tumor organoids were co-treated with norepinephrine and adrenergic receptor inhibitors for 72 hours. Organoid areas and numbers were quantified (left). Representative pictures (right). Norepinephrine, 10 μM; Prazosin, 5 μM; Yohimbine, 25 μM; Atenolol, 25 μM; ICI118,551, 25 μM; SR59230A, 5 μM. Parental AKP organoids that do not express Cas9 or gRNA were used in (A)-(C) and (F)-(I). n = 4 independent replicates each. Scale bar, 200 μm. (B and C) Bulk-RNA sequencing of norepinephrine (10 μM)- or vehicle-treated AKP tumor organoids was performed. n = 4 independent replicates each. (B) Volcano plot depicts differentially expressed genes. Gray dotted lines indicate a log2 fold change of 1 and a p-value of 0.05. (C) Gene set enrichment analysis of the YAP gene signature (39). Normalized enrichment score (NES) and false delivery rate (FDR)-adjusted P-values are reported. (D) Western blotting shows de-phosphorylation of LATS1 and YAP by norepinephrine (NE) or dexmedetomidine (DEX) treatment of AKP tumor cells. Red-dotted rectangles denote decreased phosphorylation of LATS1 and YAP by NE or DEX treatment. NE, 10 μM; YOH, 25 μM; PTX (pertussis toxin; Gi inhibitor), 100 ng/mL; DEX, 10 μM. (E) Cleavage Under Targets & Release Using Nuclease (CUT&RUN) using TEAD and control IgG antibodies, followed by q-PCR for the promoter regions of YAP target genes. AKP tumor organoids were treated with the drugs for 24 hours. VP, verteporfin (YAP inhibitor, 0.5 μM). n = 3 independent replicates each. (F) Experimental scheme showing rectal injection of AKP tumor organoids and the following Yohimbine (YOH) treatment. Mice were intraperitoneally injected with Yohimbine (0.1 mg/kg/day) or vehicle daily. Scale bar, 100 μm. (G) Kaplan-Meier survival curves. n = 9 (vehicle) and 10 mice (Yohimbine group) (H) Tumor-derived luciferase signals were assessed by in vivo imaging. n = 9 (vehicle) and 10 mice (Yohimbine group) (I) Immunohistochemistry for non-phosphorylated YAP. n = 3 mice each. Scale bars, 50 μm. One-way ANOVA followed by Tukey’s post-hoc multiple comparison tests (A), two-way ANOVA followed by Tukey’s post-hoc multiple comparison tests (E), log-rank test (G), two-way repeated-measures ANOVA with post-hoc Sidak’s multiple comparison test at Week 3 (H), and two-tailed unpaired Student’s t-test (I). Mean ± s.e.m.
Figure 4:
Figure 4:. Stromal NGF increases sympathetic innervation and YAP activation to promote CRC growth.
(A) Experimental scheme showing injection of AKP tumor organoids into the rectum of Lepr-Cre (+); Rosa26-NGF and control Lepr-Cre (−); Rosa26-NGF mice. Note that 1 × 10⁵ AKP tumor cells/mouse were injected into the rectum of Lepr-Cre (+) or (−); Rosa26-NGF mice, whereas in all other orthotopic transplantation experiments in this study, 5 × 10⁵ AKP tumor cells/mouse were injected into the mouse rectum. (B) Kaplan-Meier survival curves n = 6 mice each. (C) Tumor-derived luciferase signals were assessed by in vivo imaging. n = 6 mice each. (D and E) Immunohistochemistry (IHC) for tyrosine hydroxylase (TH; D) and non-phosphorylated YAP (E). Red arrowheads denote the TH+ sympathetic nerves. n = 6 Lepr-Cre (−); Rosa26-NGF and 4 Lepr-Cre (+); Rosa26-NGF mice. (F) Experimental protocol depicting injection of AKP tumor organoids into the rectum of Lepr-Cre (+); Rosa26-iDTR/tdTomato and control Lepr-Cre (+); Rosa26-WT (wild type)/tdTomato mice. Diphtheria toxin (DT; 100 ng per mouse) was intraperitoneally administered to each mouse every three days. Dexmedetomidine (DEX, α2 agonist; 10 ug/kg/day) or vehicle was intraperitoneally injected daily. (G) Kaplan-Meier survival curves n = 5–7 mice each. (H) Tumor-derived luciferase signals were measured using in vivo imaging. n = 5–7 mice each. (I) qRT-PCR for Ngf using bulk tumor tissues. n = 3 mice each. (J and K) Immunohistochemistry for TH (J) and non-phosphorylated YAP (K). n = 4–5 mice each. Scale bars, 100 μm (A and F), 25 μm (D and J), and 50 μm (E and K) Log-rank test (B and G), two-way repeated-measures ANOVA with post-hoc Sidak’s multiple comparison test at Week 2 (C and H), two-tailed unpaired Student’s t-test (D and E), and one-way ANOVA followed by Tukey’s post-hoc multiple comparison tests (I-K). Mean ± s.e.m.
Figure 5:
Figure 5:. NGF directly promotes colon cancer cell growth partly through TrkA-PI3K/AKT signaling.
(A) Experimental scheme. Conditioned medium from vehicle-, ISO-, or ISO+ICI-treated CAF05 cells was transferred to HT-29 human CRC cells. CAF05 cells were treated with the drugs for three days, and the conditioned medium was collected. HT-29 cells were cultured in CAF-conditioned medium with vehicle/Trk inhibitors for 3 days, and then the expansion of HT-29 cells was evaluated using the CellTiter-Glo assay. ISO (isoproterenol; non-selective β agonist), 50 nM; ICI (ICI118,551; selective β2 antagonist), 25 μM; Selitrectinib (TrkA and TrkC inhibitor), 1 μM; GW441756 (TrkA inhibitor), 10 μM. (B) ELISA for NGFβ using medium conditioned by drug-treated CAFs. n = 3 independent replicates each. (C) The CellTiter-Glo assay was performed to evaluate the expansion of HT-29 cells co-treated with CAF-conditioned medium and vehicle/Trk inhibitors. n = 3 independent replicates each. (D) HT-29 cells were treated with recombinant NGF (rNGF; 10 ng/mL), rNGF+Selitrectininb (1 μM), or rNGF+GW441756 (10 μM) for 48 hours, followed by the CellTiter-Glo assay. n = 3 independent replicates each. (E) Western blotting of HT-29 cells treated with vehicle, rNGF, rNGF+Trk inhibitors, or rNGF+Copanlisib (PI3K inhibitor; 10 nM). P-, phosphorylated. T-, total. (F) The CellTiter-Glo assay was performed to evaluate the expansion of HT-29 cells treated with vehicle, rNGF, or rNGF+Copanlisib (1 nM) for 48 hours. n = 4 independent replicates each. (G) Luciferase-expressing mouse AKP tumor organoids were co-treated with recombinant NGF and Trk inhibitors/vehicle for 72 hours. rNGF, 50 ng/mL; Selitrectinib, 1 μM; GW441756, 10 μM. The organoid area, number, and organoid-derived luciferase signal were measured. n = 4 independent replicates each. Scale bar, 200 μm. (H) AKP tumors were treated with recombinant NGF and Trk inhibitors / Copanlisib (10 nM), and western blotting was performed to evaluate the phosphorylation of AKT and ERK. (I) Luciferase signals from AKP tumors treated with the vehicle-, rNGF-, or rNGF + Copanlisib (1 nM) for 72 hours. n = 4 independent replicates each. (J-L) Immunohistochemistry for phosphorylated AKT (P-AKT) using AKP tumor tissues. For the experimental schemes of (J), (K), and (L), see Fig. 4A, 2F, and 4F, respectively. (J) n = 6 Lepr-Cre (−); R26-NGF and 4 Lepr-Cre (+); R26-NGF mice. (K) n = 6 mice each. (L) n = 4–5 mice each. Two-way ANOVA followed by Tukey’s post-hoc multiple comparison tests (B and C), one-way ANOVA followed by Tukey’s post-hoc multiple comparison tests (D, F, G, I, K, and L), and two-tailed unpaired Student’s t-test (J) Mean ± s.e.m
Figure 6:
Figure 6:. Trk blockade decreases sympathetic innervation and YAP activation and attenuates AKT phosphorylation to inhibit CRC growth in mouse models.
(A) Experimental schematic depicting injection of AKP tumor organoids into the mouse rectum and treatment with the Trk inhibitor selitrectinib. Mice were orally dosed selitrectinib (30/mg/kg/day) or vehicle. Scale bar, 100 μm. (B) Kaplan-Meier survival curves n = 10 mice each. (C) Tumor-derived luciferase signals were assessed by in vivo imaging. n = 10 mice each. (D and E) Immunohistochemistry (IHC) for tyrosine hydroxylase (TH), non-phosphorylated YAP, and phosphorylated AKT. n = 4 (vehicle) and 5 mice (selitrectinib group). Scale bars, 50 μm. (F) Experimental scheme showing selitrectinib treatment in a Cdx2-CreERT2; Apcflox/flox; KrasG12D mouse model of CRC. Mice were orally administered selitrectinib (30 mg/kg/day) or vehicle. TAM, tamoxifen. (G) Kaplan-Meier survival curves. n = 5 mice each. (H) The ratio of tumor areas in the whole colon areas was evaluated histologically using the swiss-rolled colons. Green areas denote tumor regions. n = 4 mice each. Scale bar, 2.0 mm. (I and J) Immunohistochemistry (IHC) for tyrosine hydroxylase (TH), non-phosphorylated YAP, and phosphorylated AKT. n = 4 mice each. Scale bars, 50 μm. In (H-J), all histopathological analyses were performed using mice harvested 14 days after tamoxifen injection. Log-rank test (B and G), two-way repeated-measures ANOVA with post-hoc Sidak’s multiple comparison test at Week 3 (C), and two-tailed unpaired Student’s t-test (D, E, and H-J). Mean ± s.e.m
Figure 7:
Figure 7:. In human CRC, high NGF expression is associated with poor patient outcomes, the mesenchymal-like tumor subtype, and enrichment for norepinephrine-responsive gene signature, YAP and AKT pathways.
(A) Kaplan-Meier survival analysis of 589 patients with CRC. The Cancer Genome Atlas (TCGA) bulk RNA-seq data from primary CRC tissues were analyzed. COADREAD, colon adenocarcinoma and rectal adenocarcinoma. (B) Violin plots depict NGF expression levels in the consensus molecular subtypes (CMS). n = 71 (CMS1), 209 (CMS2), 69 (CMS3), and 134 patients (CMS4). Solid black lines, median; Dotted black lines, quartiles. (C) Gene set enrichment analyses (GSEA) for gene signature of norepinephrine (NE)-stimulated AKP tumor organoids, YAP gene signature (39), and PI3K-AKT signaling pathway (MSiDB; M39736). The analyses were performed using NGF-high (n = 159) and NGF-low cancers (n = 430) in TCGA COADREAD data. The gene sets for NE-stimulated AKP organoids were defined using significantly upregulated genes in NE-treated AKP tumors in our RNA-seq data (Fig. 3D). Normalized enrichment score (NES) and false delivery rate (FDR)-adjusted P-values are shown. (D) Graphical summary of the role of neuro-mesenchymal interaction in CRC progression. Our work suggests that NGF secreted from CAFs promotes sympathetic innervation and norepinephrine accumulation, which in turn upregulates fibroblast NGF expression via the β2 adrenergic receptor. This feedforward loop further increases the accumulation of norepinephrine and NGF in the tumor microenvironment. Norepinephrine accelerates colorectal cancer cell growth through the ADRA2A/Gi-LATS-YAP-TEAD axis. CAF-derived NGF enhances cancer cell growth partly via the TrkA-PI3K-AKT pathway. Trk blockade inhibited the actions of neuro-mesenchymal interaction and restrained CRC progression in preclinical models. Targeting the nerve-CAF crosstalk by Trk inhibition may represent a promising therapeutic strategy to retard CRC progression. Log-rank test (A) and one-way ANOVA followed by Tukey’s post-hoc multiple comparison tests (B).

References

    1. Sahai E, Astsaturov I, Cukierman E, DeNardo DG, Egeblad M, Evans RM, et al. A framework for advancing our understanding of cancer-associated fibroblasts. Nat Rev Cancer 2020;20(3):174–86 doi 10.1038/s41568-019-0238-1. - DOI - PMC - PubMed
    1. Kobayashi H, Enomoto A, Woods SL, Burt AD, Takahashi M, Worthley DL. Cancer-associated fibroblasts in gastrointestinal cancer. Nat Rev Gastroenterol Hepatol 2019;16(5):282–95 doi 10.1038/s41575-019-0115-0. - DOI - PubMed
    1. Kobayashi H, Gieniec KA, Wright JA, Wang T, Asai N, Mizutani Y, et al. The Balance of Stromal BMP Signaling Mediated by GREM1 and ISLR Drives Colorectal Carcinogenesis. Gastroenterology 2021;160(4):1224–39 e30 doi 10.1053/j.gastro.2020.11.011. - DOI - PMC - PubMed
    1. Kobayashi H, Gieniec KA, Lannagan TRM, Wang T, Asai N, Mizutani Y, et al. The Origin and Contribution of Cancer-Associated Fibroblasts in Colorectal Carcinogenesis. Gastroenterology 2022;162(3):890–906 doi 10.1053/j.gastro.2021.11.037. - DOI - PMC - PubMed
    1. Winkler F, Venkatesh HS, Amit M, Batchelor T, Demir IE, Deneen B, et al. Cancer neuroscience: State of the field, emerging directions. Cell 2023;186(8):1689–707 doi 10.1016/j.cell.2023.02.002. - DOI - PMC - PubMed

MeSH terms