. 2024 Nov 1;73(11):1805-1820.
doi: 10.2337/db24-0240.

PAK3 Exacerbates Cardiac Lipotoxicity via SREBP1c in Obesity Cardiomyopathy

Affiliations

PAK3 Exacerbates Cardiac Lipotoxicity via SREBP1c in Obesity Cardiomyopathy

Xinyi Chen et al. Diabetes. .

Abstract

Obesity-induced lipid overload in cardiomyocytes contributes to profound oxidative stress and cardiomyopathy, culminating in heart failure. In this study, we investigate a novel mechanism whereby lipids accumulate in cardiomyocytes, and seek the relevant treatment strategies. P21-activated kinase 3 (PAK3) was elevated in obese human myocardium, and the murine hearts and cardiomyocytes upon diet- or fatty acid-induced stress, respectively. Mice with cardiac-specific overexpression of PAK3 were more susceptible to the development of cardiac dysfunction upon diet stress, at least partially, because of increased deposition of toxic lipids within the myocardium. Mechanistically, PAK3 promoted the nuclear expression of sterol regulatory element binding protein 1c (SREBP1c) through activation of mammalian target of rapamycin (mTOR) and ribosomal protein S6 kinase β-1 (S6K1) pathway in cardiomyocytes, resulting in abnormal lipid genes profile, accumulation of excessive lipids, and oxidative stress. More importantly, PAK3 knockdown attenuated fatty acid-induced lipotoxicity and cell death in rat and human cardiomyocytes. More importantly, the S6K1 or SREBP1c inhibitor alleviated PAK3-triggered intracellular lipid overload and cardiac dysfunction under obese stress. Collectively, we have demonstrated that PAK3 impairs myocardial lipid homeostasis, while inhibition of cardiac lipotoxicity mitigates cardiac dysfunction. Our study provides a promising therapeutic strategy for ameliorating obesity cardiomyopathy.


Conflict of interest statement

Duality of Interest. T.M.A.M holds equities at Tenaya Therapeutics. No other potential conflicts of interest relevant to this article were reported.

Figures

Figure 1
Figure 1
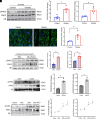
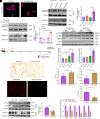
The increased PAK3 in the obese myocardium. A: Immunoblot and quantification of PAK3 protein expression and phosphorylation in human heart tissue (n = 5 biological replicates per group). B: Representative immunofluorescent staining images and quantification for PAK3 (green) in heart tissue (scale bar: 50 µm, DAPI as blue stained) (n = 3 biological replicates per group). C: Immunoblots and quantification of PAK3 expression and phosphorylation in the cultured human heart slices stressed with FAs (PAs and OAs, 500 µM) for 16 h (n = 6 individual experiments per group). D: Total and phosphorylated PAK3 protein expression in the heart tissue of lean and ob/ob mice (n = 3–4 biological replicates per group). E: Total and phosphorylated PAK3 in the myocardium from mice fed with HFD (n = 5–6 biological replicates per group). Data are presented as mean ± SEM. P < 0.05 (*) is determined by two-tailed Student t test in AD and by one-way ANOVA with Tukey correction in E.
Figure 2
Figure 2
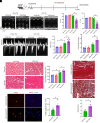
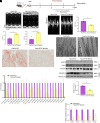
PAK3 overexpression contributes to pathological remodeling and cardiac dysfunction in response to obesity. A: Overview of experimental design on 8-week-old male C57BL/6 mice injected with AAV9-cTnT-Gfp or AAV9-cTnT-Pak3 followed by HFD feeding. B and C: Representative left ventricular M-mode echocardiographic images and the measurement of (B) FS%, EF%, and (C) IVRT 16 weeks postfeeding. D: Lactate dehydrogenase (LDH) in serum of the mice. E: Hematoxylin-eosin staining detecting cross-sectional area (scale bar: 20 µm). F: Masson trichrome staining of fibrosis in the heart (scale bar: 50 µm). G: Representative images and quantification of TUNEL staining (scale bar: 50 µm; arrows indicate the positive staining). n = 4–9 biological replicates per group. Data are presented as mean ± SEM. P < 0.05 (*) is determined by two-way ANOVA with Tukey correction in BE and by two-tailed Student t test in F and G.
Figure 3
Figure 3
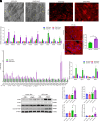
Overexpression of PAK3 provokes cardiac lipotoxicity under obesity. A: TEM detecting LDs (arrows) in the heart (scale bar: 2 μm). B: Immunofluorescent staining of PLIN2 (red) indicating lipid aggregation in PAK3-overexpressing myocardium after 16 weeks of HFD diet (scale bar: 10 µm). C: Quantitative PCR (qPCR) results of FA metabolism markers (n = 4–8 biological replicates). D: Selection of significantly increased toxic lipids (P < 0.05) due to PAK3 overexpression by lipidomic analyses of the heart tissue from HFD-fed mice (n = 4–9 biological replicates). E: Representative images and quantification of 4-hydroxynonenal (4-HNE) (red), a marker of lipid peroxidation, in the myocardium (scale bar: 10 µm) (n = 5 biological replicates). F: qPCR quantification of genes involved in oxidative response (n = 4–8 biological replicates). G: Immunoblots and quantification of antioxidative stress and lipid markers in the myocardium (n = 4–5 biological replicates). Data are presented as mean ± SEM. P values (# significant vs. chow diet; * significant vs. Gfp-HFD) is determined by two-tailed Student t test in E and two-way ANOVA with Tukey correction in C, F, and G.
Figure 4
Figure 4
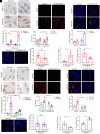
Active PAK3 leads to LD accumulation and cytotoxic effects in cardiomyocytes. Cells were infected with Ad-Pak3-T421E, an adenovirus carrying constitutively active (CA) PAK3 (AF) or Ad-Pak3-T421A, an adenovirus overexpressing kinase-dead (KD) PAK3 (GL), followed by stimulation of PAs and OAs, 500 μmol/L each for 4 h and 8 h, respectively. Representative images and quantification of Oil Red O staining (A), dihydroethidium (DHE) staining (B), and TUNEL staining (C) in neonatal rat cardiomyocytes (NRCMs). n = 3–10 individual experiments per group. (D) FAO (n = 4 individual experiments), (E) DAG amount, and (F) ATP from CA-PAK3 H9C2 under PA/OA for 4 h. n = 6 individual experiments per group. Representative images and quantification of Oil Red O staining (G), DHE staining (H), and TUNEL staining (I) in NRCMs. n = 4–10 individual experiments per group. (J) FAO (n = 4 individual experiments), (K) DAG amount, and (L) ATP from KD-PAK3 H9C2 under PA/OA for 8 h. n = 5 individual experiments per group. Scale bar: 20 μm. Data are presented as mean ± SEM. P < 0.05 (*) is calculated by two-way ANOVA with Tukey correction in AC and GI and by two-tailed Student t test in DF and JL.
Figure 5
Figure 5
PAK3 modulates SREBP1c action through the S6K1 pathway. A: Representative immunofluorescent staining images of nuclear SREBP1c in neonatal rat cardiomyocytes (NRCMs) infected with constitutively active PAK3 (Ad-Pak3-T421E) followed by PAs and OAs (500 μmol/L each) for 4 h (scale bar: 20 µm; arrows indicate nuclear localization). B: Immunoblots and quantification of full length SREBP1c in cytosol and cleaved SREBP1c in nuclei of PAK3 overexpressing NRCMs (n = 3 individual experiments). C: Immunoblots and quantification of SREBP1c in cytosol and nuclear fraction of the myocardium from mice, respectively (n = 4–5 individual experiments). D: Phosphorylation and total expression of mTOR and S6K1 in the myocardium (n = 4–5 individual experiments). E: Overview of experimental design for treatment of PF-4708671 in PAK3-overexpressing mice under HFD. F: FS%, EF%, and (G) IVRT. H: Oil Red O and (I) dihydroethidium (DHE) staining of heart sections (scale bar: 50 μm). (J) Immunoblots of PAK3 in cytosol and SREBP1c in nuclear fraction. (K) qPCR of lipid genes (n = 4 biological replicates). Data are presented as mean ± SEM. P < 0.05 (*) s determined by two-way ANOVA with Tukey correction in BD and two-tailed Student t test in F, G, J, and K.
Figure 6
Figure 6
PAK3-triggered lipotoxicity in cardiomyocytes is blocked by a SREBP1 inhibitor. A: Representative immunofluorescent staining images and quantification of nuclear SREBP1c in neonatal rat cardiomyocytes (NRCMs) infected with constitutively active PAK3 (Ad-Pak3-T421E) followed by 3 µg/mL betulin treatment of 4 h (scale bar: 20 µm) (n = 12–18 biological replicates per group). B: Immunoblots and quantification of SREBP1c in nuclei of PAK3 overexpressing NRCMs (n = 5 individual experiment per group). C: qPCR quantification of Acsl1, Acaca, Acacb, and Acca2. Representative images and quantification of Oil Red O staining (D), dihydroethidium (DHE) staining (E), and TUNEL staining (F) in NRCMs infected with Ad-Pak3-T421E with or without betulin treatment in response to PA/OA for 4 h (n = 5–10 individual experiments per group). Scale bar: 20 µm. Data shown are mean ± SEM. P < 0.05 (*) is determined by one-way ANOVA with Tukey’s correction.
Figure 7
Figure 7
Betulin treatment alleviates PAK3-triggered obesity cardiomyopathy. A: Schematic figure of the experiment in AAV9-Pak3 injected mice fed with HFD with or without betulin (30 mg/kg/day) treatment for 8 weeks. B and C: Representative left ventricular M-mode echocardiographic images and the measurement of (B) FS%, EF%, and (C) IVRT. D: TEM detecting LDs (arrows) in the heart (scale bar: 2 μm). E: Oil red O staining of the myocardium (scale bar: 50 μm). F: Selection of significantly decreased lipids (P < 0.05) after botulin treatment by lipidomic analyses of the heart tissue (n = 4–5 biological replicates). G: Immunoblots of PAK3 in cytosol and SREBP1c in nuclear fraction. H: qPCR quantification of genes involved in lipogenesis. n = 5 biological replicates per group. Data are presented as mean ± SEM. P < 0.05 (*) is determined by two-tailed Student t test.
Figure 8
Figure 8
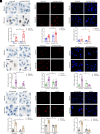
PAK3 promotes lipotoxicity in human induced pluripotent stem cell-derived cardiomyocytes (hiPSC-CMs). hiPSC-CMs were infected with Ad-Pak3-T421E, an adenovirus carrying constitutively active PAK3 (AC), Ad-Pak3-T421A, an adenovirus overexpressing kinase-dead PAK3 (DF), or knockdown PAK3 by transfection with siPak3 (GI) followed by PA and OA (500 μmol/L each) stimulation for various durations. Representative images and quantification of Oil Red O staining (A, D, G), dihydroethidium (DHE) staining (B, E, H), and TUNEL staining (C, F, I). Scale bar: 20 μm. n = 6–10 individual experiments per group. Data are presented as mean ± SEM. P < 0.05 (*) is calculated by two-way ANOVA with Tukey correction.

References

    1. Powell-Wiley TM, Poirier P, Burke LE, et al.; American Heart Association Council on Lifestyle and Cardiometabolic Health; Council on Cardiovascular and Stroke Nursing; Council on Clinical Cardiology; Council on Epidemiology and Prevention; and Stroke Council . Obesity and cardiovascular disease: a scientific statement from the American Heart Association. Circulation 2021;143:e984–e1010 - PMC - PubMed
    1. Tong M, Saito T, Zhai P, et al. Alternative mitophagy protects the heart against obesity-associated cardiomyopathy. Circ Res 2021;129:1105–1121 - PubMed
    1. Nakamura M, Sadoshima J. Cardiomyopathy in obesity, insulin resistance and diabetes. J Physiol 2020;598:2977–2993 - PubMed
    1. Ouwens DM, Boer C, Fodor M, et al. Cardiac dysfunction induced by high-fat diet is associated with altered myocardial insulin signalling in rats. Diabetologia 2005;48:1229–1237 - PubMed
    1. Yoon H, Shaw JL, Haigis MC, Greka A. Lipid metabolism in sickness and in health: emerging regulators of lipotoxicity. Mol Cell 2021;81:3708–3730 - PMC - PubMed

MeSH terms

Substances