. 2024 Aug 13;22(8):e3002751.
doi: 10.1371/journal.pbio.3002751. eCollection 2024 Aug.

Arl2 GTPase associates with the centrosomal protein Cdk5rap2 to regulate cortical development via microtubule organization

Affiliations

Arl2 GTPase associates with the centrosomal protein Cdk5rap2 to regulate cortical development via microtubule organization

Dongliang Ma et al. PLoS Biol. .

Abstract

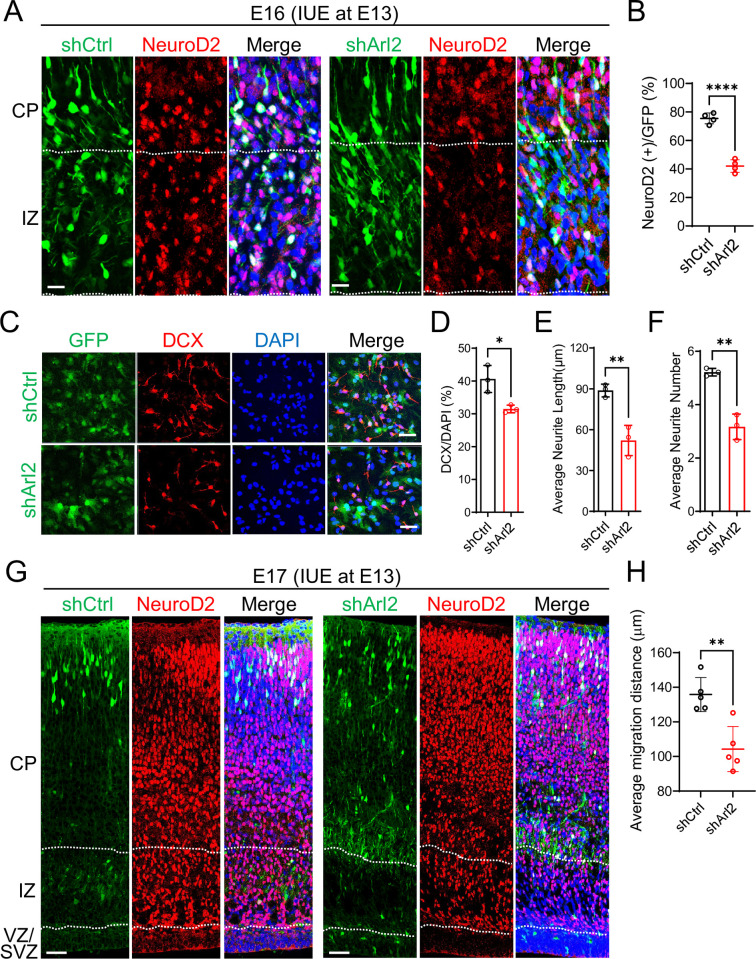
ADP ribosylation factor-like GTPase 2 (Arl2) is crucial for controlling mitochondrial fusion and microtubule assembly in various organisms. Arl2 regulates the asymmetric division of neural stem cells in Drosophila via microtubule growth. However, the function of mammalian Arl2 during cortical development was unknown. Here, we demonstrate that mouse Arl2 plays a new role in corticogenesis via regulating microtubule growth, but not mitochondria functions. Arl2 knockdown (KD) leads to impaired proliferation of neural progenitor cells (NPCs) and neuronal migration. Arl2 KD in mouse NPCs significantly diminishes centrosomal microtubule growth and delocalization of centrosomal proteins Cdk5rap2 and γ-tubulin. Moreover, Arl2 physically associates with Cdk5rap2 by in silico prediction using AlphaFold multimer, which was validated by co-immunoprecipitation and proximity ligation assay. Remarkably, Cdk5rap2 overexpression significantly rescues the neurogenesis defects caused by Arl2 KD. Therefore, Arl2 plays an important role in mouse cortical development through microtubule growth via the centrosomal protein Cdk5rap2.


Conflict of interest statement

The authors have declared that no competing interests exist.

Figures

Fig 1
Fig 1. Arl2 KD results in a reduction in mNPC proliferation and neuronal migration.
(A) Schematic representation of IUE. (B) Brain slices from shCtrl (scrambled control) and shArl2 (Arl2 shRNA) groups at E14, 1 day after IUE, were labelled with EdU and GFP. (C) Bar graph showing reduced EdU incorporation upon Arl2 KD (42.43 ± 4.04% in shArl2 vs. 58.25 ± 3.11% in shCtrl). The values represent the mean ± SD (shCtrl: n = 4 embryos, shArl2: n = 5 embryos). Student t test, differences were considered significant at ***p < 0.001. (D) Cortical brain sections from shCtrl and shArl2 groups at E15, 2 days after IUE, were labelled with TBR2 (intermediate neural progenitor marker and labelling SVZ) or Pax6 (radial glia marker and labelling VZ) with GFP. (E) Box plots representing GFP+ cells in CP (shCtrl: 12.68 ± 3.47%, shArl2: 3.42 ± 1.17%), IZ (shCtrl: 49.99 ± 4.42%, shArl2: 38.00 ± 7.91%), SVZ (shCtrl: 18.76 ± 3.71%, shArl2: 27.64 ± 3.53%), and VZ (shCtrl: 19.92 ± 0.87%, shArl2: 30.94 ± 7.51%) showing defects in neuronal migration to CP upon Arl2 KD compared to the control. The values represent the mean ± SD (shCtrl, n = 4 embryos; shArl2, n = 5 embryos). Multiple unpaired t tests, differences were considered significant at *p < 0.05, **p < 0.01, and ***p < 0.001. (F) Cortical brain sections for shCtrl and shArl2 groups at E16, 3 days after IUE, were immunolabelled with TBR1 (immature neuron marker and labelling CP) and GFP. (G) Box plots representing GFP+ cells in CP (shCtrl: 23.07 ± 3.61%, shArl2: 11.75 ± 3.67%), IZ (shCtrl: 52.82 ± 6.31%, shArl2: 48.00 ± 4.24%), SVZ (shCtrl: 13.94 ± 3.15%, shArl2: 18.82 ± 4.90%), and VZ (shCtrl: 10.17 ± 3.85%, shArl2: 21.42 ± 6.38%), showing defects in neuronal migration to CP upon Arl2 KD compared to the control. Multiple unpaired t tests, differences were considered significant at ***p < 0.001. ns = nonsignificance. Scale bars; B and D = 100 μm, F = 150 μm. Source data can be found in S1 Data. Arl2, ADP ribosylation factor-like GTPase 2; CP, cortical plate; EdU, 5-ethynyl-2′-deoxyuridine; GFP, green fluorescent protein; IUE, in utero electroporation; IZ, intermediate zone; KD, knockdown; mNPC, mouse neural progenitor cell; SVZ, subventricular zone; VZ, ventricular zone.
Fig 2
Fig 2. Loss of Arl2 led to defects in mNPC differentiation and neuronal migration.
(A) Cortical brain sections for shCtrl and shArl2 groups at E16, 3 days after IUE, were immunolabelled with NeuroD2 (neuronal marker found in newly born neurons in IZ and immature/mature neurons in CP) and GFP. (B) Box plots representing the proportion of NeuroD2+GFP+ cells in IZ 3 days after IUE (shCtrl: 75.49 ± 3.77%, shArl2: 42.06 ± 4.42%). (C) Immunostaining micrographs showing the DCX+ immature neurons after 5 days mNPC differentiation assay in both shCtrl and shArl2 groups. (D-F) Bar graphs representing the population of DCX-positive cells (shCtrl: 40.63 ± 4.11%, shArl2: 31.48 ± 1.72%); the average neurite length (shCtrl: 88.77 ± 4.69 μm, shArl2: 52.02 ± 11.08 μm) and the average neurite number (shCtrl: 5.22 ± 0.14, shArl2: 3.17 ± 0.48). The values represent the mean ± SD. Student t test in D, E, and F, n = 3. Differences were considered significant at *p < 0.05, **p < 0.01. (G) Cortical brain sections for shCtrl and shArl2 groups at E17, 4 days after IUE, were immunolabelled with NeuroD2 and GFP. (H) Box plots representing average migration of cells (shCtrl: 135.8 ± 9.81 μm, shArl2: 104.3 ± 13.05 μm), showing defects in neuronal migration to CP upon Arl2 KD compared to the control. We measured the migration distance of each neuron to the pia surface of the cortex using Image J, and the distance of each neuron is then normalized to the cortex thickness to obtain the average distance. The values represent the mean ± SD (shCtrl, n = 5 embryos; shArl2, n = 5 embryos). Student t test in H. Differences were considered significant at **p < 0.01. Scale bars; A = 25 μm, C = 50 μm, G = 150 μm. Source data can be found in S1 Data. Arl2, ADP ribosylation factor-like GTPase 2; CP, cortical plate; DCX, doublecortin; GFP, green fluorescent protein; IUE, in utero electroporation; IZ, intermediate zone; KD, knockdown; mNPC, mouse neural progenitor cell.
Fig 3
Fig 3. Overexpression various forms of Arl2 alters neuronal migration.
(A) Cortical brain sections following overexpression of human Arl2WT (hArl2WT), mouse Arl2WT (mArl2WT) at E16, 3 days after IUE, were labelled with tdTomato (Td). (B) Bar graphs (images in A) representing Td+ cell population in the group of control (VZ = 13.23 ± 1.85%, SVZ = 19.47 ± 3.19%, IZ = 45.92 ± 5.44%, CP = 21.39 ± 1.58%, n = 4 embryos), human Arl2WT (hArl2WT) (VZ = 11.13 ± 1.90%, SVZ = 18.21 ± 1.98%, IZ = 40.25 ± 1.14%, CP = 30.41 ± 2.66%, n = 4 embryos), mouse Arl2WT (mArl2WT) (VZ = 13.40 ± 2.25%, SVZ = 19.13 ± 3.40%, IZ = 36.61 ± 3.18%, CP = 30.86 ± 5.18%, n = 4 embryos). (C) Cortical brain sections following overexpression of Arl2WT, the dominant-negative form (Arl2T30N) and the dominant-active form (Arl2Q70L) at E16, 3 days after IUE, were immunolabelled with tdTomato (Td) and TBR1 (immature neuron marker and labelling CP). (D) Bar graphs (images in C) representing Td+ cell population in the group of control (VZ = 14.23 ± 2.15%, SVZ = 20.15 ± 2.25%, IZ = 39.63 ± 3.28%, CP = 25.99 ± 4.64%, n = 4 embryos), Arl2WT (VZ = 11.13 ± 1.90%, SVZ = 18.21 ± 1.98%, IZ = 40.25 ± 1.14%, CP = 30.41 ± 2.66%, n = 4 embryos), dominant-negative form (Arl2T30N) (VZ = 15.23 ± 3.51%, SVZ = 19.34 ± 2.89%, IZ = 65.43 ± 3.78%, CP = 0.00 ± 0.00%, n = 4 embryos) and dominant-active form (Arl2Q70L) (VZ = 15.68 ± 2.44%, SVZ = 20.80 ± 1.84%, IZ = 63.53 ± 2.86%, CP = 0.00 ± 0.00%, n = 4 embryos). (E) Cortical brain sections following overexpression of the dominant-active form (Arl2Q70L) at E18, 5 days after IUE, were immunolabelled with tdTomato (Td), and TBR2 is intermediate progenitor cells marker. (F) Quantification graphs representing TBR2+Td+ cells population in the group of control (3.00 ± 4.15%) and Arl2Q70L mutants (43.61 ± 7.62%) in the IZ. (G) Cortical brain sections following overexpression of the dominant-active form (Arl2Q70L) at E18, 5 days after IUE, were immunolabelled with tdTomato (Td), and TBR1 is immature neuron marker. (H) Quantification graphs representing TBR1+Td+ cells population in the group of control (4.90 ± 4.83%) and Arl2Q70L mutants (44.84 ± 2.78%) in the IZ. The values represent the mean ± SD. Two-way ANOVA with multiple comparisons in C and D; Student t test in F and G, n = 5 embryos. Differences were considered significant at *p < 0.05, **p < 0.01, ***p < 0.001, and ****p < 0.0001, ns = nonsignificance. Scale bars; A and C = 150 μm, E and G = 100 μm. Source data can be found in S1 Data. Arl2, ADP ribosylation factor-like GTPase 2; CP, cortical plate; IUE, in utero electroporation; IZ, intermediate zone; SVZ, subventricular zone; VZ, ventricular zone.
Fig 4
Fig 4. Arl2 dysfunction results in defects in cell cycle progression in mNPCs.
(A) Time series of mNPCs in vitro using Viafluor-647 live cell microtubule staining kit (Biotium, #70063) in shCtrl and shArl2. (B) Quantification graph showing the average time taken for a single mitotic cycle in control = 1.32 ± 0.21 h and shArl2 = 6.55 ± 1.52 h. (C) Time series of mNPCs in vitro using Viafluor-488 live cell microtubule staining kit (Biotium, #70062) in Arl2WT, Arl2Q70L, and Arl2T30N. (D) Quantification graph showing the average time taken for a single mitotic cycle in control = 1.10 ± 0.39 h, Arl2WT = 1.09 ± 0.51 h, Arl2Q70L = 1.17 ± 0.41 h, Arl2T30N = 5.48 ± 2.64 h in mNPCs overexpressing Arl2WT, Arl2Q70L, and Arl2T30N. Scale bars; A and C = 10 μm. Source data can be found in S1 Data. Arl2, ADP ribosylation factor-like GTPase 2; mNPC, mouse neural progenitor cell.
Fig 5
Fig 5. Loss of Arl2 results in a significant reduction of centrosomal microtubule growth in mNPCs in vitro.
(A) Schematic representation of centrosomal microtubule regrowth assay. (B) Immunostaining micrographs showing the microtubule regrowth labelled by α-tubulin within the time course (0, 5, 10, and 30 min) in both shCtrl and shArl2 groups. (C) Line graph representing α-tubulin intensity in shArl2 group (untreated = 89.59 ± 11.55, 0 min = 29.21 ± 5.16, 5 min = 38.16 ± 4.07, 10 min = 51.09 ± 10.80, and 30 min = 53.83 ± 11.31) compared to the control (untreated = 116.95 ± 10.39, 0 min = 43.14 ± 7.23, 5 min = 72.06 ± 17.30, 10 min = 89.60 ± 7.26, and 30 min = 103.13 ± 15.88) (unit = A.U.). The values represent the mean ± SD. Multiple t test in C, n = 3. Differences were considered significant at *p < 0.05, **p < 0.01. (D) Live imaging micrograph to track the growing ends of microtubules by using the plus-end microtubule binding protein EB3 tagged with Tdtomato (Td) in mNPCs in both shCtrl and shArl2 groups. (E) Kymographs showing the EB3-Td comets movement in mNPCs in both shCtrl and shArl2 groups. (F, G, and H) Quantification graphs representing the velocity of anterograde EB3 comets (shCtrl: 0.092 ± 0.036 μm/s vs. shArl2: 0.076 ± 0.020 μm/s), the velocity of retrograde EB3 comets (shCtrl: 0.066 ± 0.024 μm/s vs. shArl2: 0.048 ± 0.023 μm/s) and the total density of EB3 comets (shCtrl: 0.30 ± 0.046 No./μm2 vs. shArl2: 0.24 ± 0.043 No./μm2). The values represent the mean ± SD. Student t test in F, G, and H, n = 3. Differences were considered significant at *p < 0.05, ***p < 0.001. Scale bars; B = 10 μm, D = 1 μm. Source data can be found in S1 Data. Arl2, ADP ribosylation factor-like GTPase 2; mNPC, mouse neural progenitor cell.
Fig 6
Fig 6. Overexpression of mutant forms of Arl2 leads to defects in microtubule growth in mNPCs.
(A) Immunostaining micrographs showing microtubule regrowth labelled by α-tubulin within the time course (0, 5, 10, and 30 min) in Arl2WT, Arl2T30N, and Arl2Q70L groups in mNPCs. (B) Line graph representing α-tubulin intensity in Arl2WT group (untreated = 95.57 ± 13.03, 0 min = 45.57 ± 6.61, 5 min = 73.33 ± 17.61, 10 min = 100.32 ± 10.82, and 30 min = 113.92 ± 11.01), Arl2T30N group (untreated = 74.08 ± 1.98, 0 min = 39.85 ± 2.09, 5 min = 43.91 ± 1.82, 10 min = 30.11 ± 5.37, and 30 min = 38.74 ± 12.51), Arl2Q70L group (untreated = 79.08 ± 11.56, 0 min = 28.50 ± 4.00, 5 min = 49.51 ± 23.50, 10 min = 42.23 ± 7.43, and 30 min = 65.19 ± 11.47) compared to the control (untreated = 109.78 ± 8.61, 0 min = 49.71 ± 7.36, 5 min = 59.58 ± 14.29, 10 min = 75.43 ± 9.13, and 30 min = 96.95 ± 16.54) in mNPCs. The values represent the mean ± SD, unit = A.U. Two-way ANOVA with multiple comparisons in B, n = 3. Differences were considered significant at *p < 0.05, **p < 0.01, ***p < 0.001, and ****p < 0.0001, ns = nonsignificance. (C) Line graph of microtubule regrowth assay representing α-tubulin intensity in overexpression of Arl2K71R mutant group (untreated = 112.39 ± 21.47, 0 min = 64.63 ± 16.30, 5 min = 87.12 ± 11.05, 10 min = 118.77 ± 22.48, and 30 min = 109.60 ± 20.81) as compared to the control (untreated = 108.99 ± 6.73, 0 min = 33.72 ± 6.30, 5 min = 66.10 ± 14.74, 10 min = 75.92 ± 11.53, and 30 min = 86.86 ± 15.31) (unit = A.U.) in mNPCs in vitro. Multiple t test in C, n = 3. Differences were considered significant at *p < 0.05, ns = nonsignificance. (D) Live imaging micrograph to track the growing ends of microtubules by using the plus-end microtubule binding protein EB3 tagged with GFP in mNPCs in Arl2WT, Arl2T30N, and Arl2Q70L groups. (E) Kymographs showing the EB3-GFP comets movement in mNPCs in Arl2WT, Arl2T30N, and Arl2Q70L groups. (F, G, and H) Quantification graphs representing the velocity of anterograde EB3 comets (control: 0.074 ± 0.034 μm/s, Arl2WT: 0.070 ± 0.03 μm/s; Arl2T30N: 0.057 ± 0.022 μm/s and Arl2Q70L: 0.067 ± 0.028 μm/s), the velocity of retrograde EB3 comets (control: 0.058 ± 0.031 μm/s, Arl2WT: 0.054 ± 0.027 μm/s; Arl2T30N: 0.044 ± 0.021 μm/s and Arl2Q70L: 0.048 ± 0.021 μm/s) and the total density of EB3 comets (control: 0.32 ± 0.02 No./μm2, Arl2WT: 0.29 ± 0.04 No./μm2; Arl2T30N: 0.24 ± 0.01 No./μm2 and Arl2Q70L: 0.29 ± 0.05 No./μm2, n = 3). The values represent the mean ± SD. One-way ANOVA in E, F, and G. Differences were considered significant at **p < 0.01 and ****p < 0.0001, ns = nonsignificance. Scale bars; A = 5 μm; D = 10 μm. Source data can be found in S1 Data. Arl2, ADP ribosylation factor-like GTPase 2; GFP, green fluorescent protein; mNPC, mouse neural progenitor cell.
Fig 7
Fig 7. Arl2 localizes to the centrosomes and is required for γ-tubulin localization at the centrosomes in mNPCs.
(A) Immunostaining micrographs of HEK293 cells cotransfected with Arl2-HA and Cdk5rap2-Myc were imaged using super-resolution microscopy labelled for γ-tubulin, Myc, and HA. (B) Immunostaining micrographs showing Cdk5rap2 and γ-tubulin in shCtrl, shArl2, and shCdk5rap2 groups in mNPCs. (C) Quantification graph showing Cdk5rap2 intensity at metaphase of mNPCs (94.5 ± 20.06, n = 3 batches with 20 cells) upon Arl2 KD and (shCdk5rap2-1 = 115.6 ± 23.13, n = 3 batches with 16 cells; shCdk5rap2-2 = 107.5 ± 18.77, n = 3 batches with 17 cells) upon Cdk5rap2 KD as compared to shCtrl (153.0 ± 35.96, n = 3 batches with 19 cells). (D) Quantification graph showing γ-tubulin intensity at metaphase of mNPCs (68.59 ± 9.31, n = 3 batches with 20 cells) upon Arl2 KD and (shCdk5rap2-1 = 66.85 ± 16.44, n = 3 batches with 20 cells; shCdk5rap2-2 = 66.11 ± 12.33, n = 3 batches with 20 cells) upon Cdk5rap2 KD as compared to shCtrl (114.9 ± 24.88, n = 3 batches with 20 cells). The values represent the mean ± SD. One-way ANOVA in C and D. Differences were considered significant at ***p < 0.001 and ****p < 0.0001, ns = nonsignificance. (E) Bar graph showing AlphaFold multimer interaction prediction of Arl2 and Cdk5rap2, Arl2 and Pericentrin (PCNT), Arl2 and Centrobin with an ipTM score of 0.57, 0.34, 0.17, respectively, compared with TBCD, a known interactor of Arl2 with an ipTM score of 0.89. (F) Co-immunoprecipitation by overexpressing Arl2 (HA-Arl2) and Cdk5rap2 (Myc-Cdk5rap2) in HEK293 cells. Following precipitation with a HA antibody, the resulting protein complexes exhibited an anticipated 37 kD band corresponding to HA-Arl2 as well as 250 kD band corresponding to Myc-Cdk5rap2. TBCD was used as positive control, which also co-immunoprecipitated following precipitation with a HA antibody. Similarly, following precipitation with Myc antibody, bands corresponding Myc-Cdk5rap2 and HA-Arl2 were observed. (G) PLA showing overexpressing Arl2 (Arl2-GFP) and Cdk5rap2 (Myc-Cdk5rap2) (Vector-GFP and Myc-Vector, Arl2-GFP and Myc-Vector, Vector-GFP and Myc-Cdk5rap2, Arl2-GFP and Myc-Cdk5rap2) in mNPCs. (H) Quantification graph of the PLA foci per cell with no red dot, weak red dots, and strong red dots for (G). Vector-GFP and Myc-Vector, 8.17 ± 2.75; Arl2-GFP and Myc-Vector, 7.83 ± 1.44; Vector-GFP and Myc-Cdk5rap2, 6.11 ± 1.99; Arl2-GFP and Myc-Cdk5rap2, 104.00 ± 11.53; n = 3). The values represent the mean ± SD. One-way ANOVA in H. Differences were considered significant at ****p < 0.0001. Scale bars; A = 10 μm; boxed image for A = 1 μm; B = 5 μm; G = 40 μm. Source data can be found in S1 Data. Arl2, ADP ribosylation factor-like GTPase 2; ipTM, interface pTM; KD, knockdown; mNPC, mouse neural progenitor cell; PLA, proximity ligation assay; TBCD, Tubulin folding cofactor D.
Fig 8
Fig 8. Arl2 functions upstream of Cdk5rap2 in regulating neuronal cell migration and proliferation in the developing cortex.
(A) Brain slices from shCtrl (scrambled control) and shCdk5rap2 (Cdk5rap2 shRNA) groups at E14, 1 day after IUE, were labelled with EdU and GFP. (B) Bar graphs showing reduced EdU incorporation upon Cdk5rap2 KD (47.05 ± 5.43% in shCdk5rap2 vs. 58.92 ± 3.62% in shCtrl). The values represent the mean ± SD. Student t test in C, n = 4 embryos. Differences were considered significant at *p < 0.05. (C) WB analysis of mNPC protein extracts of control (H1-shCtrl-GFP), Cdk5rap2 KD (H1-shCdk5rap2-GFP), and Arl2 KD with lentivirus (pPurGreen) infection in 48-h culture. Blots were probed with anti-Cdk5rap2 and anti-Arl2 antibody, α-Tubulin and p84 as loading control. (D) Bar graphs representing Cdk5rap2 protein levels upon Arl2 KD (shCdk5rap2-1 = 0.26 ± 0.21 and shCdk5rap2-2 = 0.32 ± 0.20; shArl2 = 0.29 ± 0.11 normalized in shCtrl, n = 3) in mNPCs. (E) Bar graphs representing Arl2 protein levels upon Cdk5rap2 KD (shCdk5rap2-1 = 0.95 ± 0.11 and shCdk5rap2-2 = 1.05 ± 0.09; shArl2 = 0.22 ± 0.07 normalized in shCtrl, n = 3) in mNPCs. (F) Bar graphs showing the total number of GFP+EdU+ double positive cells in VZ+SVZ by overexpression of Cdk5rap2 in Arl2 KD brains (control = 11.14 ± 1.04%, shArl2 = 4.87 ± 0.81%, shCtrl + Cdk5rap2 = 9.32 ± 1.63%, shArl2 + Cdk5rap2 = 10.08 ± 1.31%) (shCtrl, n = 5 embryos; shArl2, shCtrl + shCdk5rap2, shArl2 + shCdk5rap2, n = 6 embryos) 2 days after IUE. (G) Bar graphs showing the total number of GFP+EdU+ double positive cells in IZ by overexpression of Cdk5rap2 in Arl2 KD brains (control = 49.41 ± 6.25%, shArl2 = 22.17 ± 3.98%, shCtrl + Cdk5rap2 = 43.84 ± 7.89%, shArl2 + Cdk5rap2 = 41.68 ± 16.74%) (shCtrl, n = 5 embryos; shArl2, shCtrl + shCdk5rap2, shArl2 + shCdk5rap2, n = 6 embryos) 2 days after IUE. The values represent the mean ± SD. One-way ANOVA in D-G. Differences were considered significant at **p < 0.01, ****p < 0.0001. (H) Brain slices from shCtrl, shArl2, shCtrl + Cdk5rap2, and shArl2 + Cdk5rap2 groups at E16, 3 days after IUE, were labelled with GFP (shCtrl, shArl2, shCtrl + Cdk5rap2, and shArl2 + Cdk5rap2) and tdTomato (shCtrl + Cdk5rap2 and shArl2 + Cdk5rap2). (I) Bar graphs (images in H) representing GFP+ and/or Td+ cell population in the groups of control (VZ = 15.20 ± 2.75%, SVZ = 23.96 ± 2.88%, IZ = 39.96 ± 1.27%, CP = 20.87 ± 3.01%, n = 5 embryos), shArl2 (VZ = 21.87 ± 4.31%, SVZ = 21.14 ± 2.87%, IZ = 48.45 ± 4.47%, CP = 7.70 ± 4.67%, n = 6 embryos), shCtrl + Cdk5rap2 (VZ = 19.08 ± 4.38%, SVZ = 16.59 ± 2.18%, IZ = 37.63 ± 3.05%, CP = 26.70 ± 6.21%, n = 6 embryos), and shArl2 + Cdk5rap2 (VZ = 16.07 ± 2.15%, SVZ = 22.98 ± 3.99%, IZ = 42.50 ± 1.45%, CP = 18.45 ± 1.15%, n = 6 embryos). (J) Working model (made by BioRender): Arl2 plays a novel role in regulating the proliferation and differentiation of mNSCs. Arl2 is required for the proliferation, migration, and differentiation of mouse forebrain NPCs in vitro and in vivo by regulating centrosome assembly and microtubule growth in NPCs. Arl2 physically associates and recruits Cdk5rap2 to the centrosomes to promote microtubule assembly in NPCs. Arl2 functions upstream of Cdk5rap2 in regulating NPC proliferation and migration during mouse cortical development. The values represent the mean ± SD. Two-way ANOVA with multiple comparisons in I. Differences were considered significant at *p < 0.05, **p < 0.01, ***p < 0.001, and ****p < 0.0001, ns = nonsignificance. Scale bar; A and H = 150 μm. Source data can be found in S1 Data. Arl2, ADP ribosylation factor-like GTPase 2; Cdk5rap2, CDK5 Regulatory Subunit Associated Protein 2; CP, cortical plate; EdU, 5-ethynyl-2′-deoxyuridine; GFP, green fluorescent protein; IUE, in utero electroporation; IZ, intermediate zone; KD, knockdown; mNPC, mouse neural progenitor cell; NPC, neural progenitor cell; SVZ, subventricular zone; VZ, ventricular zone; WB, western blot.

References

    1. Taverna E, Gotz M, Huttner WB. The cell biology of neurogenesis: toward an understanding of the development and evolution of the neocortex. Annu Rev Cell Dev Biol. 2014;30:465–502. Epub 2014 Jul 9. doi: 10.1146/annurev-cellbio-101011-155801 . - DOI - PubMed
    1. Shitamukai A, Matsuzaki F. Control of asymmetric cell division of mammalian neural progenitors. Dev Growth Differ. 2012;54(3):277–286. doi: 10.1111/j.1440-169X.2012.01345.x - DOI - PubMed
    1. Itoh Y, Tyssowski K, Gotoh Y. Transcriptional coupling of neuronal fate commitment and the onset of migration. Curr Opin Neurobiol. 2013;23(6):957–964. doi: 10.1016/j.conb.2013.08.003 - DOI - PubMed
    1. Furutachi S, Miya H, Watanabe T, Kawai H, Yamasaki N, Harada Y, et al.. Slowly dividing neural progenitors are an embryonic origin of adult neural stem cells. Nat Neurosci. 2015;18(5):657–665. doi: 10.1038/nn.3989 - DOI - PubMed
    1. Telley L, Agirman G, Prados J, Amberg N, Fièvre S, Oberst P, et al.. Temporal patterning of apical progenitors and their daughter neurons in the developing neocortex. Science. 2019;364(6440):eaav2522. doi: 10.1126/science.aav2522 - DOI - PubMed

MeSH terms

LinkOut - more resources