. 2024 Aug 13;20(8):e1011156.
doi: 10.1371/journal.pgen.1011156. eCollection 2024 Aug.

Candida albicans' inorganic phosphate transport and evolutionary adaptation to phosphate scarcity

Affiliations

Candida albicans' inorganic phosphate transport and evolutionary adaptation to phosphate scarcity

Maikel Acosta-Zaldívar et al. PLoS Genet. .

Abstract

Phosphorus is essential in all cells' structural, metabolic and regulatory functions. For fungal cells that import inorganic phosphate (Pi) up a steep concentration gradient, surface Pi transporters are critical capacitators of growth. Fungi must deploy Pi transporters that enable optimal Pi uptake in pH and Pi concentration ranges prevalent in their environments. Single, triple and quadruple mutants were used to characterize the four Pi transporters we identified for the human fungal pathogen Candida albicans, which must adapt to alkaline conditions during invasion of the host bloodstream and deep organs. A high-affinity Pi transporter, Pho84, was most efficient across the widest pH range while another, Pho89, showed high-affinity characteristics only within one pH unit of neutral. Two low-affinity Pi transporters, Pho87 and Fgr2, were active only in acidic conditions. Only Pho84 among the Pi transporters was clearly required in previously identified Pi-related functions including Target of Rapamycin Complex 1 signaling, oxidative stress resistance and hyphal growth. We used in vitro evolution and whole genome sequencing as an unbiased forward genetic approach to probe adaptation to prolonged Pi scarcity of two quadruple mutant lineages lacking all 4 Pi transporters. Lineage-specific genomic changes corresponded to divergent success of the two lineages in fitness recovery during Pi limitation. Initial, large-scale genomic alterations like aneuploidies and loss of heterozygosity eventually resolved, as populations gained small-scale mutations. Severity of some phenotypes linked to Pi starvation, like cell wall stress hypersensitivity, decreased in parallel to evolving populations' fitness recovery in Pi scarcity, while severity of others like membrane stress responses diverged from Pi scarcity fitness. Among preliminary candidate genes for contributors to fitness recovery, those with links to TORC1 were overrepresented. Since Pi homeostasis differs substantially between fungi and humans, adaptive processes to Pi deprivation may harbor small-molecule targets that impact fungal growth, stress resistance and virulence.


Conflict of interest statement

The authors have declared that no competing interests exist.

Figures

Fig 1
Fig 1. Among Pi transporters, Pho84 contributed to growth over the broadest range of tested conditions.
A. Fivefold dilutions of cells of indicated genotypes were spotted (left to right) onto YPD (left, center) or SC (all others) agar media buffered to indicated pH (3, 5 or 7) and containing indicated Pi concentrations (0.05, 0.5 or 7.3 mM) and grown at 30°C for 2 d. Strains are WT (JKC915); pho84-/- (JKC1450); pho89-/- (JKC2585); pho87-/- (JKC2581); fgr2-/- (JKC2667); Pho84-A: pho87-/- pho89-/- fgr2-/- PHO84+/+ (JKC2788); Pho89-A: pho84-/- pho87-/- fgr2-/- PHO89+/+ (JKC2783); Pho87-A: pho84-/- pho89-/- fgr2-/- PHO87+/+ (JKC2777); Fgr2-A: pho84-/- pho87-/- pho89-/- FGR2+/+ (JKC2758); Q-: pho84-/- pho87-/- pho89-/- fgr2-/- (JKC2830 and JKC2860). Representative of 3 biological replicates. B. Relative growth (normalized to WT) of strains with indicated genotypes under varying Pi availability and pH ranges. Spots’ integrated signal intensity ratio of each strain vs. WT control on the same plate was calculated and plotted in Graphpad Prism. WT, pho84-/-, pho89-/-, pho87-/-, Q- strains error bars represent SD from 3 biological replicates and Pho84-A, Pho89-A, Pho87-A strains error bars represent SD from 2 biological replicates. For statistical significance: ns, p > 0.05; **, 0.001 < p ≤ 0.01; ***, 0.0001 < p ≤ 0.001. At pH 3 and pH 5, no statistically significant difference was noted between growth of pho84-/-, and that of Pho89-A, Pho87-A, Fgr2-A and Q- cells.
Fig 2
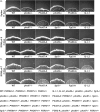
Fig 2. Pho84 was the major contributor to hyphal growth among 4 Pi transporters.
Cell suspensions of indicated genotypes were spotted at equidistant points around the perimeter of Spider (A) and RPMI (B, C) agar plates. Photomicrographs of the edge of spots were obtained at 4 days for RPMI and 11 days for Spider plates. Spot edges were aligned with image frame corners to allow comparisons of hyphal fringes’ length. Spots without filaments have smooth rounded edges while hyphal growth appears like dense fuzz with spiky tips. Strains are WT (JKC915); pho84-/- (JKC1450); Pho84-A: pho87-/- pho89-/- fgr2-/- PHO84+/+ (JKC2788); pho89-/- (JKC2585); Pho89-A: pho84-/- pho87-/- fgr2-/- PHO89+/+ (JKC2783); pho87-/- (JKC2581); Pho87-A: pho84-/- pho89-/- fgr2-/- PHO87+/+ (JKC2777); fgr2-/- (JKC2667); Fgr2-A: pho84-/- pho87-/- pho89-/- FGR2+/+ (JKC2758); Q- L1: pho84-/- pho87-/- pho89-/- fgr2-/- (JKC2830); Q- L2: pho84-/- pho87-/- pho89-/- fgr2-/- (JKC2860). Size bar 200 μm. Representative of 3 biological replicates.
Fig 3
Fig 3. Pho84 was required for TORC1 activation.
Cells were grown in YNB with indicated Pi concentrations for 90 min. Western blots were probed against phosphorylated Rps6 (P-S6) for monitoring TORC1 activity, and tubulin (Tub) as loading control. Dens: ratio between P-S6 and tubulin signals by densitometry. Representative of 3 biological replicates. Strains are 1: WT (JKC915); 2: pho84-/- (JKC1450); 3: pho87-/- (JKC2581); 4: pho89-/- (JKC2585) and 5: fgr2-/- (JKC2667).
Fig 4
Fig 4. Pi transporters differed in their optimal pH and Pi concentration range while Pho84 was most active overall.
Cells expressing the indicated transporter alone among the 4 Pi transporters were inoculated to an OD600 of 0.1 into SC medium buffered to the indicated pH and grown in a plate reader at 30°C for 20 h. OD600 was measured every 15 min and the area under the growth curve was calculated in Graphpad Prism; means of 3 biological replicates are depicted in histograms. See Fig C in S1 Text for all growth curves and Fig D in S1 Text for statistical analysis. Error bars represent SD of 3 biological replicates. A. SC containing 0.1 mM KH2PO4. B. SC containing 7.3 mM KH2PO4. Strains are WT (JKC915); Pho84-A: pho87-/- pho89-/- fgr2-/- PHO84+/+ (JKC2788); Pho87-A: pho84-/- pho89-/- fgr2-/- PHO87+/+ (JKC2777); Pho89-A: pho84-/- pho87-/- fgr2-/- PHO89+/+ (JKC2783); Fgr2-A: pho84-/- pho87-/- pho89-/- FGR2+/+ (JKC2758). No significant difference was observed between Pho84-A and WT cells under any tested conditions (by two-tailed Student’s t-test).
Fig 5
Fig 5. Pi uptake of cells expressing single Pi transporters reflected their growth optima.
Cells with indicated genotypes were inoculated into SC without Pi (buffered to pH 1–9) at OD600 2. After 30 minutes, KH2PO4 was added to a final concentration of 1 mM, and the extracellular concentration of phosphate was measured in 2 technical replicates at indicated time points. Error bars SD. Representative of three biological replicates. A. WT (JKC915). B. Pho84-A: pho87-/- pho89-/- fgr2-/- PHO84+/+ (JKC2788). C. Pho89-A in pH 1–5; D. Pho89-A in pH 6–9: pho84-/- pho87-/- fgr2-/- PHO89+/+ (JKC2783). E. Pho87-A: pho84-/- pho89-/- fgr2-/- PHO87+/+ (JKC2777). F. Fgr2-A: pho84-/- pho87-/- pho89-/- FGR2+/+ (JKC2758). G. Q- cells (pho84-/- pho87-/- pho89-/- fgr2-/-; JKC2830) took up significantly less Pi at pH 4 than Fgr2-A cells at 30 h of incubation. Histograms depict average and SD of 3 biological replicates, p = 0.0001 (two-tailed Student’s t-test).
Fig 6
Fig 6. Cells lacking 4 Pi transporters showed residual Pi uptake ability that was outcompeted by glycerophosphocholine.
A. Pi uptake experiments performed as in Fig 5 showed that in Q- cells (pho84-/- pho87-/- pho89-/- fgr2-/-, JKC2830) residual Pi uptake occurred and was most efficient at pH 4. B. Tenfold excess glycerophosphocholine (GPC) inhibited Pi uptake in Q- cells at pH 4. As in Fig 5, Q- cells (JKC2830) were inoculated into SC 0 Pi with 10 mM GPC; after 30 minutes, KH2PO4 was added to a final concentration of 1 mM; Pi concentration in the medium was measured with 2 technical replicates at each time point. Graph shows mean of 3 biological replicates. Error bars SD. C. Cells in which PHO87 is expressed from repressible tetO while the other 3 Pi transporters and GIT2-4 are deleted (tetO-PHO87/pho87 pho84-/- pho89-/- fgr2-/- git2-4-/-, JKC2969), grew well in the absence of doxycycline but grew minimally during tetO repression in 50 μg/ml doxycycline. WT (JKC915) and tetO-PHO87 (JKC2969) were starved for Pi in SC 0 Pi in the presence of 50 μg/ml doxycycline for 48 h. The medium and doxycyline were replaced at 24 h. Cells were then inoculated at OD 0.1 into SC medium (7.3 mM Pi), buffered to pH 3, without and with 50 μg/ml Doxycycline. OD600 was recorded every 15 min. Error bars SD of 3 technical replicates. Representative of 3 biological replicates.
Fig 7
Fig 7. Evolution of 2 Q- lineages during Pi scarcity proceeded along distinct trajectories.
Q- L1 and -L2 cells and selected passages from in vitro evolution were grown in SC 0.4 mM Pi (pho84-/- pho87-/- pho89-/- fgr2-/-, JKC2830, Q- L1 and JKC2860, Q- L2). Representative growth curves and corresponding area under the curve (AUC) shown for selected passages. P0 denotes the Q- isolate before passaging; all experiments after P0 were performed with populations, not with clones derived from single colonies. Growth curves are representative of 3 biological replicates, except for passages 8 and 10, which are representative of 2 biological replicates. Error bars SD of 3 technical replicates. For statistical significance: ns, p > 0.05; *, 0.01 < p ≤ 0.05; **, 0.001 < p ≤ 0.01; ***, 0.0001 < p ≤ 0.001 by two-tailed Student’s t-test.
Fig 8
Fig 8. Two evolving lineages of Q- cells showed distinct stressor endurance.
A. Growth area under the curve (AUC) of cells grown in SC 1 mM Pi containing Vehicle (Veh, H2O), 0.35 μg/ml Amphotericin B (AmpB) or 0.005% SDS. Representative of 3 biological replicates; error bar SD of 3 technical replicates. B. AmpB and SDS growth AUC from panel A normalized to each strain’s vehicle control. WT (JKC915); Q- L1 (JKC2830); Q- L1 P30 (JKC2830 passage 30); Q- L2 (JKC2860); Q- L2 P30 (JKC2860 passage 30). Error bar SD of 3 biological replicates. For statistical significance: ns, p > 0.05; *, 0.01 < p ≤ 0.05; ***, 0.0001 < p ≤ 0.001 by two-tailed Student’s t-test. C. Threefold dilutions of cells of indicated genotypes, starting at OD600 0.5, were spotted (top to bottom) onto SC medium containing Vehicle (Veh, H2O) or 10 ng/ml micafungin (Mica), 15 μM plumbagin (Plum), 50 ng/ml rapamycin (Rapa), and grown at 30°C for 1 d (Mica), 2 d (Plum), 4 d (Rapa), respectively. Strains are WT (JKC915); Q- L1 (JKC2830) passage 0, 4, 13, 19, 30 and Q- L2 (JKC2860) passages 0, 5, 7, 19, 30; pho84-/- (JKC1450). JKC2830 and JKC2860 genotypes are pho84-/- pho87-/- pho89-/- fgr2-/-. Representative of 3 biological replicates.
Fig 9
Fig 9. Whole genome sequencing of selected passages of 2 evolving Q- derived populations showed distinct trajectories of acquisition and resolution of aneuploidies and loss of heterozygosity.
A. YMAP [85] depictions of WGS results of 2 distinct Q- isolates showing Chr5 trisomy and loss of heterozygosity of Chr2 and Chr3, compared with their progenitor JKC915, the WT used in this study. Chromosomes are represented lengthwise on the horizontal axis, with centromeres denoted by the pinched position. The vertical height of the solid black bars along the horizontal axis indicates copy number in 10 kilobase bins (flat black line = 2N). Gray background shades indicate local SNP densities, such that darker gray shades correspond to higher and lighter shades to lower SNP densities. Gray, cyan, and magenta colors represent heterozygous, homozygous homolog A, and homozygous homolog B regions respectively. Blue indicates A/A/B allelic balance, and purple indicates A/B/B allelic balance. Black circles under a chromosome indicate the location of the major repeat sequence (MRS) loci, and the blue circle under ChrR represents the ribosomal DNA cluster. B. YMAP depictions of WGS results of populations evolving from JKC2830, Q- L1 and JKC2860, Q- L2 (both pho84-/- pho87-/- pho89-/- fgr2-/-). YMAP symbols as in A.

Update of

Similar articles

Cited by

References

    1. Pontes MH, Groisman EA. Protein synthesis controls phosphate homeostasis. Genes & development. 2018;32(1):79–92. Epub 2018/02/14. doi: 10.1101/gad.309245.117 ; PubMed Central PMCID: PMC5828397. - DOI - PMC - PubMed
    1. Garg A, Sanchez AM, Miele M, Schwer B, Shuman S. Cellular responses to long-term phosphate starvation of fission yeast: Maf1 determines fate choice between quiescence and death associated with aberrant tRNA biogenesis. Nucleic acids research. 2023;51(7):3094–115. Epub 2023/02/17. doi: 10.1093/nar/gkad063 ; PubMed Central PMCID: PMC10123115. - DOI - PMC - PubMed
    1. Ducousso-Detrez A, Fontaine J, Lounes-Hadj Sahraoui A, Hijri M. Diversity of Phosphate Chemical Forms in Soils and Their Contributions on Soil Microbial Community Structure Changes. Microorganisms. 2022;10(3). Epub 2022/03/27. doi: 10.3390/microorganisms10030609 ; PubMed Central PMCID: PMC8950675. - DOI - PMC - PubMed
    1. Van Mooy BA, Fredricks HF, Pedler BE, Dyhrman ST, Karl DM, Koblizek M, et al.. Phytoplankton in the ocean use non-phosphorus lipids in response to phosphorus scarcity. Nature. 2009;458(7234):69–72. Epub 2009/02/03. doi: 10.1038/nature07659 . - DOI - PubMed
    1. Oliverio AM, Bissett A, McGuire K, Saltonstall K, Turner BL, Fierer N. The Role of Phosphorus Limitation in Shaping Soil Bacterial Communities and Their Metabolic Capabilities. mBio. 2020;11(5). Epub 2020/10/29. doi: 10.1128/mBio.01718-20 ; PubMed Central PMCID: PMC7593963. - DOI - PMC - PubMed

MeSH terms