. 2024 Aug 13;22(8):e3002380.
doi: 10.1371/journal.pbio.3002380. eCollection 2024 Aug.

The dynamics and longevity of circulating CD4+ memory T cells depend on cell age and not the chronological age of the host

Affiliations

The dynamics and longevity of circulating CD4+ memory T cells depend on cell age and not the chronological age of the host

M Elise Bullock et al. PLoS Biol. .

Abstract

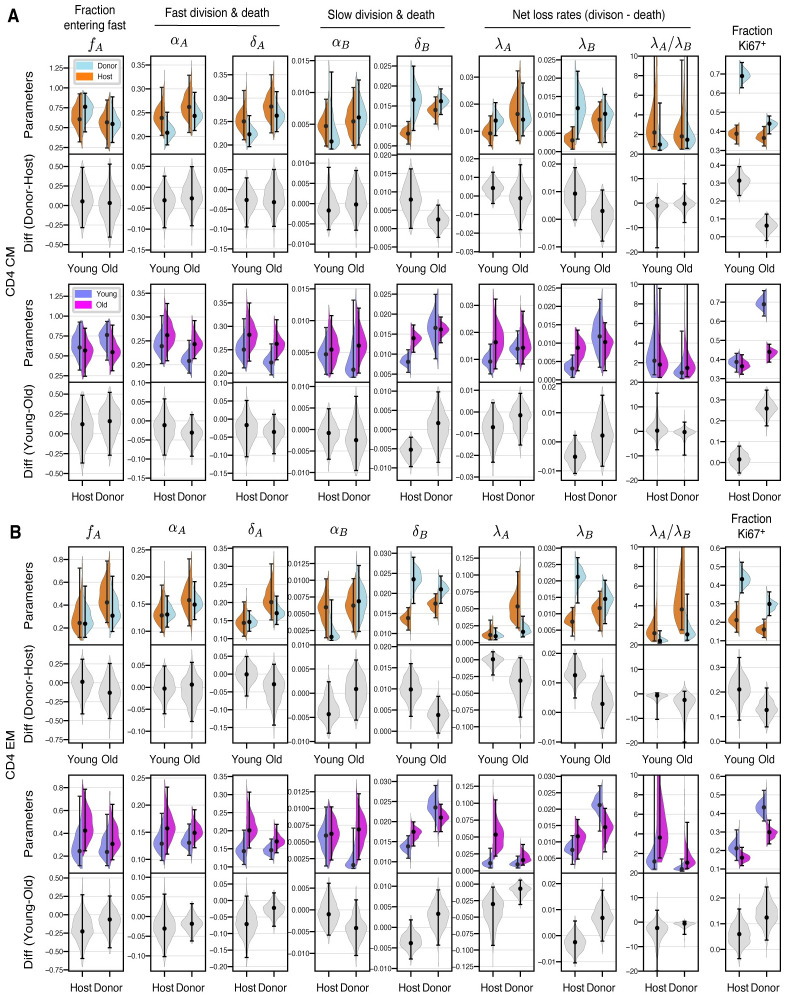
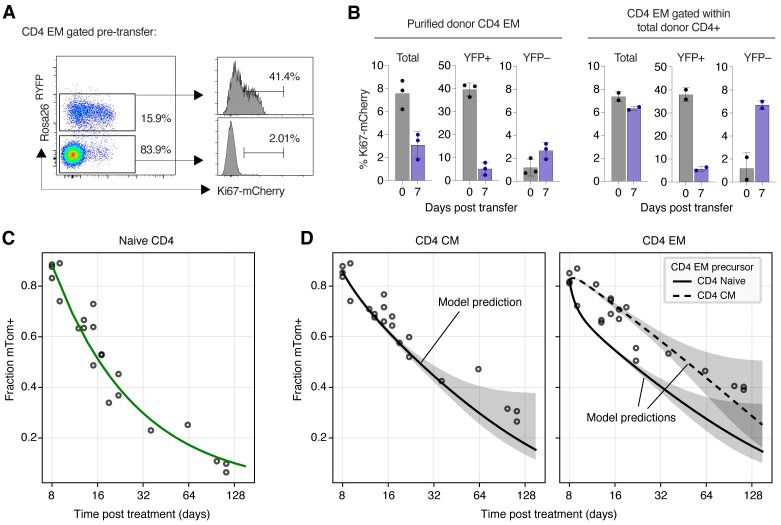
Quantifying the kinetics with which memory T cell populations are generated and maintained is essential for identifying the determinants of the duration of immunity. The quality and persistence of circulating CD4 effector memory (TEM) and central memory (TCM) T cells in mice appear to shift with age, but it is unclear whether these changes are driven by the aging host environment, by cell age effects, or both. Here, we address these issues by combining DNA labelling methods, established fate-mapping systems, a novel reporter mouse strain, and mathematical models. Together, these allow us to quantify the dynamics of both young and established circulating memory CD4 T cell subsets, within both young and old mice. We show that that these cells and their descendents become more persistent the longer they reside within the TCM and TEM pools. This behaviour may limit memory CD4 T cell diversity by skewing TCR repertoires towards clones generated early in life, but may also compensate for functional defects in new memory cells generated in old age.


Conflict of interest statement

The authors have declared that no competing interests exist.

Figures

Fig 1
Fig 1. Busulfan chimeric mice, experimental design, and gating strategies.
(A) Schematic of the busulfan chimeric mouse system, adapted from [32]. (B) Design of the BrdU/Ki67 labelling assay, studying 2 cohorts at different times post BMT. (C) Chimeric mice were fed BrdU for 21 days. Mice were analysed at different times during feeding and across 14 days following its cessation. Here, we show representative timecourses obtained from donor-derived CD4 TCM and TEM, showing patterns of Ki67/BrdU expression during and after BrdU feeding. See Methods and Fig A of S1 File for details and gating strategies.
Fig 2
Fig 2. Busulfan chimeric mice reveal shifts in memory CD4 T cell dynamics with both mouse age and cell age.
(A, B) Numbers and Ki67 expression levels of CD4 TCM and TEM recovered from lymph nodes in young and old cohort (Mann–Whitney tests). (C, D) Numbers and Ki67 expression levels of CD4 TCM and TEM in young and old mice, stratified by average cell age (host and donor; Wilcoxon tests). The data underlying this figure can be found in S1 Data. ** p < 10−3; *** p < 10−4; **** p < 10−5.
Fig 3
Fig 3. Modelling BrdU/Ki67 timecourses.
(A) Models of heterogeneity in cellular dynamics within a memory subset. Adapted from [32]. (B) Schematic of the core component of the ODE model used to describe the uptake of BrdU and the dynamic of Ki67 expression. (C, D) Fitted kinetics of BrdU uptake and loss in CD4 TCM and TEM, in the young (C) and older (D) cohorts of mice, using the branched model. The left column shows the frequency of BrdU-positive cells within donor and host cells. Centre and left columns show the proportion of BrdU-positive cells within Ki67-positive and Ki67-negative cells, respectively. There were 2 mice per time point for both donor and host throughout; in some panels, these points are very close and overlaid. The data underlying this figure can be found in S1 Data.
Fig 4
Fig 4
Posterior distributions of parameters derived from the branched model of the kinetics of CD4 TCM (A) and TEM (B), in the young and old cohorts of mice. Grey violin plots show differences in parameters (host/donor, and young/old). Points and bars show MAP estimates and 95% credible intervals, respectively. The data underlying this figure can be found in S1 Data.
Fig 5
Fig 5. Estimates of the mean life span of circulating memory CD4 T cells in the 2 age cohorts of mice.
(A) Expected life spans of CD4 TCM and TEM in young and old mice, each averaged over fast and slow subpopulations (see Text E of S1 File). (B) Relative abundance of lymph node-derived CD4 TCM and TEM, by age. (C) Estimated mean life spans of memory CD4 T cells, averaging over TCM and TEM, in the young and old cohorts. Violin plots show the distributions of the life spans over the joint posterior distribution of all model parameters; also indicated are the median and the 2.5 and 97.5 percentiles. The data underlying this figure can be found in S1 Data.
Fig 6
Fig 6. Inferred and measured values of the chimerism (donor cell fraction) within thymic and peripheral T cell subpopulations.
Left-hand (green) violin plots indicate the chimerism of the constitutive influxes into CD4 TCM and TEM estimated using Eq 1 of Text C of S1 File, fd. Split-colour violin plots indicate the posterior distributions of the chimerism within fast and slow subsets of CD4 TCM and TEM; red and lilac indicate the linear and branched model predictions, respectively. Points represent experimentally observed donor fractions within early-stage double-positive thymocytes (DP1), naive T cells, and CD4 TCM and TEM derived from lymph nodes. The data underlying this figure can be found in S1 Data.
Fig 7
Fig 7. Validation of the structure and predictions of the models of memory CD4 T cell dynamics.
(A) CD4 TEM after tamoxifen treatment, pretransfer, with Ki67 expression stratified by YFP expression. (B) Proportions of cells in bulk, YFP+ and YFPCD4 TEM expressing Ki67 at days 0 and 7 after transfer. (C) Empirical description (fitted green curve) of the observed timecourse of the frequency of mTom+ cells within the naive CD4 T cell pool, after tamoxifen treatment of CD4 reporter mice. Dilution is driven by the influx of unlabelled cells from the thymus. (D) Observed and predicted frequencies of mTom+ cells within the CD4 TCM and TEM following tamoxifen treatment. Shaded regions span the 2.5 and 97.5 percentiles of the distribution of predicted trajectories, generated by sampling 1,000 sets of parameters from their joint posterior distribution. The data underlying this figure can be found in S1 Data.

Update of

Similar articles

Cited by

References

    1. Swain SL, Agrewala JN, Brown DM, Jelley-Gibbs DM, Golech S, Huston G, et al.. CD4+ T-cell memory: generation and multi-faceted roles for CD4+ T cells in protective immunity to influenza. Immunol Rev. 2006;211(1):8–22. doi: 10.1111/j.0105-2896.2006.00388.x - DOI - PMC - PubMed
    1. Tubo NJ, Jenkins MK. CD4+ T Cells: guardians of the phagosome. Clin Microbiol Rev. 2014;27(2):200–213. doi: 10.1128/CMR.00097-13 - DOI - PMC - PubMed
    1. Künzli M, Masopust D. CD4+ T cell memory. Nat Immunol. 2023;16:4. doi: 10.1038/s41590-023-01510-4 - DOI - PMC - PubMed
    1. Westera L, Drylewicz J, den Braber I, Mugwagwa T, van der Maas I, Kwast L, et al.. Closing the gap between T-cell life span estimates from stable isotope-labeling studies in mice and humans. Blood. 2013;122(13):2205–2212. doi: 10.1182/blood-2013-03-488411 - DOI - PubMed
    1. Gossel G, Hogan T, Cownden D, Seddon B, Yates AJ. Memory CD4 T cell subsets are kinetically heterogeneous and replenished from naive T cells at high levels. Elife 2017;6:e23013. doi: 10.7554/eLife.23013 - DOI - PMC - PubMed