. 2024 Aug 13;17(849):eadk5736.
doi: 10.1126/scisignal.adk5736. Epub 2024 Aug 13.

Phosphorylation patterns in the AT1R C-terminal tail specify distinct downstream signaling pathways

Affiliations

Phosphorylation patterns in the AT1R C-terminal tail specify distinct downstream signaling pathways

Clarice Gareri et al. Sci Signal. .

Abstract

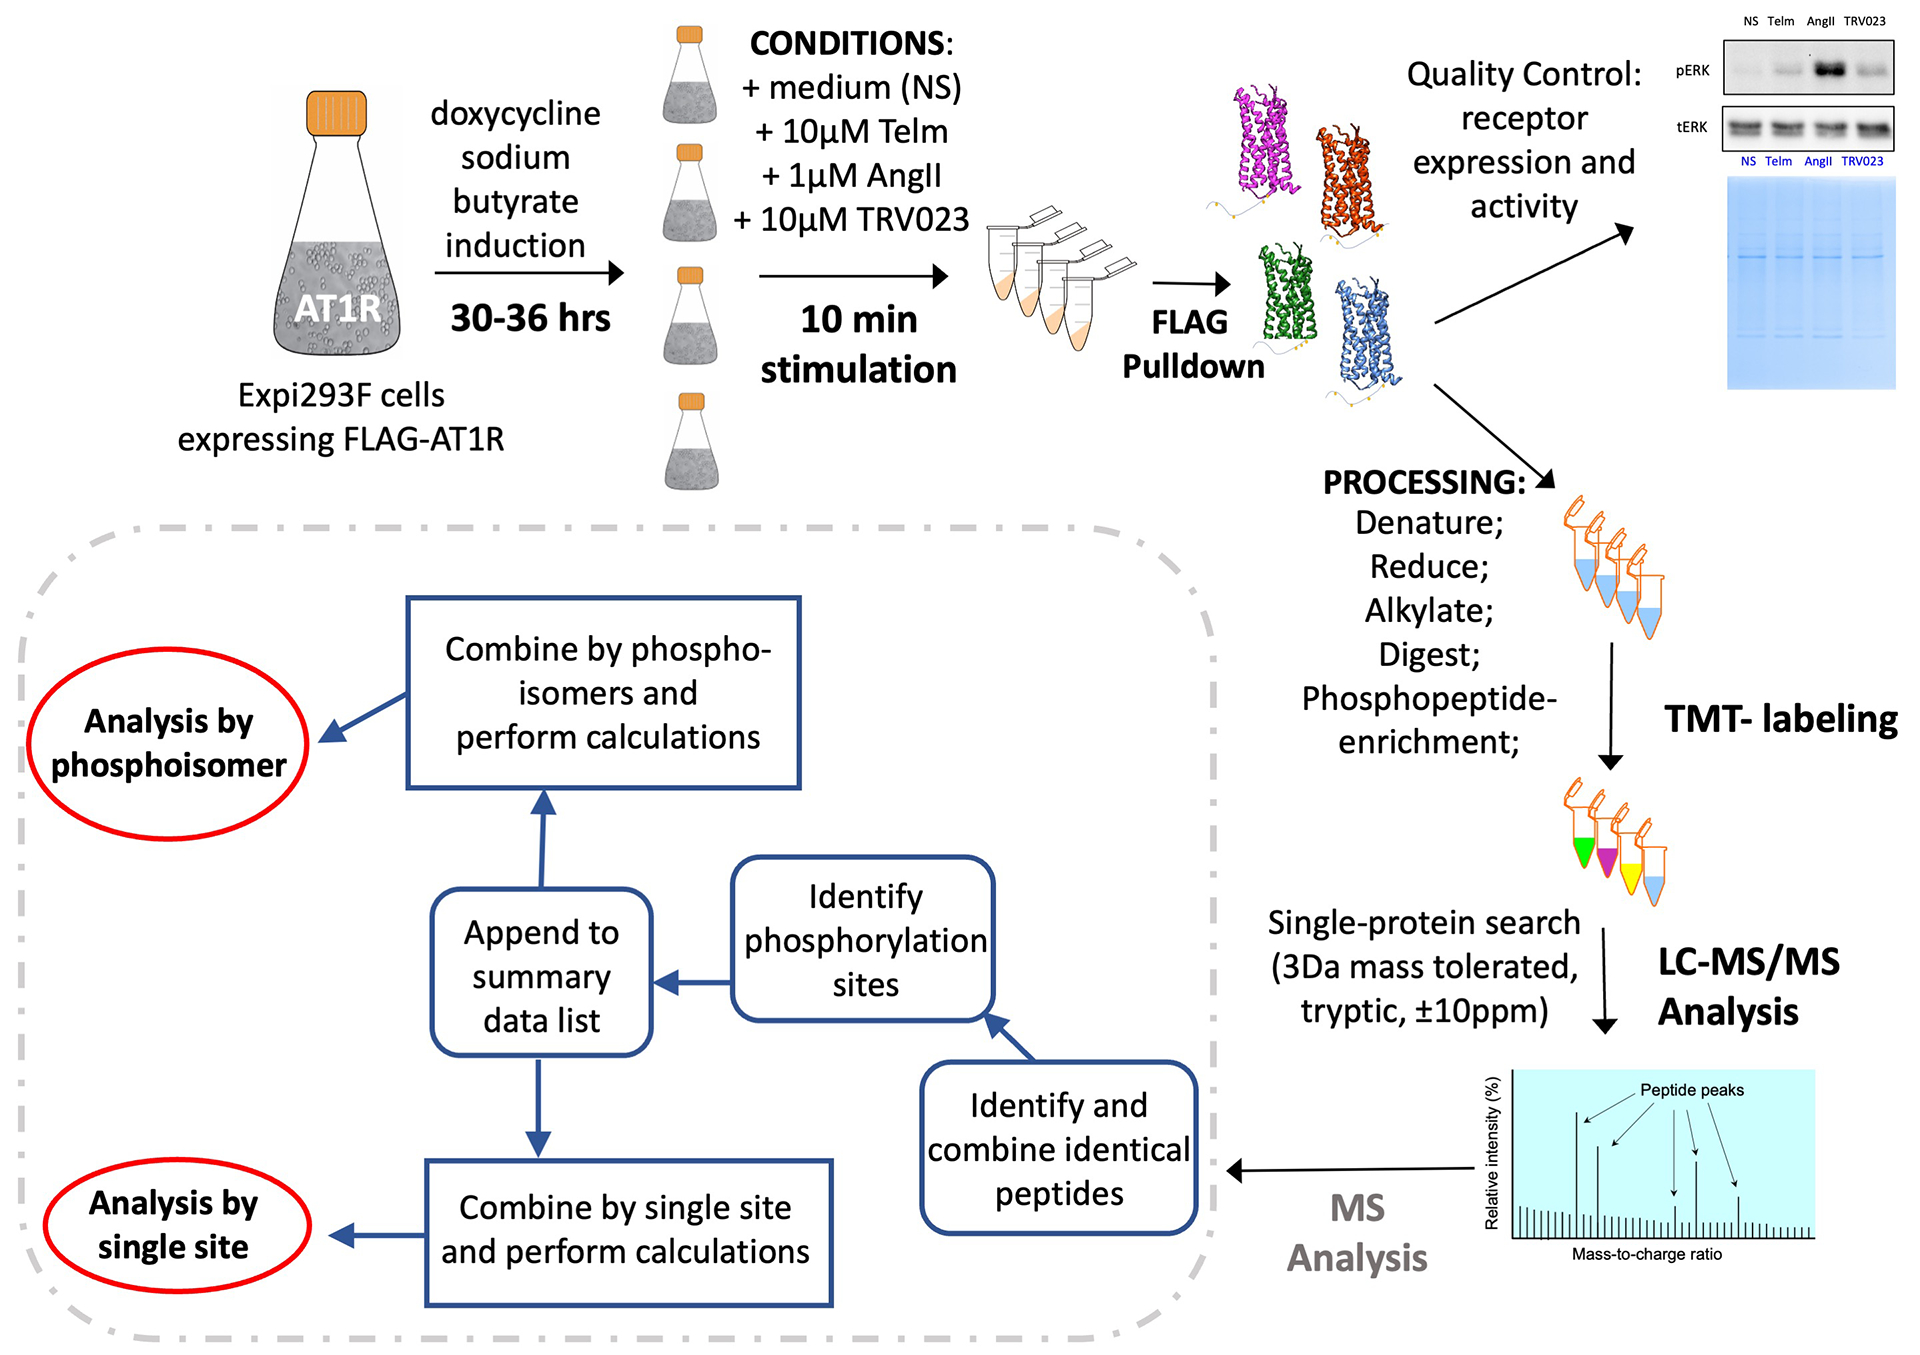
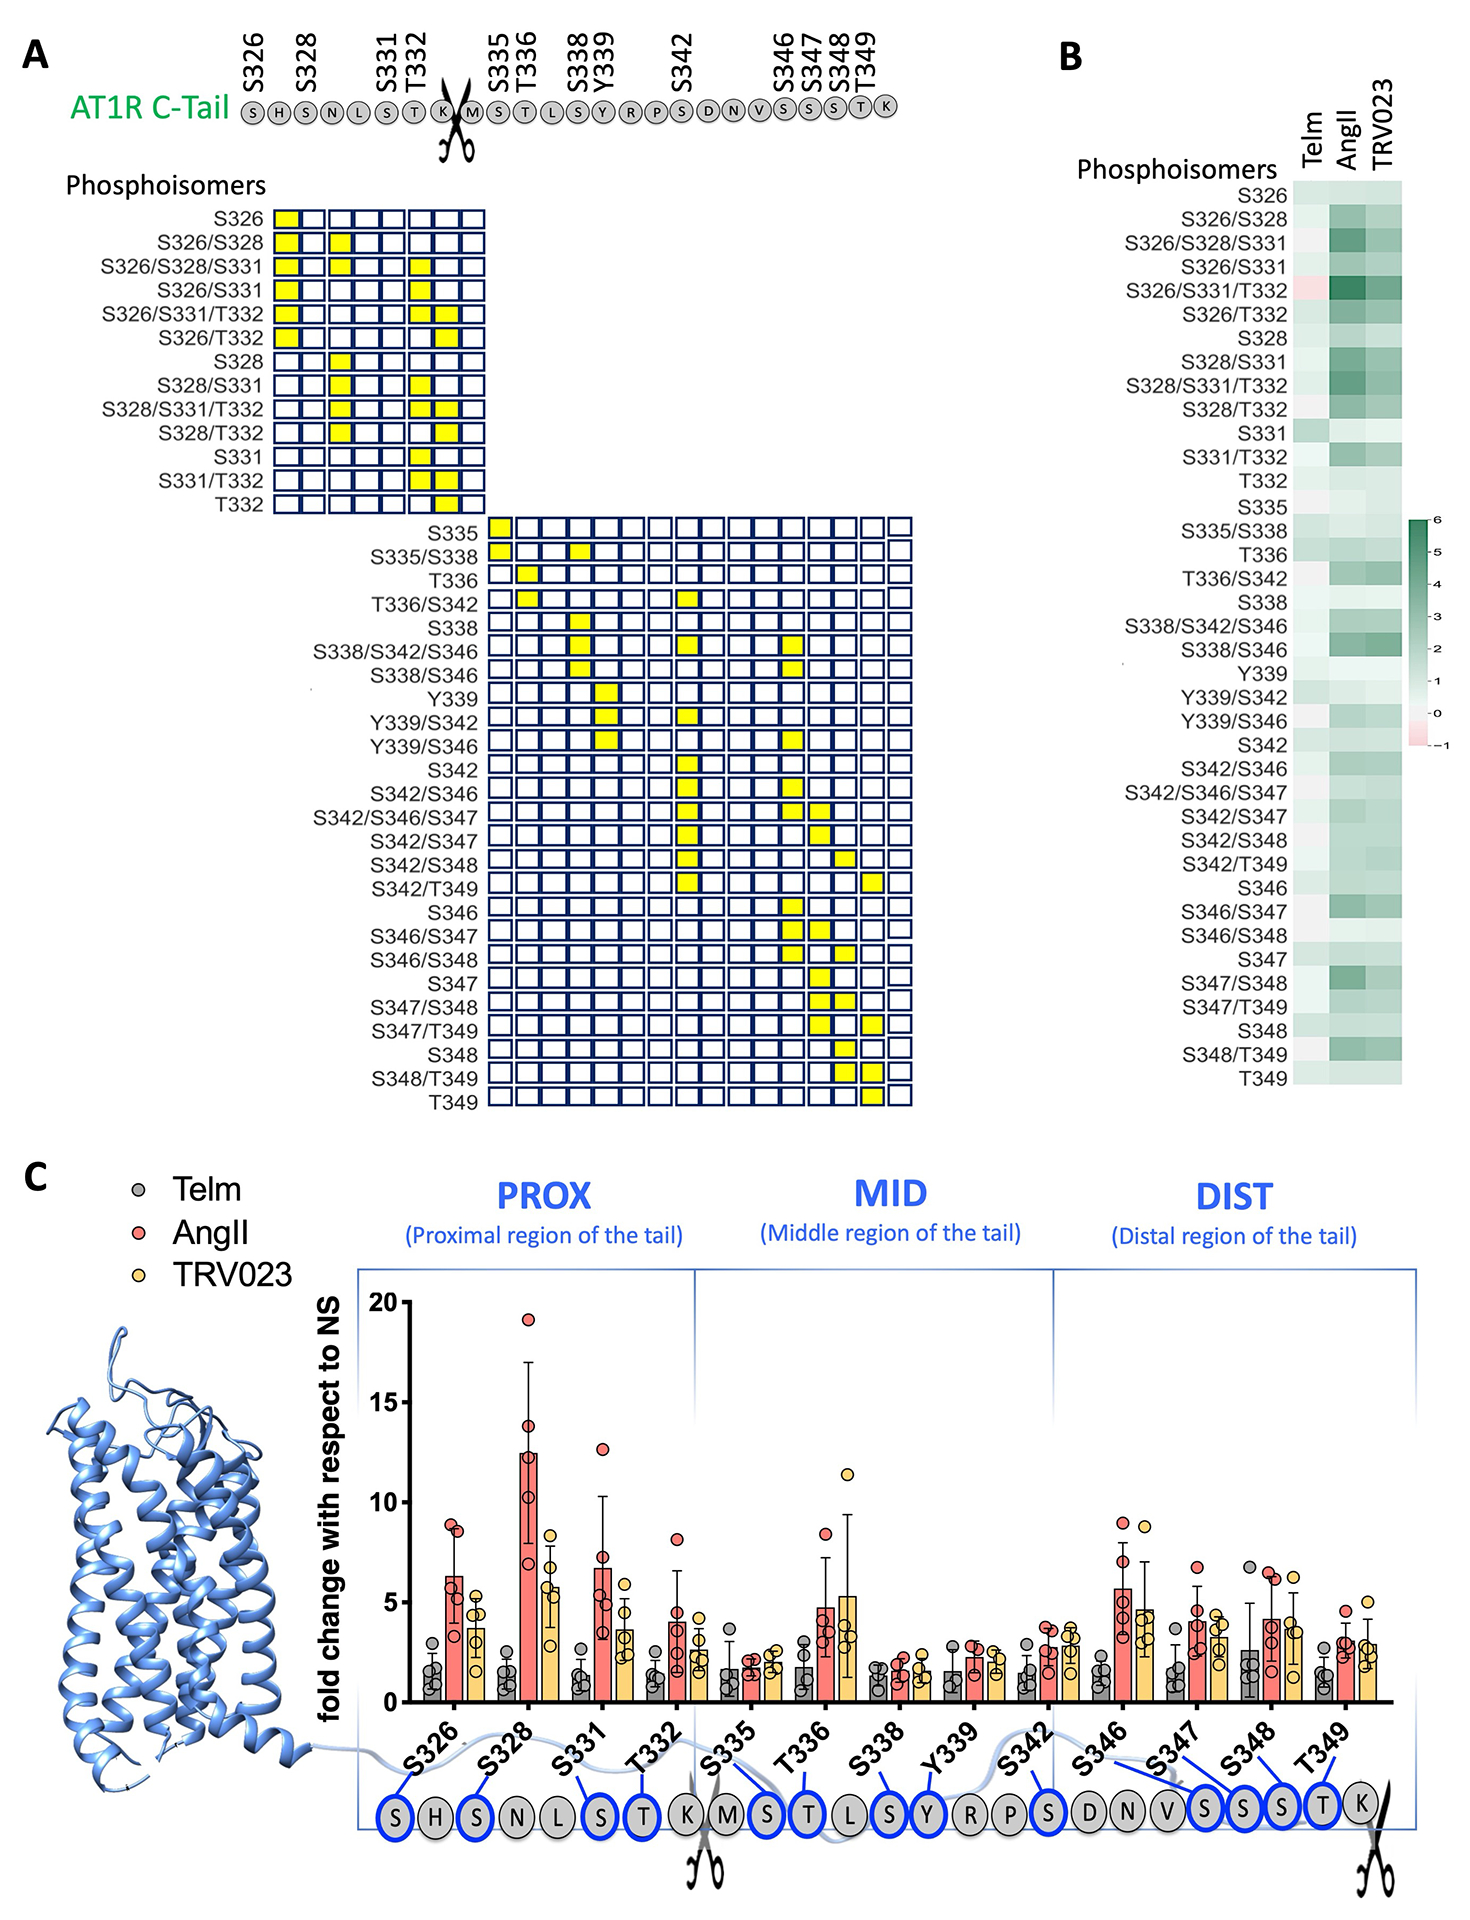
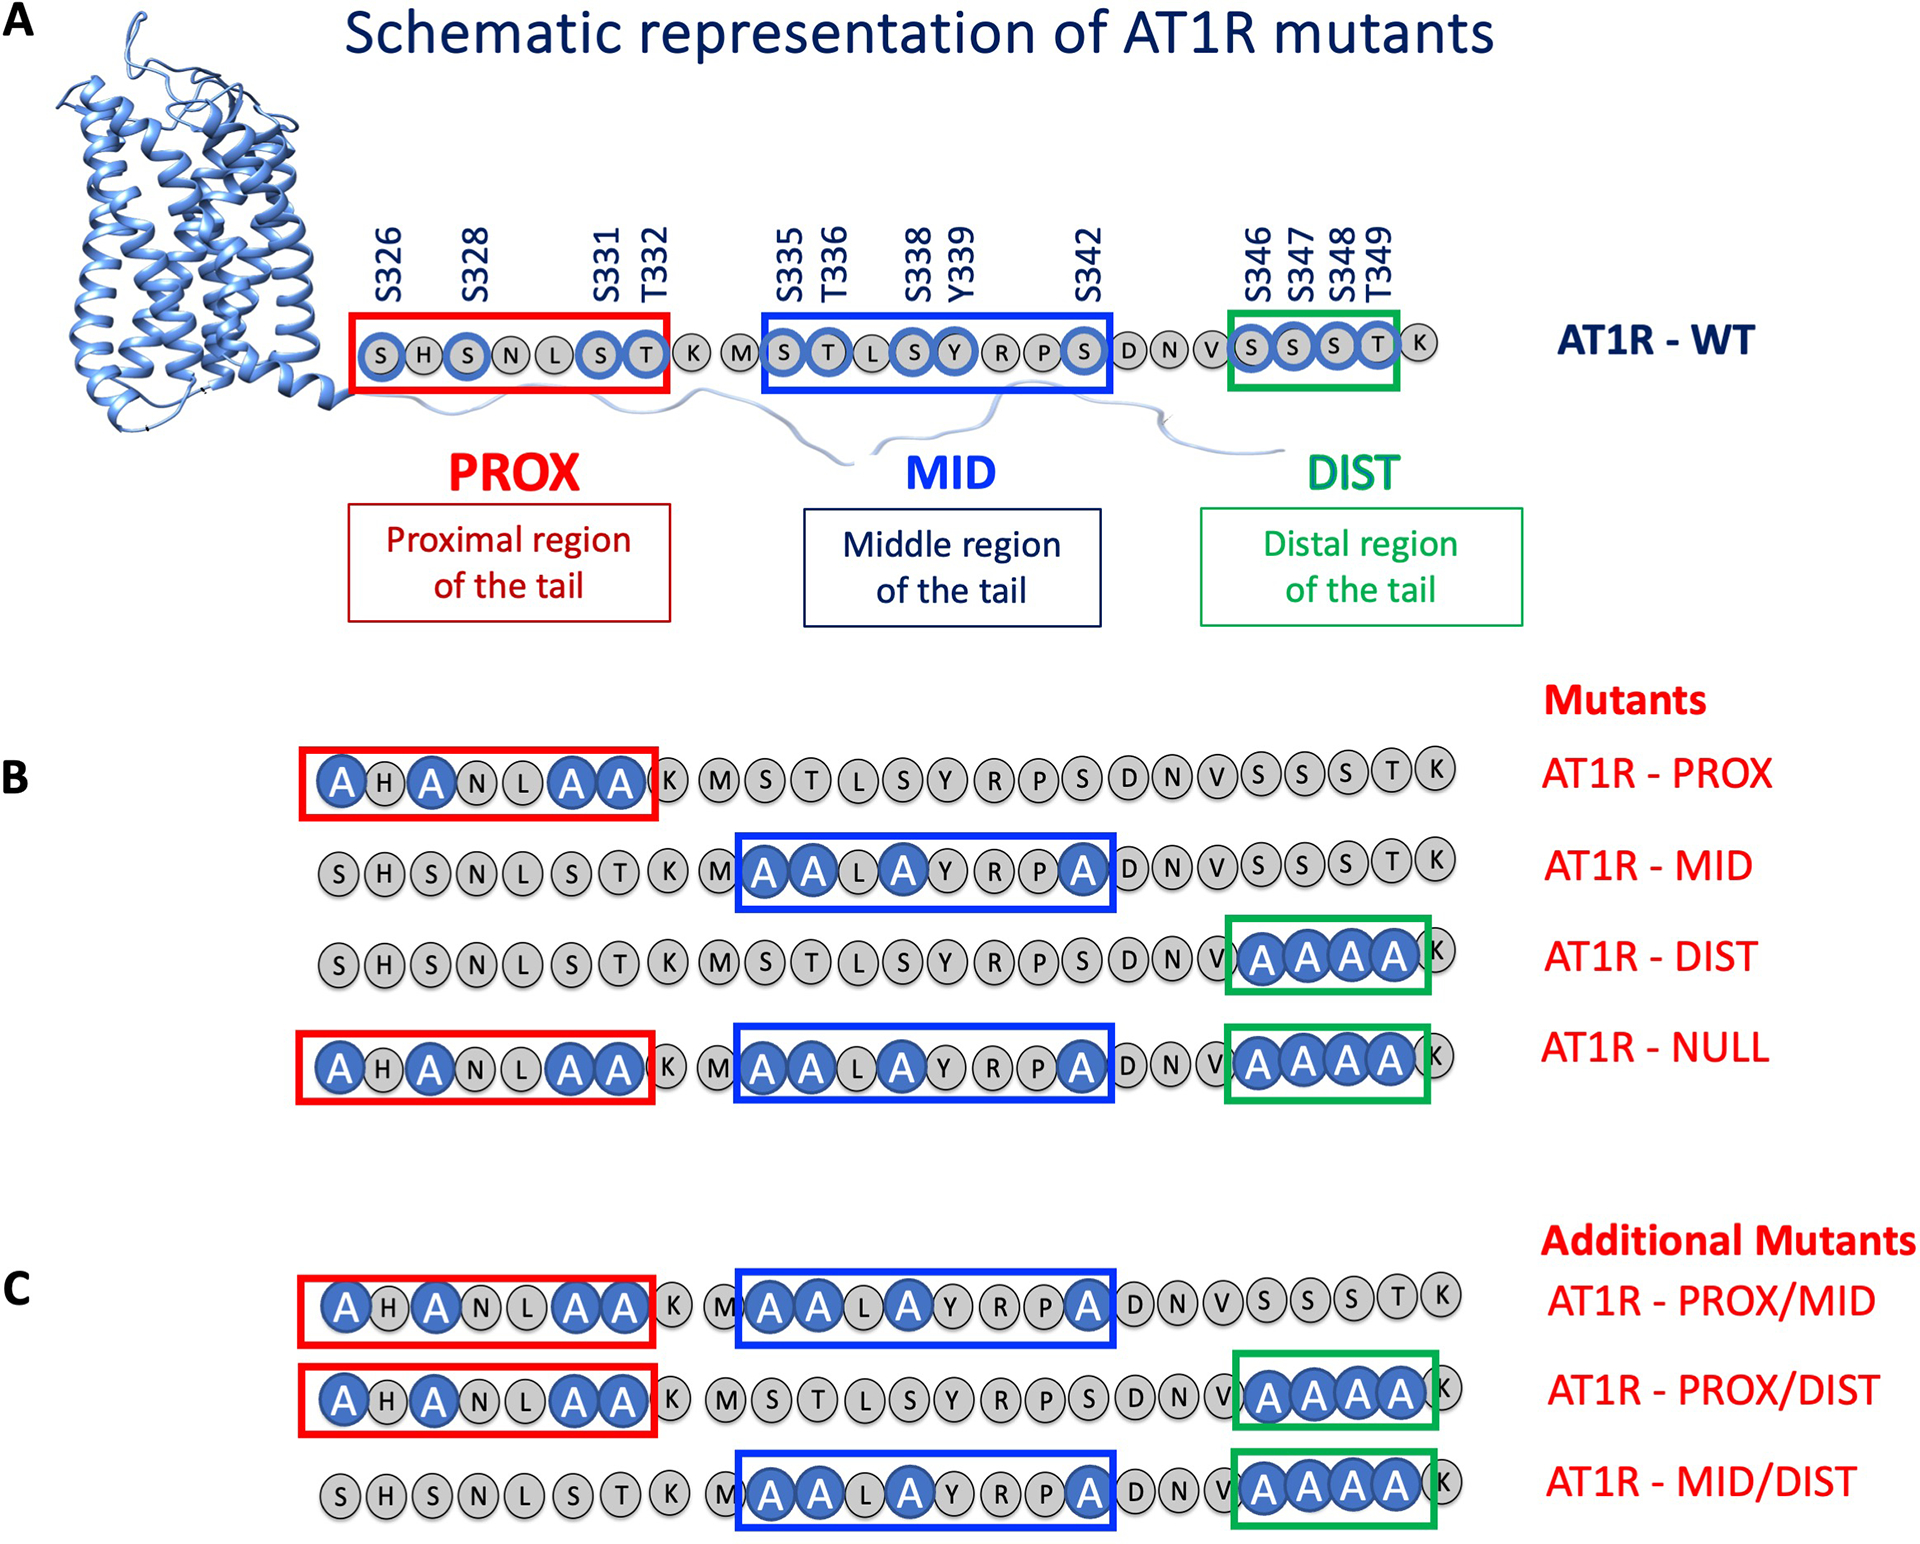
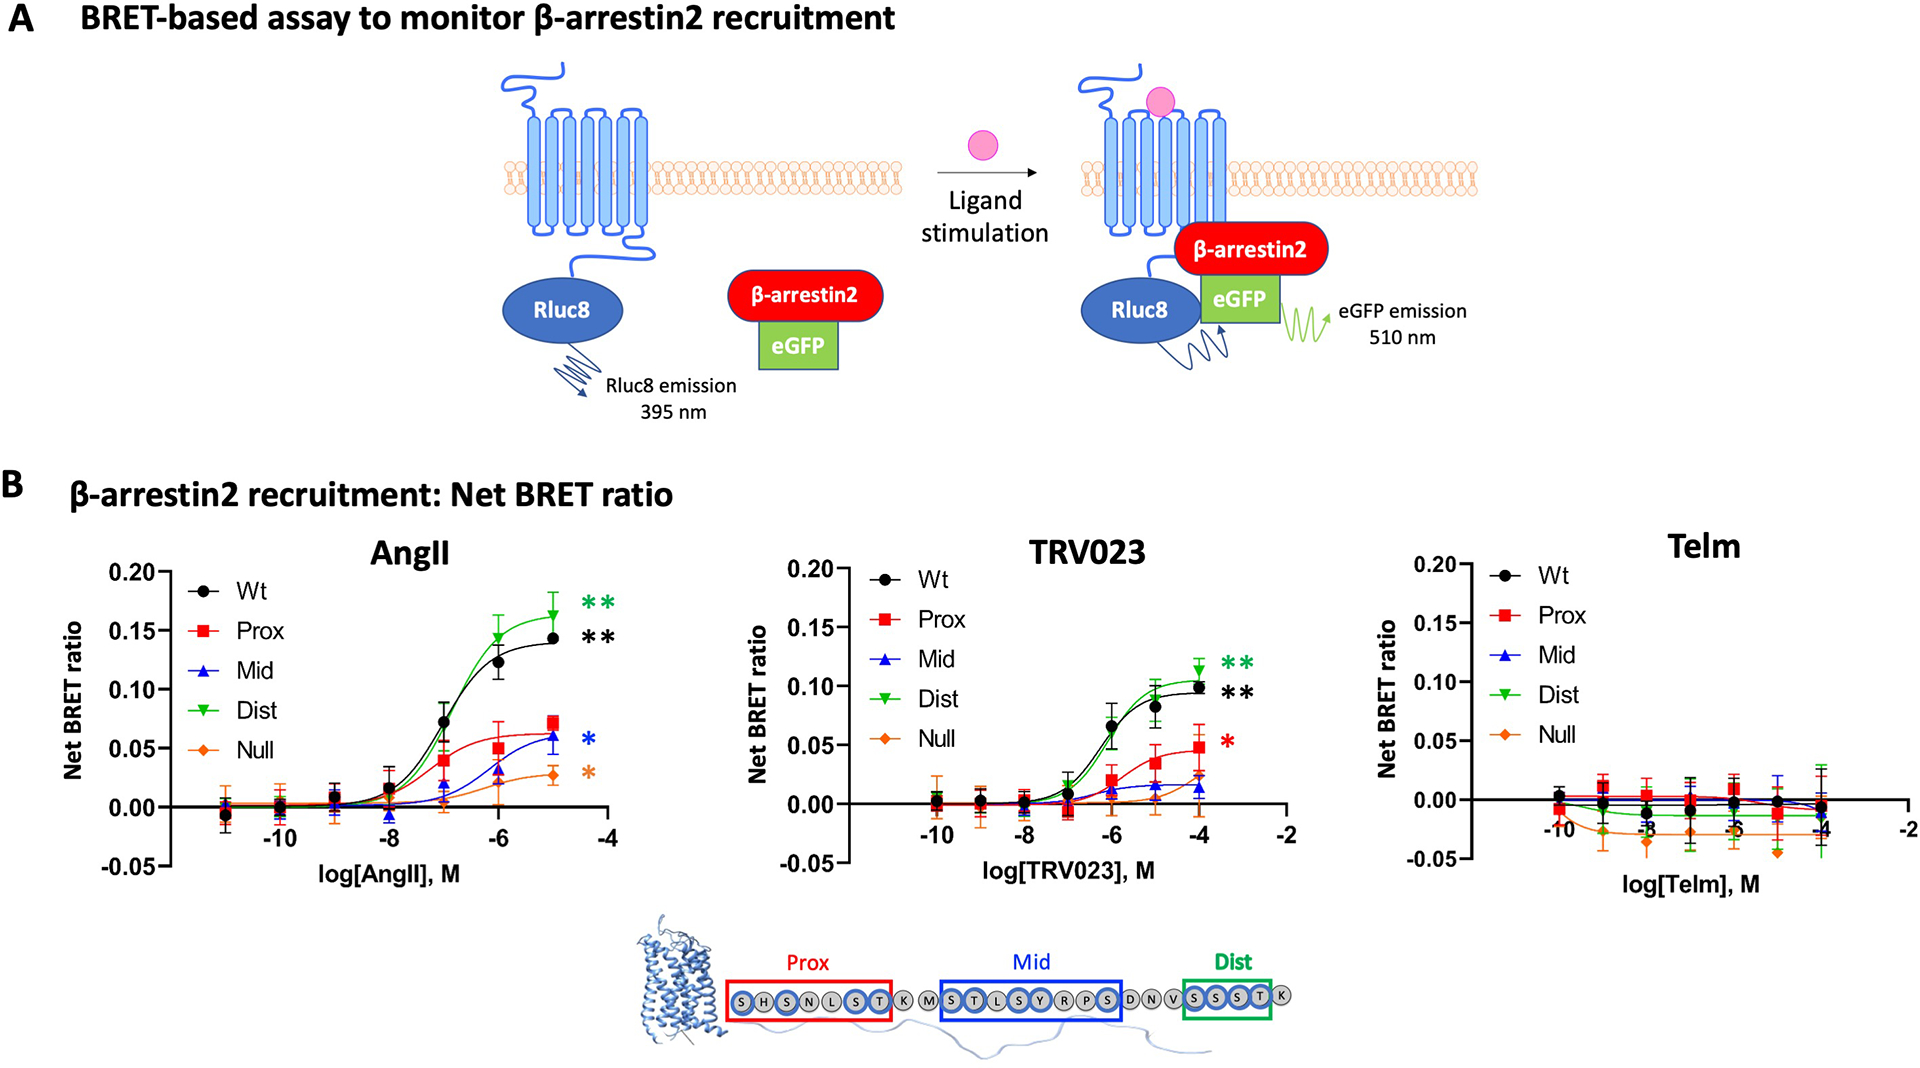
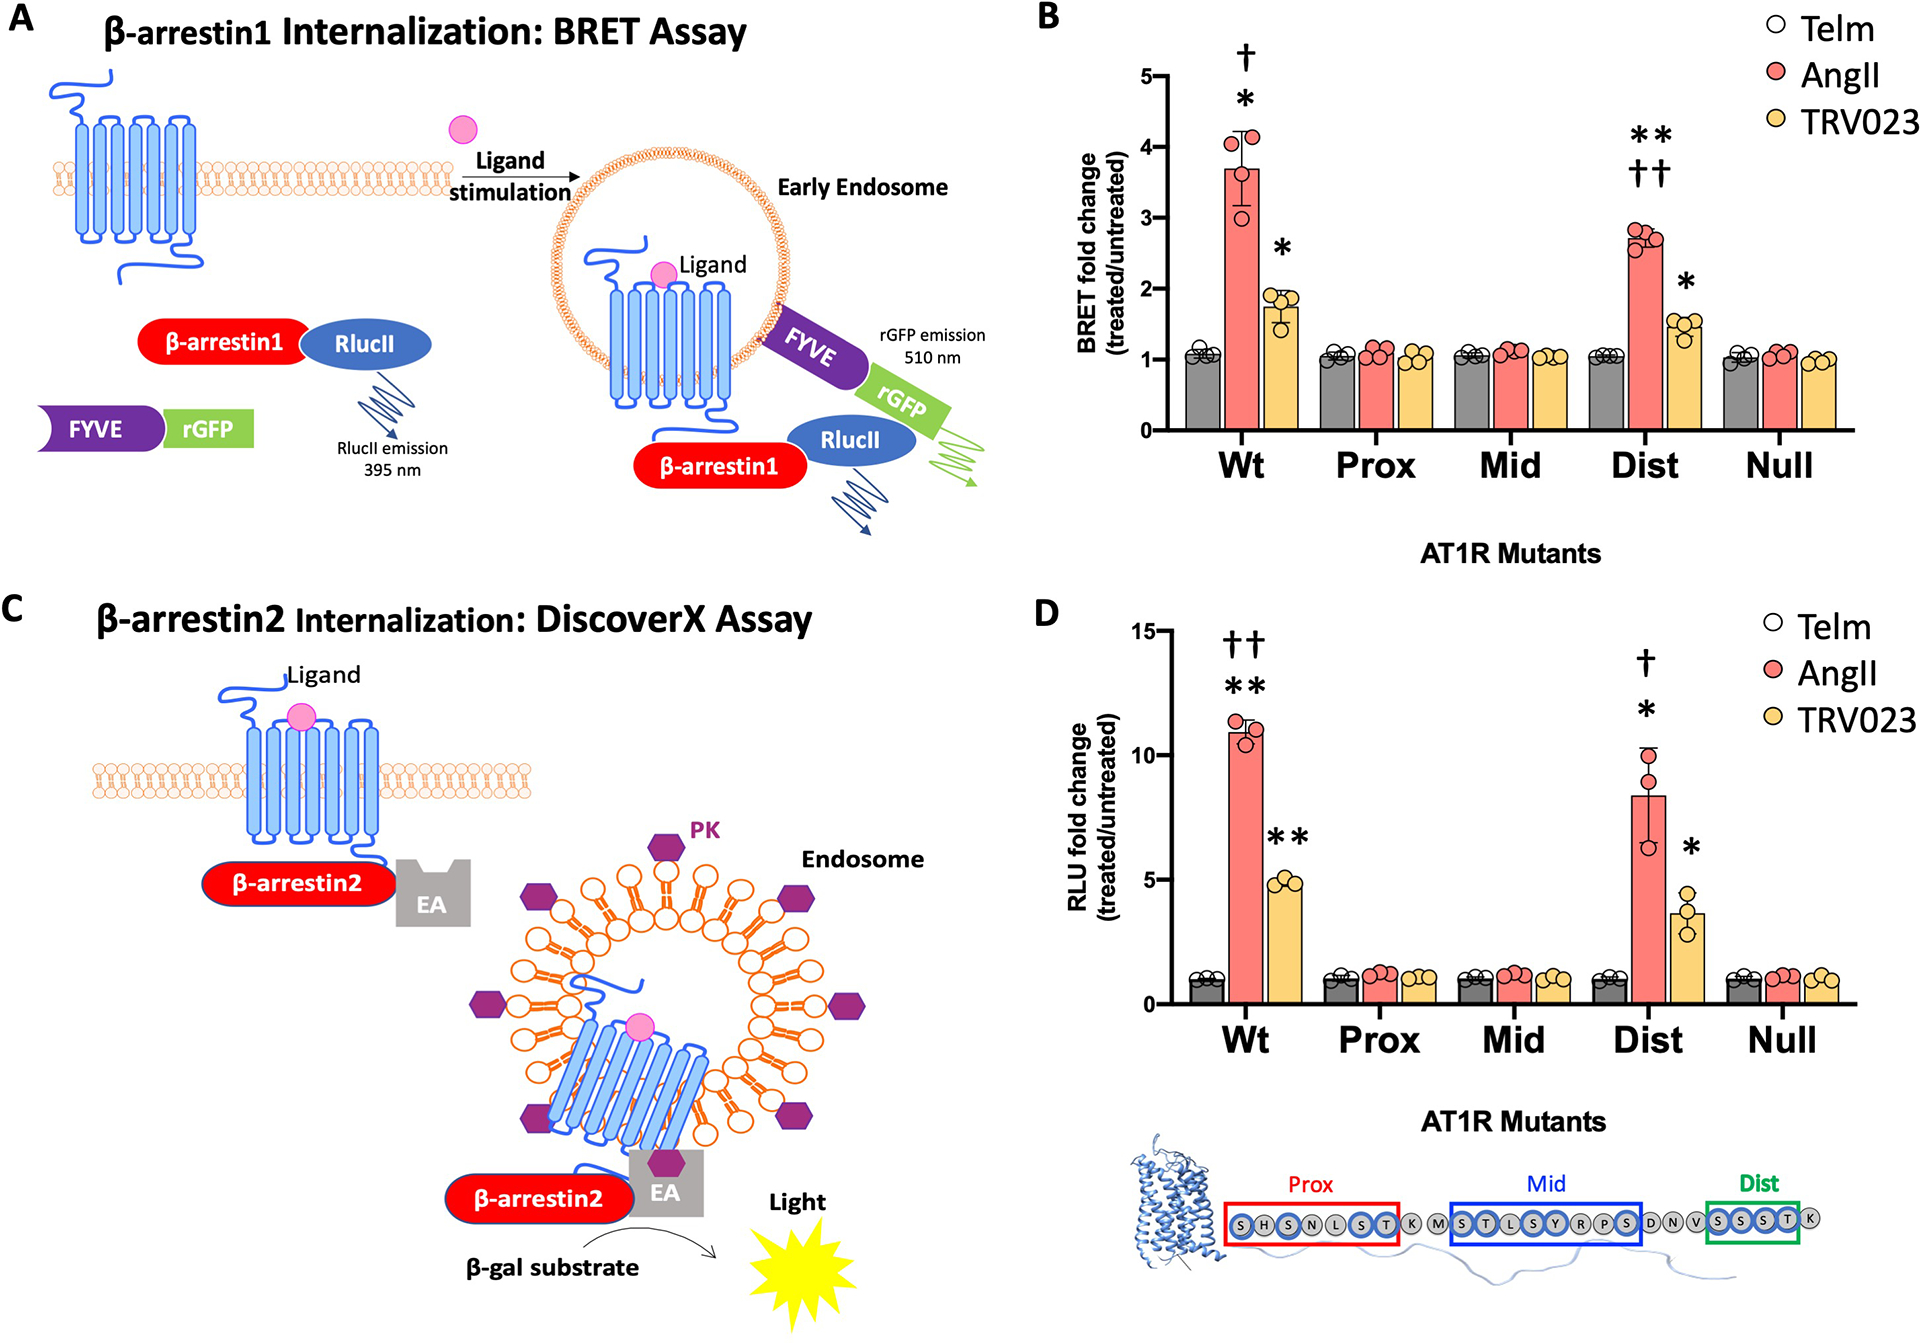
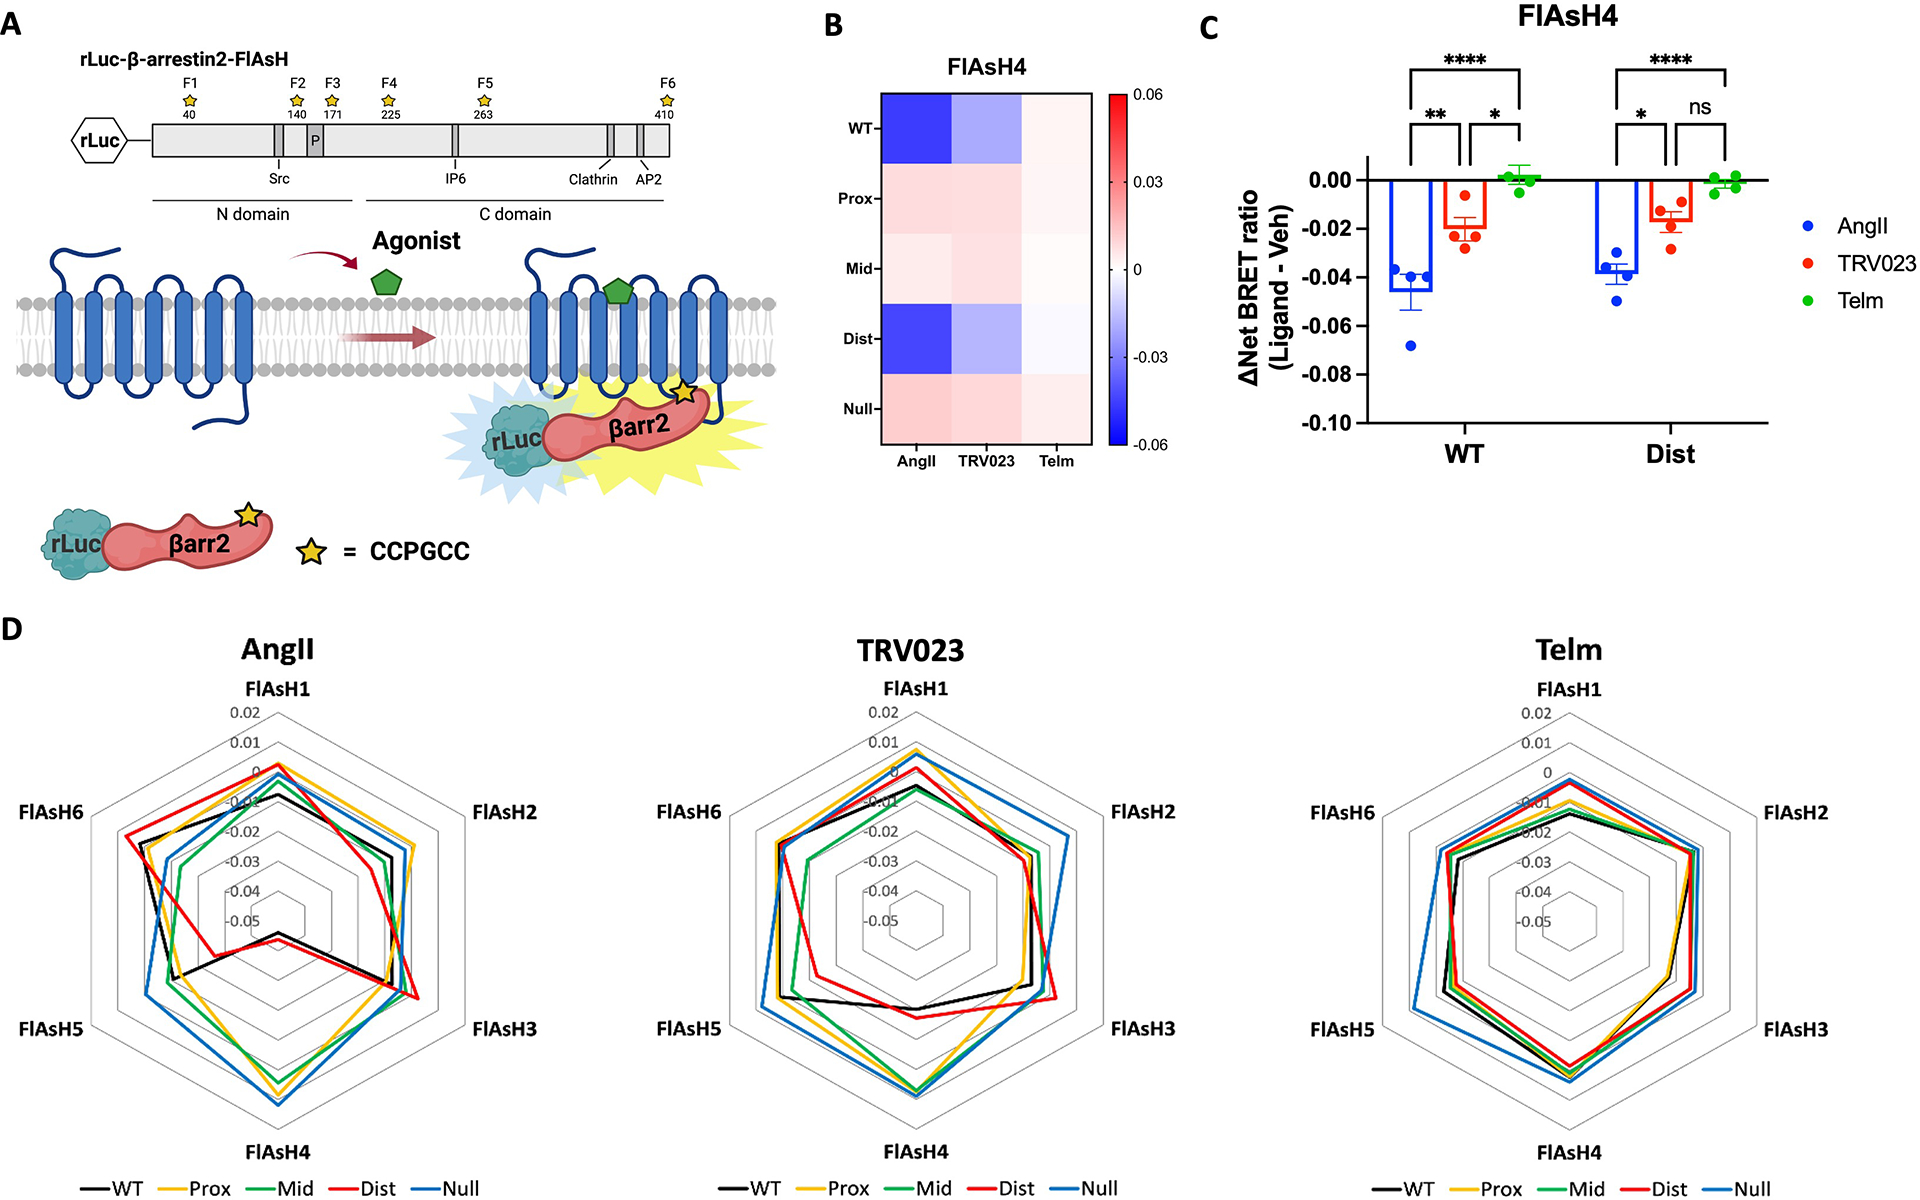
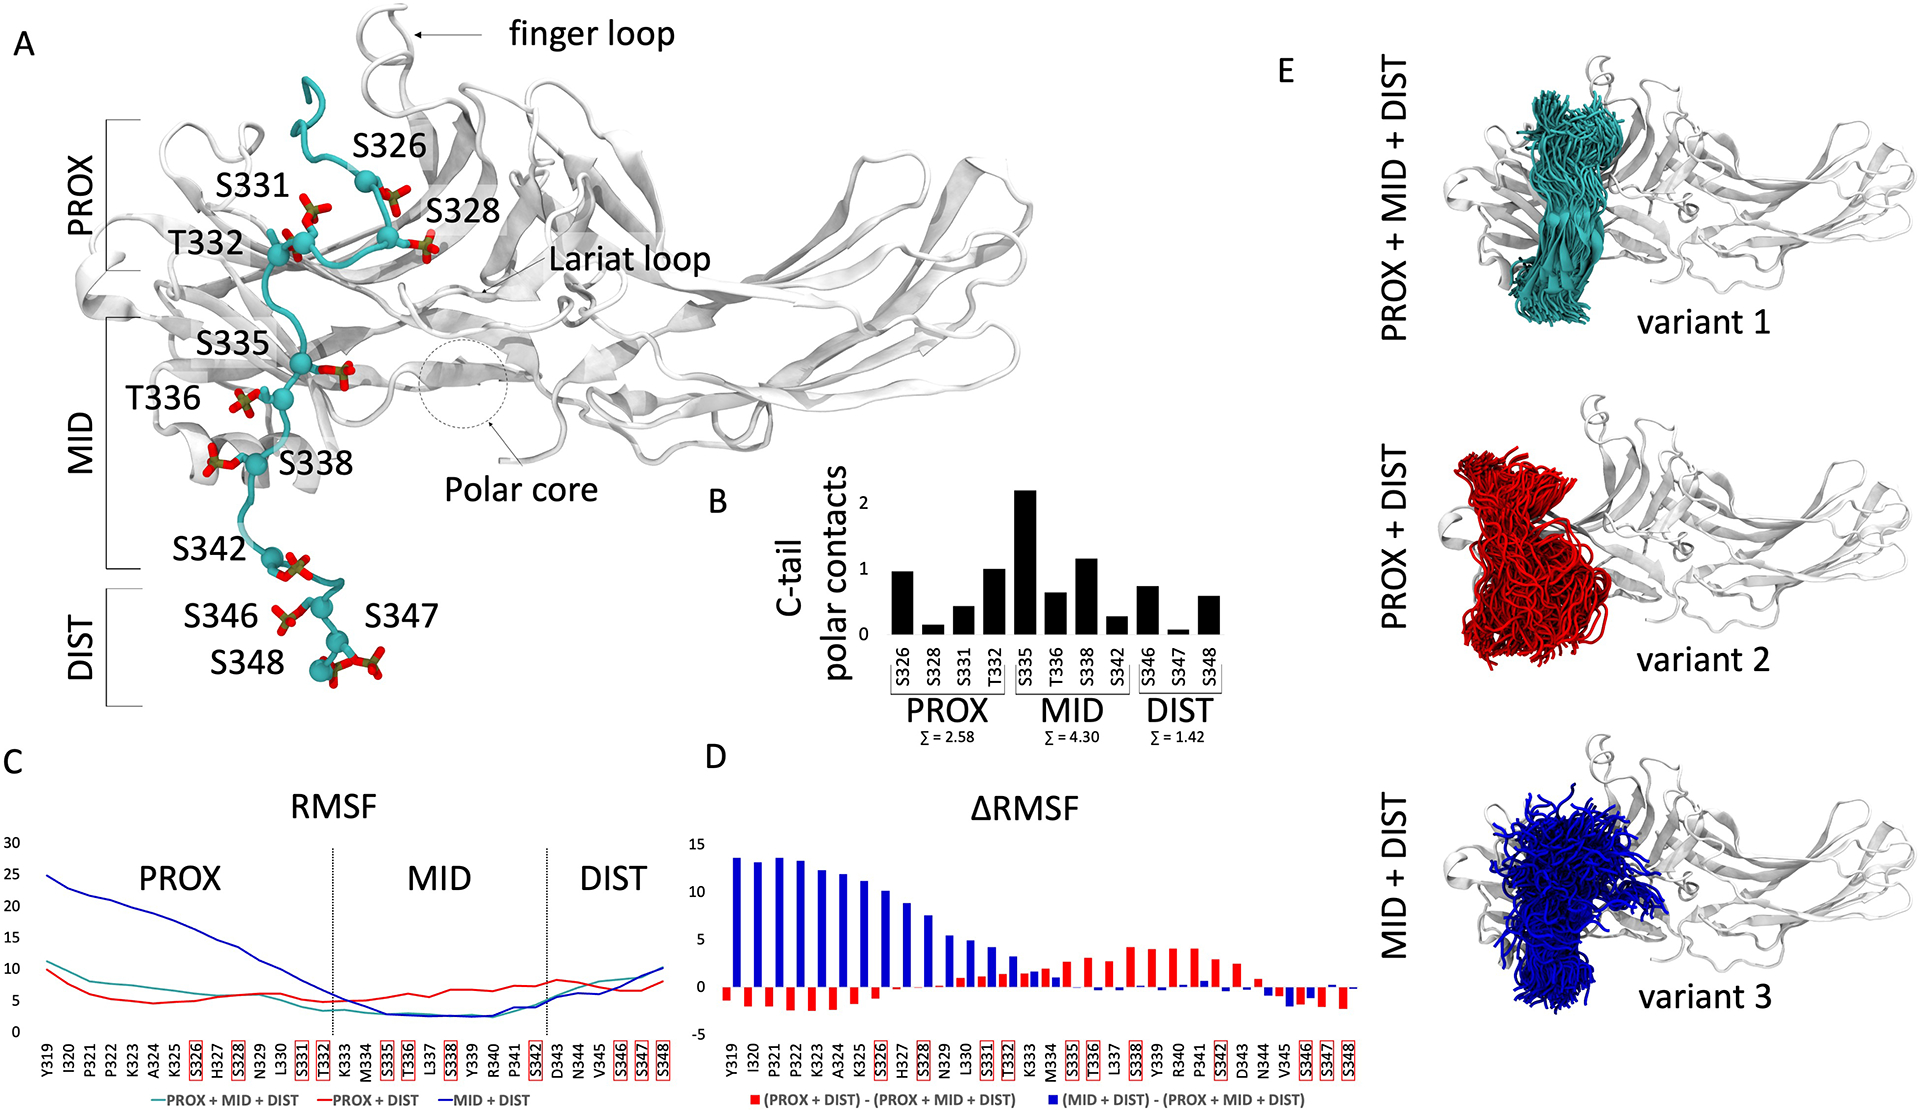
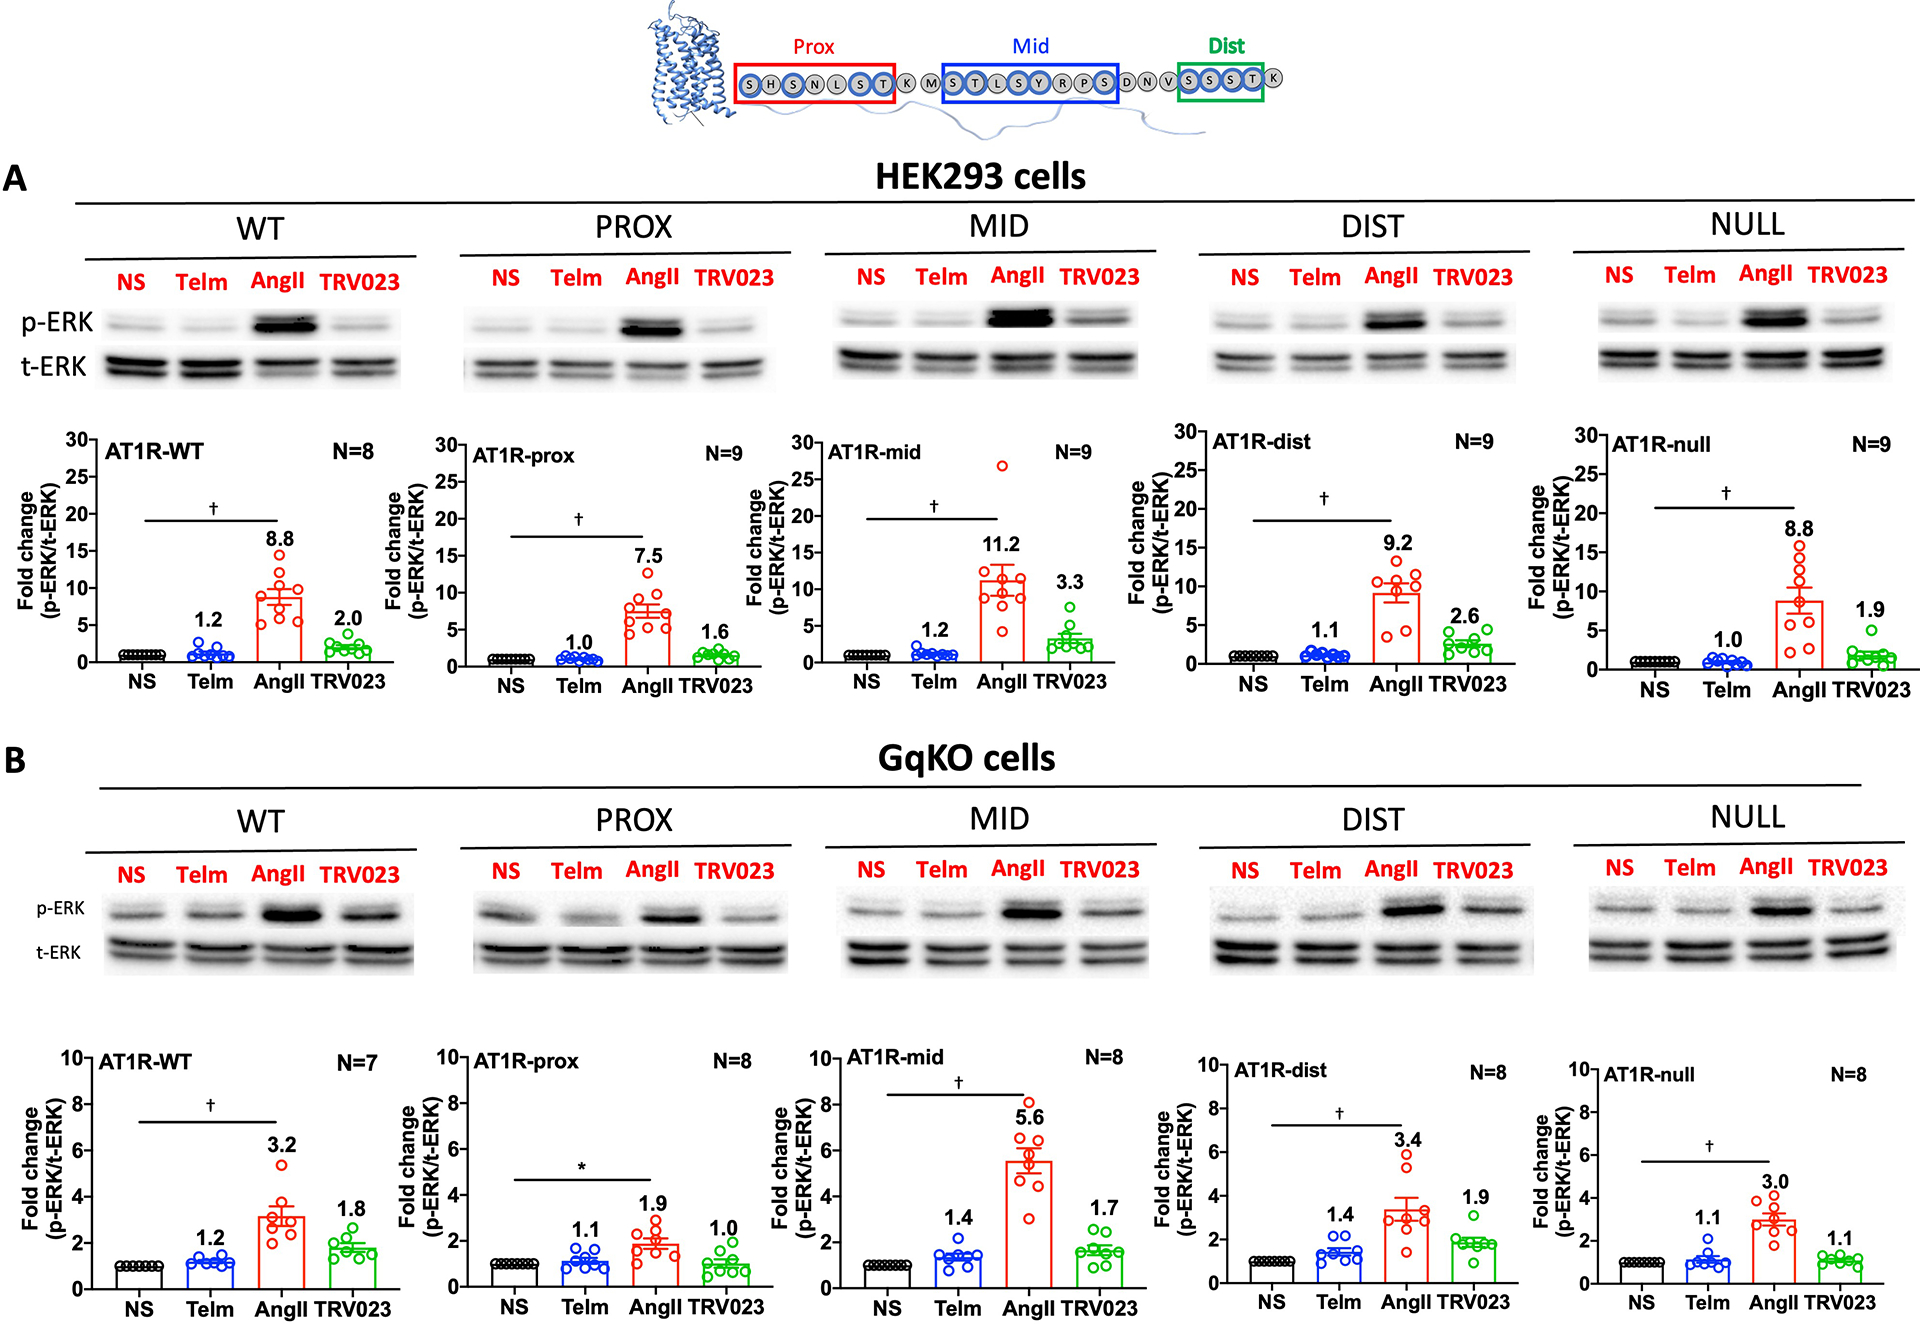
Different ligands stabilize specific conformations of the angiotensin II type 1 receptor (AT1R) that direct distinct signaling cascades mediated by heterotrimeric G proteins or β-arrestin. These different active conformations are thought to engage distinct intracellular transducers because of differential phosphorylation patterns in the receptor C-terminal tail (the "barcode" hypothesis). Here, we identified the AT1R barcodes for the endogenous agonist AngII, which stimulates both G protein activation and β-arrestin recruitment, and for a synthetic biased agonist that only stimulates β-arrestin recruitment. The endogenous and β-arrestin-biased agonists induced two different ensembles of phosphorylation sites along the C-terminal tail. The phosphorylation of eight serine and threonine residues in the proximal and middle portions of the tail was required for full β-arrestin functionality, whereas phosphorylation of the serine and threonine residues in the distal portion of the tail had little influence on β-arrestin function. Similarly, molecular dynamics simulations showed that the proximal and middle clusters of phosphorylated residues were critical for stable β-arrestin-receptor interactions. These findings demonstrate that ligands that stabilize different receptor conformations induce different phosphorylation clusters in the C-terminal tail as barcodes to evoke distinct receptor-transducer engagement, receptor trafficking, and signaling.


Conflict of interest statement

Competing interests: Dr. Rockman is a scientific cofounder of Trevena, Inc. Dr. Wingler is a scientific advisor for Septerna, Inc. The other authors declare that they have no competing interests.

Figures

Fig. 1.
Fig. 1.. Schematic representation of LC-MS/MS sample preparation and analysis.
Expi293F cells were induced to express N-terminal FLAG-tagged human WT AT1R (FLAG-AT1R) for 30–36h. Separate cell suspensions were then stimulated for 10 mins with the endogenous ligand AngII, the β-arrestin–biased ligand TRV023, or pretreated with the AT1R antagonist Telm for 24h. A separate cell suspension was not stimulated (NS). The receptor was purified by FLAG pulldown, digested, and labeled with TMT probes. The peptides were enriched for the phosphopeptides by High-Select Fe-NTA Phosphopeptide Enrichment Kit and analyzed by liquid chromatography-tandem MS. n = 5 experiments for each treatment condition. The MS data have been combined and analyzed by phosphoisomers or single phosphorylation site.
Fig. 2.
Fig. 2.. Identification of ligand-specific AT1R C-terminal tail phosphorylation patterns.
(A) Graphical representation of the location of phosphorylated sites (yellow squares) along the C-terminal tail peptides (open squares). Scissors indicate the trypsin cleavage site. (B) Heatmap showing the amounts of phosphorylation of the indicated AT1R C-terminal tail phosphoisomers in AT1R-expressing Expi293F cells stimulated the AT1R inhibitor Telm, the full AT1R agonist Angiotensin II (AngII), and the β-arrestin-biased AT1R agonist TRV023. Quantitative data were obtained by MS and are reported as fold change compared to cells that were not stimulated (NS). All of the phosphoisomers identified by MS after post-database searching analysis are included in the heatmap. N=5 independent experiments per treatment group. (C) Intensity of each single phosphosite in the proximal (PROX), middle (MID), and distal (DIST) portions of the AT1R C-terminal tail after stimulation with Telm, AngII, or TRV023, as determined from the single-site analysis (see Materials and Methods). N=5 independent experiments per treatment group.
Fig. 3.
Fig. 3.. AT1R C-terminal tail mutants generated in this study.
(A) Schematic showing the serine, threonine, and tyrosine residues in the proximal (PROX), middle (MID), and distal (DIST) regions of the C-terminal tail of AT1R that were phosphorylated upon receptor stimulation. (B) All of the phosphorylatable serine and threonine residues within a region were substituted with alanine in the AT1R-PROX, AT1R-MID and AT1R-DIST mutant proteins. All the phosphorylatable serine and threonine sites were changed to alanine in the AT1R-NULL mutant protein. (C) Additional AT1R mutants with a combination of substitutions in two regions were also generated, AT1R-PROX/MID, AT1R-PROX/DIST, and AT1R-MID/DIST.
Fig. 4.
Fig. 4.. β-arrestin recruitment to AT1R C-terminal tail PROX and MID mutants is reduced.
(A) Illustration of the BRET-based assay to monitor β-arrestin recruitment. RLuc8-tagged AT1R is the energy donor, and eGFP-tagged β-arrestin is the energy acceptor. Ligand-induced recruitment of β-arrestin to AT1R increases the BRET signal. (B) HEK293 cells were transfected with RLuc8-tagged WT or mutant AT1R proteins and β-arrestin-eGFP then treated with AngII, TRV023, or Telm at the indicated concentrations for 10 min before BRET measurement. The net change BRET ratio (eGFP:RLuc8) is expressed as the difference between ligand-treated and untreated groups. Statistical comparisons were performed using two-way ANOVA with Sidak correction for multiple comparisons test. N=5 (AngII and TRV023) or 3 (Telm) independent experiments per treatment group. Data are shown as mean±SD. *P< 0.05, **P<0.001, ligand at highest concentration vs. untreated group.
Fig. 5.
Fig. 5.. AT1R C-terminal tail PROX and MID mutants prevent β-arrestin internalization.
(A) Illustration of the BRET-based assay to monitor β-arrestin internalization. HEK293 cells were cotransfected with AT1R, the BRET donor β-arrestin1-RlucII, and the endosome-localized BRET acceptor FYVE-eGFP. Ligand-induced internalization of AT1R increases the BRET signal. (B) Ligand-induced changes in the BRET ratio in HEK293 cells coexpressing β-arrestin1-RlucII, FYVE-eGFP, and the indicated WT or mutant forms of AT1R. The BRET changes upon treatment with AngII, TRV023, or Telm are expressed as a fold change of the BRET ratio observed in the untreated cells. N = 4 independent experiments per group. Data represent the mean ± SD. (C) Illustration of the DiscoverX assay to monitor β-arrestin internalization. This assay is based on reconstitution of β-galactosidase (β-gal) activity by the interaction of enzyme acceptor (EA) and donor (ED) fragments. AT1R was transfected into U2OS cells that stably express EA-tagged β-arrestin2 and an endosome-localized ProLink ED (PK). Activation of the AT1R induces β-arrestin2 recruitment, followed by internalization of the At1R–β-arrestin-EA complex in PK-tagged endosomes. The resulting functional β-gal enzyme hydrolyzes substrate to generate a chemiluminescent signal. (D) Ligand-induced β-arrestin internalization in U2OS cells stably expressing β-arrestin2-EA and endosomal PK and transfected with WT or mutant AT1R. The changes in luminescence upon treatment with AngII, TRV023, or Telm are expressed as a fold of luminescence observed in untreated cells. N = 3 independent experiments per group. Data represent the mean ± SD. Statistical comparisons were performed using two-way ANOVA with Tukey’s multiple comparisons test. *P< 0.05, **P<0.005, ligand vs. untreated for same receptor mutant. †P< 0.05, ††P< 0.005 AngII vs. TRV023 for WT and DIST mutant.
Fig. 6.
Fig. 6.. β-arrestin2 conformations depend on phosphorylation of clusters of residues within the proximal and middle region of the C-tail.
(A) Schematic of rLuc-β-arrestin2-FlAsH BRET reporters (FlAsH 1–FlAsH6, F1–F6) to detect ligand-induced conformational changes of β-arrestin2. The tetracysteine motif CCPGCC was inserted after amino acid residues 40, 140, 171, 225, 263, or 410 of β-arrestin2. This motif binds to an exogenously supplied arsenic-containing fluorescein derivative (FlAsH-EDT2) that acts as the BRET acceptor for rLuc. The change in BRET signal between the rLuc fused to the N-terminus of β-arrestin2 and the CCPGCC-targeted fluorescein arsenical acceptor located at one of the six locations within β-arrestin2 reflects β-arrestin2 conformational change. The Src, inositol hexaphosphate (IP6), clathrin, and AP2 interaction sites in β-arrestin2 are noted as well as the phosphorylation site (P). (B and C) FlAsH4 BRET signals following ligand stimulation of the indicated WT and mutant AT1R proteins. HEK293 cells were transfected with the rLuc-β-arrestin2-FlAsH4 reporter and WT or mutant AT1R. Cells were labeled with FlAsH-EDT2 or HBSS (mock labeling) and then treated with AngII (1μM), TRV023 (10 μM), Telm(10 μM), or vehicle 10 min before BRET measurement. The average BRET ratios from mock-labeled cells (background) were subtracted from those of FlAsH4-labeled cells to obtain the net BRET ratios. The ΔNet BRET ratio was calculated by subtracting the Net BRET ratio of vehicle-treated cells from the Net BRET ratio of ligand-stimulated cells. The heatmap shows the ΔNet BRET ratio for all WT and mutant AT1R proteins (B). The graph shows the ΔNet BRET ratio for WT AT1R an AT1R-DIST only (C). N = 4 independent experiments per group. (D) Radar charts showing β-arrestin2 conformational signatures from the six FlAsH sensors with WT and mutant AT1R proteins upon stimulation with AngII, TRV023, or Telm. N=4 independent experiments per group. Data represents the mean ± SEM. Statistical comparisons were performed using two-way ANOVA with Bonferroni’s multiple comparisons test. For (B), P<0.0001, overall main effect for interaction between ligand and receptor. For (C), *P< 0.05, **P<0.005, and ****P<0.0001, AngII vs. TRV023 vs. Telm group.
Fig. 7.
Fig. 7.. The effect of distinct phosphorylation patterns on the interaction of the AT1R C-terminal tail with β-arrestin 2.
(A) Representative frame of the most populated cluster of the fully phosphorylated AT1R C-terminal tail (cyan) conformation observed in molecular dynamics simulations. Phosphorylatable Ser and Thr residues are indicated in red. Proximal (PROX), middle (MID) and distal (DIST) C-terminal tail segments are labeled. Functionally important structural features of β-arrestin 2 are noted with labels. (B) The stability of polar interactions formed by each Ser and Thr residue in the AT1R C-terminal tail with a β-arrestin 2 residue was measured (0 to 1), then the stability of each interaction formed by a C-terminal tail residue was summed and depicted on the bar plot. The sum of polar interactions formed by each region of the tail is depicted beneath the label. (C) Root mean square fluctuation (RMSF) values calculated for Cα atoms of each residue of every phosphorylation variant of the AT1R C-tail. PROX + MID + DIST, Ser and Thr residues of each segment phosphorylated; PROX +DIST, Ser and Thr residues of the PROX and DIST segments phosphorylated; MID + DIST, Ser and Thr residues of the MID and DIST segments phosphorylated. Higher values indicate less structural stability. (D) Changes in RMSF values calculated for Cα atoms of the AT1R C-terminal tail when losing phosphorylation in the PROX (blue) or MID (red) segments. (E) Snapshots of C-terminal tail conformations observed for each phosphorylation pattern. Variant 1, all PROX, MID, and DIST residues phosphorylated; variant 2, PROX and DIST residues phosphorylated; variant 3, MID and DIST residues phosphorylated. The position of the C-terminal tail was plotted once every 10 ns, resulting in 300 snapshots extracted from 3 μs of accumulated simulation time.
Fig. 8.
Fig. 8.. Loss of phosphorylation in the proximal and middle regions of the AT1R C-terminal tail alter G protein–mediated ERK phosphorylation.
(A and B) Representative Western blots and quantification of phosphorylated ERK (p-ERK) relative to total ERK (t-ERK) in HEK293 cells (A) or HEK293 GqKO cells (B) transiently transfected with AT1R-WT, AT1R-PROX, AT1R-MID, AT1R-DIST or AT1R-NULL and starved for 3h before stimulation with AngII, TRV023 or treatments with the inhibitor Telm. N=8–9 (HEK293 cells) or N=7–8 (GqKO cells) independent experiments per group. * P< 0.05, †P< 0.005, ligand vs. untreated. Data for additional mutants can be found in the Supplementary Materials (fig. S4 and fig. S5).

References

    1. Wang JG,C; Rockman HA, G-Protein–Coupled Receptors in Heart Disease. Circ res, 2018: p. 123. - PMC - PubMed
    1. Hauser AS, et al., Trends in GPCR drug discovery: new agents, targets and indications. Nat Rev Drug Discov, 2017. 16(12): p. 829–842. - PMC - PubMed
    1. Thomsen ARB, et al., GPCR-G Protein-beta-Arrestin Super-Complex Mediates Sustained G Protein Signaling. Cell, 2016. 166(4): p. 907–919. - PMC - PubMed
    1. Eiger DS, et al., Biased agonism at chemokine receptors. Cell Signal, 2021. 78: p. 109862. - PMC - PubMed
    1. Kim J, et al., Functional antagonism of different G protein-coupled receptor kinases for beta-arrestin-mediated angiotensin II receptor signaling. Proc Natl Acad Sci U S A, 2005. 102(5): p. 1442–7. - PMC - PubMed

MeSH terms

LinkOut - more resources