. 2024 Nov 15;84(22):3728-3742.
doi: 10.1158/0008-5472.CAN-24-0932.

YAP1 Inhibition Induces Phenotype Switching of Cancer-Associated Fibroblasts to Tumor Suppressive in Prostate Cancer

Affiliations

YAP1 Inhibition Induces Phenotype Switching of Cancer-Associated Fibroblasts to Tumor Suppressive in Prostate Cancer

Hongtao Song et al. Cancer Res. .

Abstract

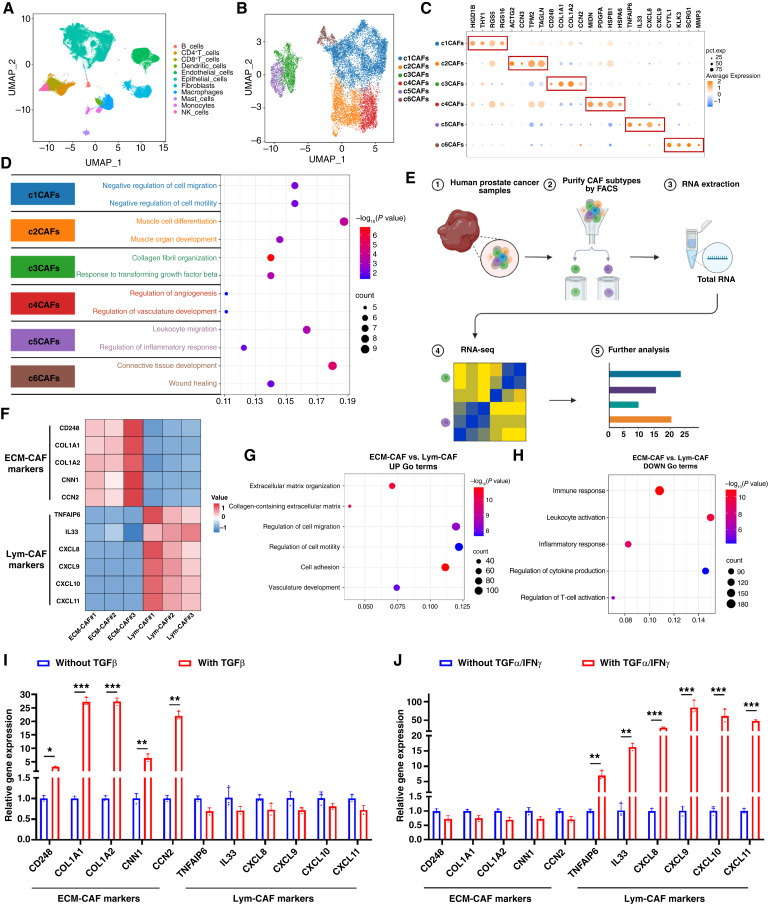
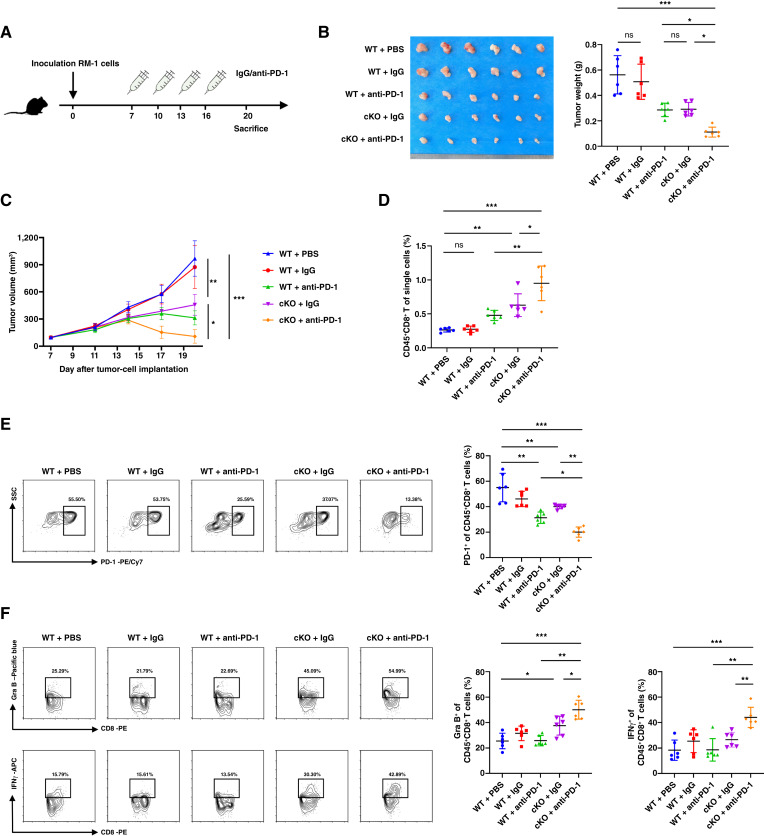
Prostate cancer rarely responds to immune-checkpoint blockade (ICB) therapies. Cancer-associated fibroblasts (CAF) are critical components of the immunologically "cold" tumor microenvironment and are considered a promising target to enhance the immunotherapy response. In this study, we aimed to reveal the mechanisms regulating CAF plasticity to identify potential strategies to switch CAFs from protumorigenic to antitumor phenotypes and to enhance ICB efficacy in prostate cancer. Integration of four prostate cancer single-cell RNA sequencing datasets defined protumorigenic and antitumor CAFs, and RNA-seq, flow cytometry, and a prostate cancer organoid model demonstrated the functions of two CAF subtypes. Extracellular matrix-associated CAFs (ECM-CAF) promoted collagen deposition and cancer cell progression, and lymphocyte-associated CAFs (Lym-CAF) exhibited an antitumor phenotype and induced the infiltration and activation of CD8+ T cells. YAP1 activity regulated the ECM-CAF phenotype, and YAP1 silencing promoted switching to Lym-CAFs. NF-κB p65 was the core transcription factor in the Lym-CAF subset, and YAP1 inhibited nuclear translocation of p65. Selective depletion of YAP1 in ECM-CAFs in vivo promoted CD8+ T-cell infiltration and activation and enhanced the therapeutic effects of anti-PD-1 treatment on prostate cancer. Overall, this study revealed a mechanism regulating CAF identity in prostate cancer and highlighted a therapeutic strategy for altering the CAF subtype to suppress tumor growth and increase sensitivity to ICB. Significance: YAP1 regulates cancer-associated fibroblast phenotypes and can be targeted to switch cancer-associated fibroblasts from a protumorigenic subtype that promotes extracellular matrix deposition to a tumor-suppressive subtype that stimulates antitumor immunity and immunotherapy efficacy.


Conflict of interest statement

No disclosures were reported.

Figures

None
Graphical abstract
Figure 1.
Figure 1.
Identification of the ECM-CAF and Lym-CAF in prostate cancer. A, UMAP visualization of the cell populations from four scRNA-seq datasets in prostate cancer. B, UMAP visualization of six CAF clusters across nontumor tissues and tumor tissues from scRNA-seq datasets. Different CAF clusters are color-coded. C, The relative expression levels of marker genes in each CAF cluster. D, Gene Ontology enrichment analysis to show the main functions of each CAF cluster. E, A schematic image of dissociated ECM-CAF and Lym-CAF by FACS and performed RNA-seq. F, Heatmap to show the marker gene expression patterns of ECM-CAF (n = 3) and Lym-CAF (n = 3) from prostate cancer patients. G and H, Gene Ontology enrichment analysis to show the main functions of ECM-CAF and Lym-CAF. I and J, Quantitative PCR analysis to show the mRNA levels of ECM-CAF markers (CD248, COL1A1, COL1A2, CNN1, and CCN2) and Lym-CAF markers (TNFAIP6, IL33, and CXCL8/9/10/11) under the stimulation of TGFβ (20 ng/mL) or TNFα/IFNγ (20 ng/mL, 20 ng/mL) in human primary CAFs isolated from prostate cancer samples. The data are presented as the means ± SD. (E, Created with BioRender.com).
Figure 2.
Figure 2.
Lym-CAF promotes the activation of CD8+ T cells via the NF-κB p65 signaling pathway. A, A schematic image of the tumor syngeneic graft experiment for coinjection of RM-1 and preinduced CAFs. B, Images of the tumor xenografts (left) and results of the tumor weight (right) from coinjection of RM-1 and CAFs on C57BL/6 mice (n = 6). C, Tumor growth curves after coinjection of RM-1 and CAFs (n = 6). D, Flow cytometry analysis of the infiltration of CD45+CD8+ T cells (n = 6). The data are presented as the means ± SD. E–H, Flow cytometry analysis of the activation markers of CD25, CD69, Gra B, and IFNγ of CD45+CD8+ T cells (n = 6). The data are presented as the means ± SD. I, Heatmap to show the characteristic markers of Lym-CAF were upregulated after coculturing with CD3+ lymphocytes on RNA-seq data (n = 3). J, Transcription factor enrichment analysis to show the upregulated transcription factors of CAFs after coculturing with CD3+ lymphocytes. The shade of orange shows the degree of upregulation, and the x-axis shows the significance. K, Representative images of immunofluorescence staining show the localization of TSG6, p65, and αSMA in prostate cancer (n = 3). DAPI, blue. Scale bar, 100 μm. L, Representative images of immunofluorescence staining show the nuclear translocation of p65 in CAFs without exogenous cytokines (Control CAF) and preinduced Lym-CAF (i-Lym-CAF; n = 3). Scale bar, 20 μm. M, Workflow to show the cocultured model of CAFs with CD3+ lymphocytes. CAFs were preinduced to Lym-CAF and cocultured with CD3+ lymphocytes. After 48 hours, CD3+ lymphocytes were collected and analyzed via flow cytometry. N and O, Flow cytometry analysis of the activation markers of Gra B and CD25 of CD3+CD8+ T cells after coculturing with preinduced Lym-CAF (n = 3). Lym-CAFs were transfected either with untargeted siRNA (siCON) or with two different siRNA targeting NF-κB p65 (siP65#1, siP65#2). *, P < 0.05; **, P < 0.01; ***, P < 0.001. (M, Created with BioRender.com).
Figure 3.
Figure 3.
ECM-CAF promotes collagen deposition and cancer cell progression. A, Representative images (left) and quantification (right) of Masson staining show the tumor syngeneic graft experiment for coinjection of RM-1 and preinduced CAFs (n = 6). Scale bar, 100 μm. B, Representative images of the morphology to show the collagen deposition via AFM. C, Representative images of immunofluorescence staining show the localization of CD248, YAP1, and αSMA in prostate cancer (n = 3). DAPI, blue. Scale bar, 100 μm. D, Representative images of immunofluorescence staining show the nuclear translocation of YAP1 in CAFs without exogenous cytokines (Control CAF) and preinduced ECM-CAF (i-ECM-CAF; n = 3). Scale bar, 20 μm. E, Representative images (left) and quantification (right) of prostate cancer organoids diameters. Organoids were cocultured with CAFs without exogenous cytokines (Control CAF), preinduced ECM-CAF transfected with untargeted siRNA (i-ECM-CAF-siCON), or preinduced ECM-CAF transfected with siRNA targeting YAP1 (i-ECM-CAF-siYAP1; n = 3). Scale bar, 100 μm. F, Heatmap of quantitative PCR analysis to show the mRNA levels of ECM-associated genes in CAFs without exogenous cytokines (Control CAF), preinduced ECM-CAF transfected with untargeted siRNA (i-ECM-CAF-siCON), or preinduced ECM-CAF transfected with siRNA targeting YAP1 (i-ECM-CAF-siYAP1; n = 3). G, Representative images of multiplex IHC staining show the YAP1+, αSMA+, and CD8+ cells (n = 80). The proportion of YAP1+ of αSMA+ cells was calculated by the number of YAP1+ αSMA+ cells/αSMA+ cells. We defined the high group as the proportion less than 50% (n = 40) and the low group as the proportion <50% (n = 40). Scale bar, 100 μm. H, The Kaplan–Meier curve of the overall survival associated with high and low proportion of YAP1+ of αSMA+ cells. I–L, Violin plots of the number of CD8+ T cells, PSA levels, and pathologic stage (T stage and N stage) were associated with high and low proportions of YAP1+ of αSMA+ cells. *, P < 0.05; **, P < 0.01; ***, P < 0.001.
Figure 4.
Figure 4.
YAP1 is the gatekeeper of the switch between Lym-CAF and ECM-CAF. A, Pseudotime analysis to show the differentiation trajectory of Lym-CAF and ECM-CAF. B and C, Quantitative PCR analysis to show the mRNA levels of ECM-CAF markers (CD248, COL1A1, COL1A2, CNN1, and CCN2) and Lym-CAF markers (TNFAIP6, IL33, and CXCL8/9/10/11) in preinduced Lym-CAF transfected with empty vector (i-Lym-CAF-vector), with YAP1 overexpressing plasmid (i-Lym-CAF-oeYAP1), with untargeted siRNA (i-Lym-CAF-siCON), or with siRNA targeting YAP1 (i-Lym-CAF-siYAP1). The data are presented as the means ± SD. D, Quantitative PCR analysis to show the mRNA levels of ECM-CAF markers and Lym-CAF markers in preinduced ECM-CAF transfected with untargeted siRNA (i-ECM-CAF-siCON) or with siRNA targeting YAP1 (i-ECM-CAF-siYAP1). E and F, Flow cytometry analysis of the activation markers of Gra B and CD25 of CD3+CD8+ T cells after coculturing with preinduced ECM-CAF (n = 3). ECM-CAFs were transfected either with untargeted siRNA (siCON) or with two different siRNA targeting YAP1 (siYAP1#1, siYAP1#2). G, Western blot results show the expression of YAP1 and p65 under the stimulation of TGFβ (20 ng/mL; left) or TNFα/IFNγ (20 ng/mL; right). H, Representative images of immunofluorescence staining show the nuclear translocation of YAP1 and p65 in i-ECM-CAF and i-Lym-CAF. Scale bar, 20 μm. I, Dual-luciferase assay of NF-κB luciferase reporter 24 hours after transfected either with untargeted siRNA (siCON) or with two different siRNA targeting YAP1 (siYAP1#1, siYAP1#2) in HEK293T cells. Cells were preinduced with TNFα/IFNγ. The data are presented as the means ± SD. J and K, Dual-luciferase assay of NF-κB luciferase reporter 24 hours after transfection with YAP1, IKKα, or p65 plasmid as indicated in HEK293T cells. L, Immunoprecipitation assay to detect the association of YAP1 with IKKα in CAFs. M, Western blot analysis of the phosphorylation of IKKα with YAP1 silencing in CAFs. N, Western blot analysis of the phosphorylation of IKKα, with expression of different doses of YAP1 in CAFs. O, A model of mechanisms that YAP1 inhibited NF-κB p65 activation through direct interaction with IKKα and inhibited the phosphorylation of IKKα in ECM-CAF. *, P < 0.05; **, P < 0.01; ***, P < 0.001. (O, Created with BioRender.com).
Figure 5.
Figure 5.
Selective YAP1 depletion targeting ECM-CAF can suppress tumor progression in vivo. A, Schematic image of selective YAP1 depletion model on Cd248-CreERT2; Yap1flox/flox mice. B, Images of the tumor xenografts (left) and results of the tumor weight (right) from RM-1 cells on Cd248-CreERT2; Yap1flox/flox and age-matched littermate control mice (n = 7). C, Tumor growth curves after RM-1 cells implantation (n = 7). D, Flow cytometry analysis of the infiltration of CD45+CD8+ T cells (n = 7). The data are presented as the means ± SD. E, Flow cytometry analysis of the exhaustion markers of PD-1 and CTLA4 of CD45+CD8+ T cells (n = 7). F and G, Flow cytometry analysis of the activation markers of CD25, CD69, IFNγ, and Gra B of CD45+CD8+ T cells (n = 7). H, Representative images (left) and quantification (right) of Masson staining show tumor grafts (n = 7). Scale bar, 100 μm. I, Representative images of the morphology show the collagen deposition via AFM. J and K, Results of the tumor weight and growth curves for coinjection of 22Rv1 cells mixed with human primary CAFs on humanized immuno-reconstruction model on NCG mice (n = 6). L, Flow cytometry analysis of the infiltration of CD8+ T cells (n = 6). The data are presented as the means ± SD. *, P < 0.05; **, P < 0.01; ***, P < 0.001. (A, Created with BioRender.com).
Figure 6.
Figure 6.
Selective YAP1 depletion targeting ECM-CAF can increase the immunotherapeutic effect of anti-PD-1 antibodies in vivo. A, Schematic image to show the process of combined treatment. Isolated tumor tissues after mice were sacrificed after treatment. B, Images of the tumor xenografts (left) and results of the tumor weight (right) from RM-1 cells on Cd248-CreERT2; Yap1flox/flox mice treated with anti-PD-1 antibody (n = 6). C, Tumor growth curves after RM-1 cells implantation (n = 6). D, Flow cytometry analysis of the infiltration of CD45+CD8+ T cells (n = 6). The data are presented as the means ± SD. E, Flow cytometry analysis of the exhaustion marker of PD-1 of CD45+CD8+ T cells (n = 6). F, Flow cytometry analysis of the activation markers of Gra B and IFNγ of CD45+CD8+ T cells (n = 6). ns, nonsignificant; *, P < 0.05; **, P < 0.01; ***, P < 0.001.

References

    1. Butterfield LH, Najjar YG. Immunotherapy combination approaches: mechanisms, biomarkers and clinical observations. Nat Rev Immunol 2024;24:399–416. - PMC - PubMed
    1. Sun Q, Hong Z, Zhang C, Wang L, Han Z, Ma D. Immune checkpoint therapy for solid tumours: clinical dilemmas and future trends. Signal Transduct Target Ther 2023;8:320. - PMC - PubMed
    1. Topalian SL, Forde PM, Emens LA, Yarchoan M, Smith KN, Pardoll DM. Neoadjuvant immune checkpoint blockade: a window of opportunity to advance cancer immunotherapy. Cancer Cell 2023;41:1551–66. - PMC - PubMed
    1. Stultz J, Fong L. How to turn up the heat on the cold immune microenvironment of metastatic prostate cancer. Prostate Cancer Prostatic Dis 2021;24:697–717. - PMC - PubMed
    1. Bilusic M, Madan RA, Gulley JL. Immunotherapy of prostate cancer: facts and hopes. Clin Cancer Res 2017;23:6764–70. - PMC - PubMed

MeSH terms

Substances