. 2024 Aug 12;42(8):1450-1466.e11.
doi: 10.1016/j.ccell.2024.07.007.

Interleukin-21 engineering enhances NK cell activity against glioblastoma via CEBPD

Affiliations

Interleukin-21 engineering enhances NK cell activity against glioblastoma via CEBPD

Mayra Shanley et al. Cancer Cell. .

Abstract

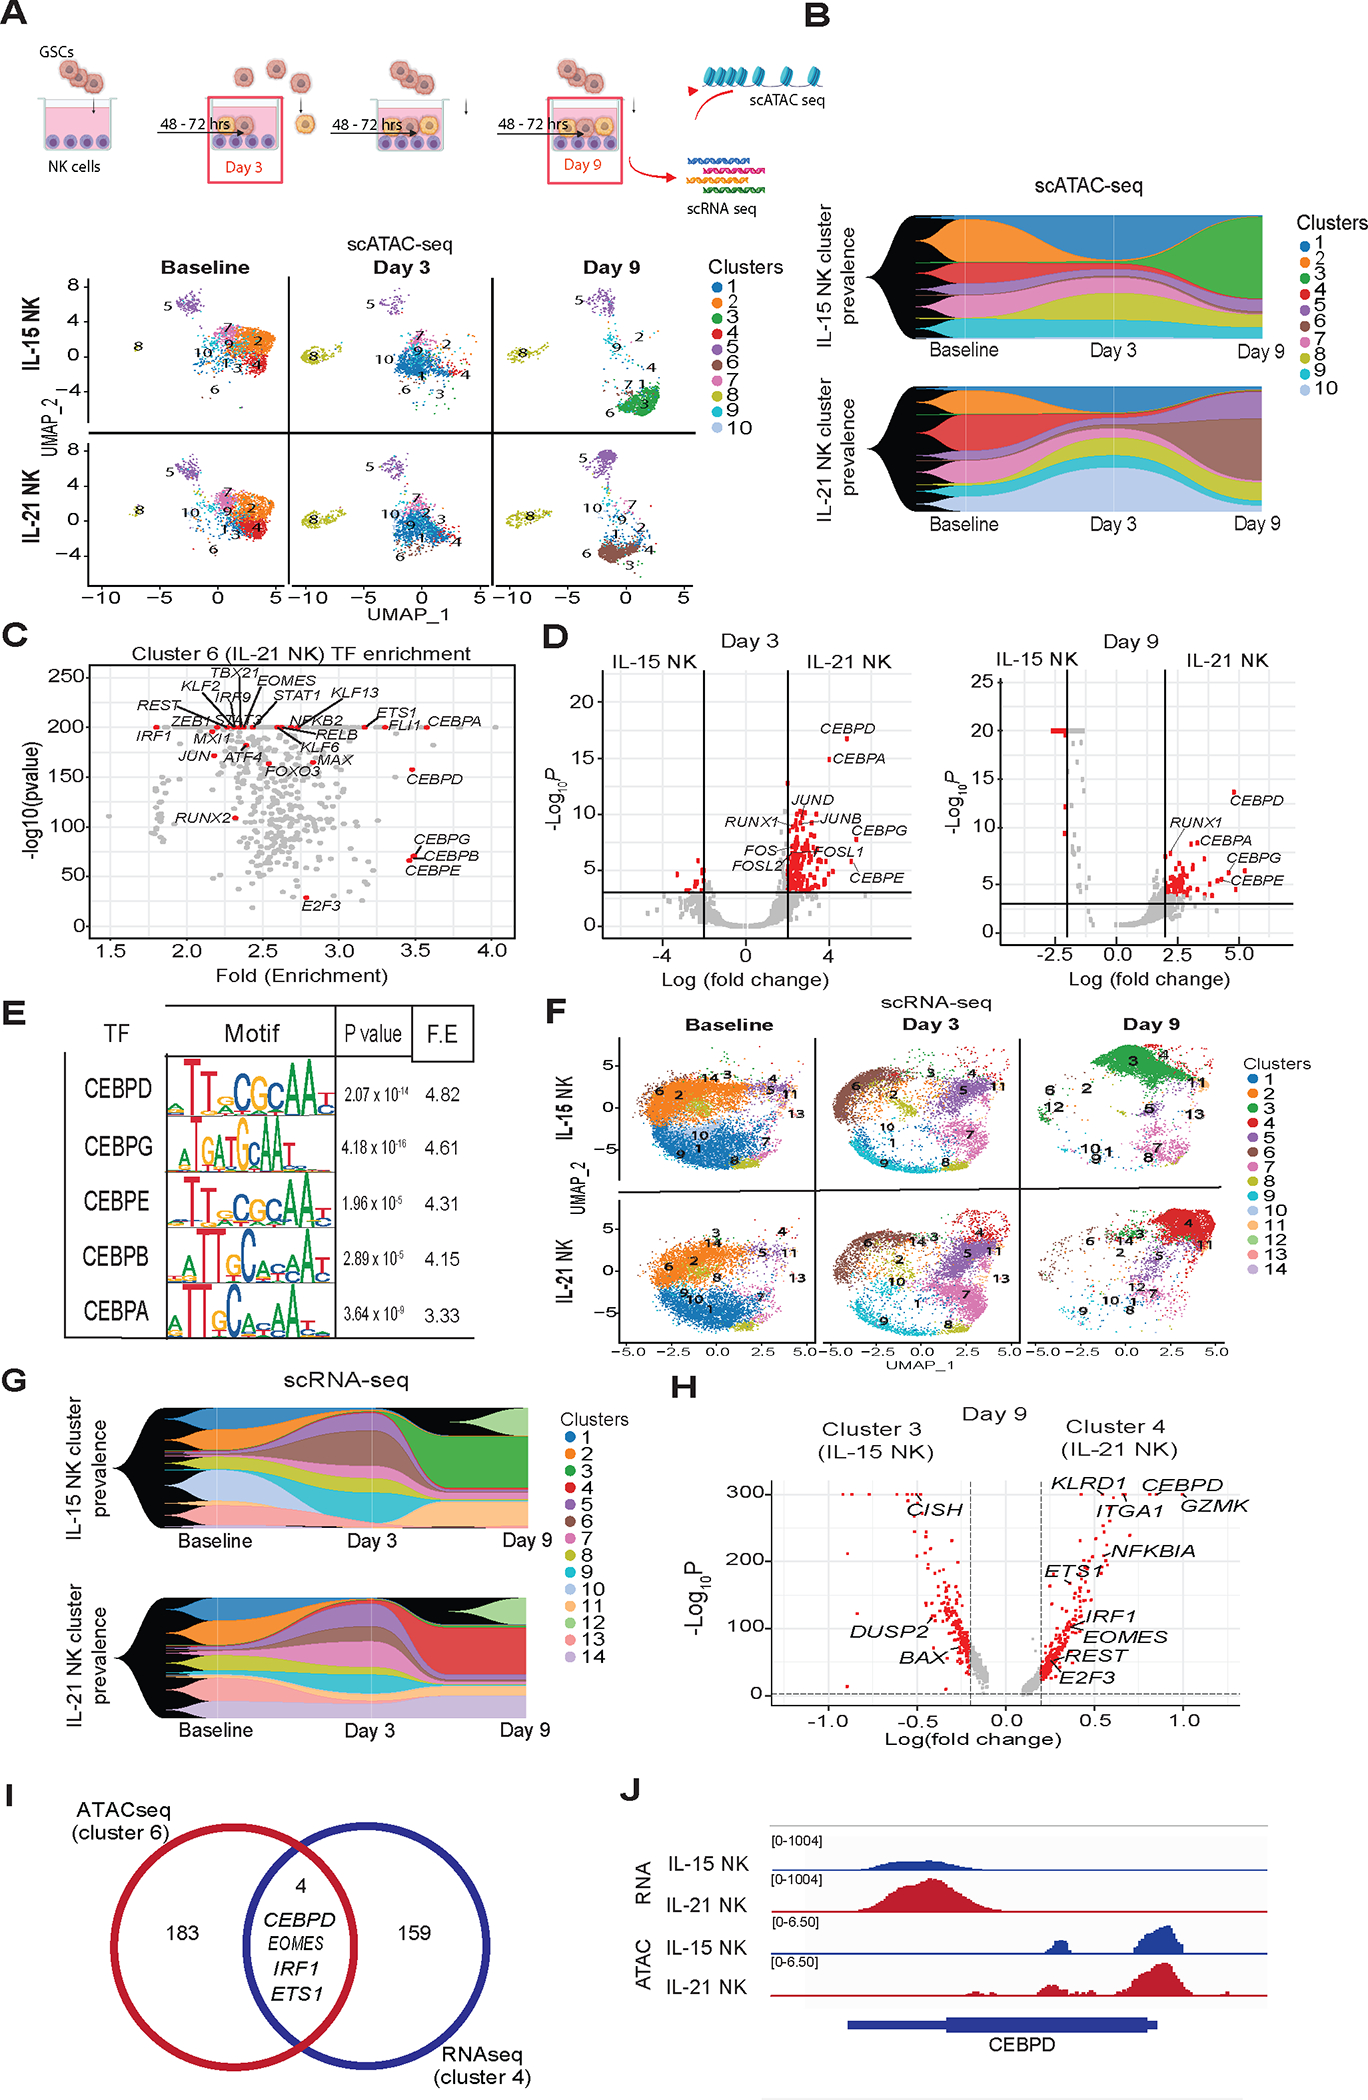
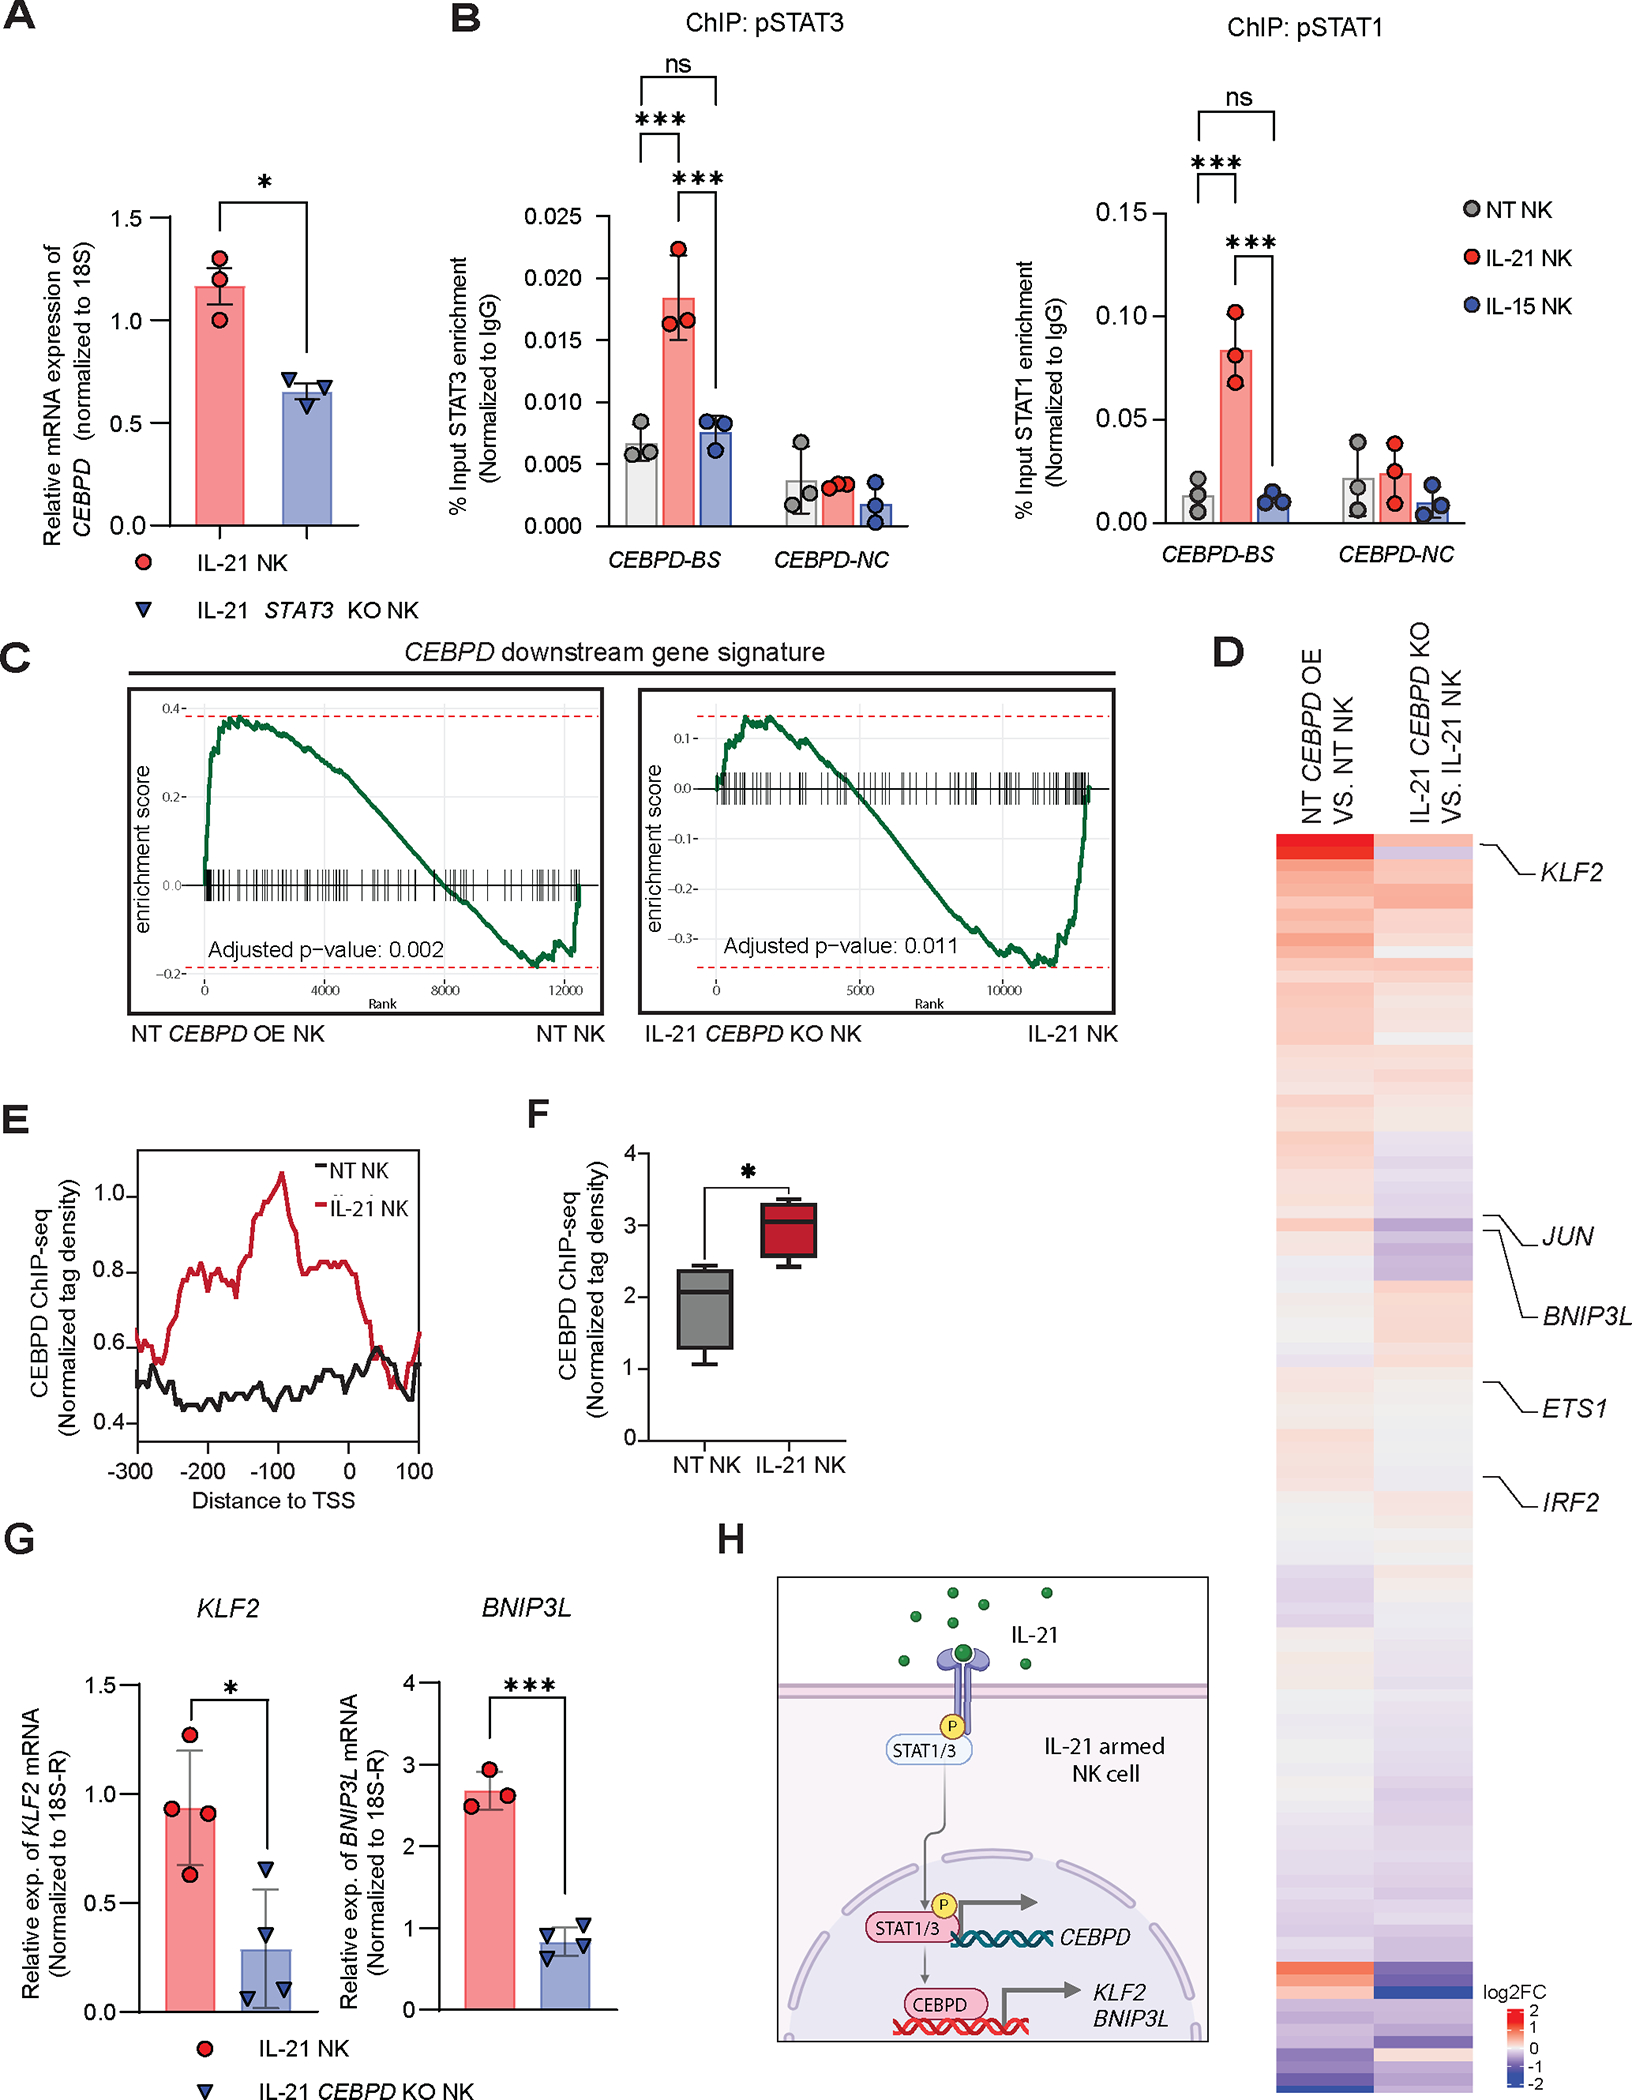
Glioblastoma (GBM) is an aggressive brain cancer with limited therapeutic options. Natural killer (NK) cells are innate immune cells with strong anti-tumor activity and may offer a promising treatment strategy for GBM. We compared the anti-GBM activity of NK cells engineered to express interleukin (IL)-15 or IL-21. Using multiple in vivo models, IL-21 NK cells were superior to IL-15 NK cells both in terms of safety and long-term anti-tumor activity, with locoregionally administered IL-15 NK cells proving toxic and ineffective at tumor control. IL-21 NK cells displayed a unique chromatin accessibility signature, with CCAAT/enhancer-binding proteins (C/EBP), especially CEBPD, serving as key transcription factors regulating their enhanced function. Deletion of CEBPD resulted in loss of IL-21 NK cell potency while its overexpression increased NK cell long-term cytotoxicity and metabolic fitness. These results suggest that IL-21, through C/EBP transcription factors, drives epigenetic reprogramming of NK cells, enhancing their anti-tumor efficacy against GBM.

Keywords: CEBPD; GBM; IL-21; NK cells.


Conflict of interest statement

Declaration of interests M.S., M. Daher, R.B., H.R., S.A., Y.L., N.U., E.L., E.J.S., K.R., and The University of Texas MD Anderson Cancer Center have an institutional financial conflict of interest with Takeda Pharmaceutical. R.B., E.J.S., K.R., and The University of Texas MD Anderson Cancer Center have an institutional financial conflict of interest with Affimed GmbH. K.R. participates on the Scientific Advisory Board for Avenge Bio, Virogin Biotech, Navan Technologies, Caribou Biosciences, Bit Bio Limited, Replay Holdings, oNKo Innate, and The Alliance for Cancer Gene Therapy ACGT. K.R. is the Scientific founder of Syena. E.J.S. has served on the Scientific Advisory Board for Adaptimmune, Axio, Celaid, FibroBiologics, Navan Technologies, New York Blood Center and Novartis. M Daher participates on the Scientific Advisory Board for Cellsbin. M.S., H.S., E.J.S., and K.R. have filed for a patent (20230074303); “Cell immunotherapy for the treatment of cancer.”

Figures

Figure 1.
Figure 1.. Cytokine arming improves NK cell anti-tumor activity against GSCs.
(A) Schematic representation of retroviral vectors used to transduce NK cells to secrete IL-15 or IL-21. (B) NK cell transduction efficiency determined by flow cytometry assessing human IgG1 expression (n=5–6 donors). Mean ± standard error of the mean (SEM); One-way ANOVA with Bonferoni correction. (C) IL-15 (n=3 donors) and IL-21 (n=6 donors) levels by ELISA from supernatants from non-transduced (NT), IL-15- or IL-21-transduced NK cells. Mean ± standard deviation (SD); One-way ANOVA with Bonferoni correction. (D) Percentage (%) of GSC20 killing (E:T=1:1) by NT, IL-15 or IL-21 NK cells as measured by real-time killing assay (n=9 donors); asterisks depict statistical significance for the comparisons. Blue asterisks: IL-15 vs NT NK; red asterisks: IL-21 vs NT NK. Mean ± SEM; Two-way ANOVA with Dunnet correction. (E, F) K562 killing by NT, IL-15 or IL-21 NK cells that were cultured either alone (E) or with GSC20 (F) at E:T=1:1. NK cells were then purified and their cytotoxicity against K562 was assessed (n=6 donors). Blue asterisks: IL-15 vs NT NK; red asterisks: IL-21 vs NT NK. Mean ± SEM; Two-way ANOVA with Dunnet correction. (G-I) Killing assay of GSC272 (G) and GSC20 (H) spheroids by NT, IL-15 or IL-21 NK cells (n=3 donors); asterisks depict statistical significance for the comparisons. Blue asterisks: IL-15 vs NT NK; red asterisks: IL-21 vs NT NK. Mean ± SEM; Two-way ANOVA with Dunnet correction. Images depict the red signal (spheroid growth) from live imaging of GSC272 killing assay (I). ns=not significant, ***p ≤ 0.001. See also Figure S1 and Video S1.
Figure 2.
Figure 2.. IL-21-armed NK cells exhibit long-term cytotoxicity against GSCs and have greater metabolic fitness.
(A-C) NK marker expression by mass cytometry for NT, IL-15 or IL-21 NK cells (n=3 donors) cultured either alone or in the presence of GSC20 for 48 hours. (A) tSNE plots showing the cluster distribution and fraction, where color scale and circle size represent expression and size of cluster for each group (B). (C) Comparative heatmap showing expression of NK cell markers at the cluster level. Color scale shows the expression level for each marker (red: higher expression; blue: lower expression). (D-G) NK cells and mCherry transduced GSCs (red) were co-cultured at E:T=1:1. Every 2–3 days, fresh GSCs were added to the co-cultures (each arrow represent each GSC rechallenge). Graphs showing red object count during live cell imaging after GSC20 (D-E), GSC272 (F) and GSC267 (G) rechallenge (n=3 donors). (E) Summary red object count after each GSC20 rechallenge from 2 separate experiments (n=6 donors). Asterisks represent statistical differences between groups. Black asterisks: IL-21 vs NT NK; red asterisks: IL-21 vs IL-15 NK. Mean ± SEM; Two-way ANOVA with Bonferroni correction. (H) Heatmap showing levels of cytokines in supernatants from co-cultures of NK cells with GSCs in the experiment presented in panel D (n=3 donors). Color scale shows cytokine levels (red: higher; blue: lower). (I, J) Polyfunctionality scores (I) and polyfunctionality strength index (J) of NT, IL-15 or IL-21 NK cells in response to GSC20 (n=4 donors). Mean ± SD; Two-way ANOVA with Bonferroni correction. (K) Representative measures of oxygen consumption rate (OCR) upon addition of oligomycin (Oligo), FCCP, and rotenone and antimycin A (R/A). Quantified basal respiration (L) and maximal respiration (M) of purified NK cells after co-culture with GSC20 (n=3 donors). Mean ± SEM; One-way ANOVA with Bonferroni correction. (N) Representative measures of extracellular acidification rate (ECAR) upon addition of glucose, Oligo, and 2-deoxy-D-glucose (2-DG) and quantified basal glycolysis (O) and glycolytic capacity (P) of purified NK cells after co-culture with GSC20 (n=3 donors). Mean ± SEM; One-way ANOVA with Bonferroni correction. ns=not significant, *p ≤ 0.05, **p ≤ 0.01, ***p ≤ 0.001. See also Figure S1.
Figure 3.
Figure 3.. In vivo anti-tumor activity of IL-21 NK cells.
(A) Schema showing the in vivo experiment. Bioluminescence imaging (BLI) was used to monitor the growth of intracranially (i.c.) injected FFluc-labeled GSC20 tumor cells in NSG mice treated intratumorally (i.t.) with 0.1×10⁶ NK cells (n=3–5 mice per group). (B) Individual (fine lines) and average (thick lines) BLI data. Unpaired t-test.(C) Kaplan-Meier analysis (n=3–5 mice per group). Animals treated with IL-21 NK cells had significantly better survival compared with GSC20 alone (p=0.0042), IL-15 NK cells (p=0.0027) or NT NK cells (p=0.0042); log-rank test. (D) Body weight change of mice over time in different groups described in panel C. Unpaired t-test. (E) Schema showing GSC20 in vivo rechallenge. (F) Flow cytometry showing NK cells in brain tissue (CD56+CD3CD16+ cells) from IL-21 NK treated (n=4 mice) or tumor only control (n=5 mice) mice after GSC20 rechallenge. Horizontal line represents the Mean and error bar SD; Unpaired t-test. (G) Representative Immunohistochemistry (IHC) CD16 staining images of brain sections from two mice (#1 and #2) treated with IL-21 NK cells and rechallenged with GSC20 (left panels) or tumor only control (top right panel). Scale bar, 100 μm; tonsil was positive control. Arrows in G show CD16+ NK cells that had infiltrated the brain. ns=not significant, *p ≤ 0.05, **p ≤ 0.01, ***p ≤ 0.001. See also Figure S2–S6 and Table S1.
Figure 4.
Figure 4.. Epigenetic and transcriptomic characterization of IL-21 vs. IL-15 NK cells after GSC co-culture.
(A) UMAP plot of scATAC-seq data showing the cluster level epigenetic evolution of IL-15 NK (top) and IL-21 NK (bottom) cells over time from baseline (day 0) to days 3 and 9 following GSC rechallenge. (B) Fish plots showing the prevalence of scATAC-seq clusters in the NK cells over time. (C) Transcription factor (TF) enrichment of cluster 6 (mostly from day 9 IL-21 NK cells) specific peaks. (D) Volcano plots showing TF enrichment of IL-15 and IL-21 NK cell-specific peaks at day 3 (left) and day 9 (right) following co-culture with GSC20. Red dots represent TFs with motifs that were highly enriched in product-specific peaks. (E) IL-21 motif enrichment at day 9. C/EBP family motifs are among the top 20 most enriched. (F) UMAP plot of scRNA-seq data showing the transcriptomic clusters and their evolution over time in IL-15 NK (top) and IL-21 NK (bottom) cells at baseline (day 0) and at days 3 and 9 following co-culture with GSC20. (G) Fish plots showing the prevalence of clusters from scRNA-seq data of the NK cells over time. (H) Volcano plot showing genes with significant upregulation in IL-15 NK cell cluster 3 (left) and IL-21 NK cell cluster 4 (right) at day 9 after co-culture with GSC20. Red dots represent TFs with higher gene expression levels. (I) Venn diagram showing the DEGs in cluster 4 by scRNA-seq overlapping with the associated genes with a chromatin open region in cluster 6 by scATAC-seq; the two clusters are unique to IL-21 NK cells co-cultured with GSCs. (J) scATAC-seq and scRNA-seq profiling-derived genomic coverage plots showing chromatin accessibility peaks in the CEBPD coding region of NK cells after 9-day GSC co-culture. See also Figure S7 and Table S2.
Figure 5.
Figure 5.. Regulon activity in IL-21 and IL-15 NK cells after GSC co-culture.
(A) Venn diagram showing the overlapping regulons between IL-21 vs. IL15 NK cells at each time point. (B) Heatmap showing regulon activity in IL-21 and IL-15 NK cells at baseline (day 0) and days 3 and 9 following co-culture with GSCs. Color bar denotes scaled regulon activity score (AUC). (C, D) Violin plots showing the scaled gene-level chromatin accessibility of target genes of CEBPB (C; 85 genes) and CEBPD (D; 106 genes) inferred from gene expression profiles using pySCENIC. (E, F) Top enriched Hallmark pathways of target genes of CEBPB (E) and CEBPD (F) inferred from pySCENIC. (G) UMAP showing the distribution of clusters for each NK cell product based on scRNA-seq data from samples at different time points. Dashed line indicates cluster separation at day 9. (H) UMAP plot of the expression level of CEBPD across all cell populations. Color scale ranging from white to dark blue represents low to high expression levels. (I) UMAP plot showing the gene set score of CEBPD regulons at the transcriptomic level. Color scale ranging from blue to red represents low to high gene set score. See also Figure S7–S8.
Figure 6.
Figure 6.. CEBPD is required for robust and long-lived anti-tumor activity and metabolic fitness of IL-21 NK cells.
NT, IL-21 Cas9 (control) and IL-21 CEBPD KO NK cells were co-cultured with mCherry transduced GSC20 (red) at E:T=1:1. Every 2–3 days, fresh GSC20 were added to the co-cultures (arrows) without adding new NK cells. Red signal was followed with real time imaging. (A) Graph showing real time killing analysis (n=4 donors) of NT, IL-21 Cas9 control and IL-21 CEBPD knockout (KO) NK cells. Mean ± SEM; Two-way ANOVA with Bonferroni correction. (B) Representative measures of oxygen consumption rate (OCR) upon addition of Oligo, FCCP, and rotenone and antimycin A (R/A). Quantified basal respiration (C) and maximal respiration (D) of purified NT, IL-21 and IL-21 CEBPD KO NK cells after 48 hours of co-culture with GSC20 (n=3 donors). Mean ± SEM; One-way ANOVA with Bonferroni correction. (E) NT, NT CEBPD OE (overexpression) and IL-21 NK cells were co-cultured with mCherry transduced GSC20 (red) at E:T=1:1. Every 2–3 days, fresh GSC20 were added to the co-cultures (arrows) without adding new NK cells. Graph showing real time killing analysis (n=4 donors) of NT, NT CEBPD OE and IL-21 NK cells. Mean ± SEM; Two-way ANOVA. (F) Representative measures of oxygen consumption rate (OCR) upon addition of Oligo, FCCP, and R/A. Quantified basal respiration (G) and maximal respiration (H) of purified NT, NT CEBPD OE and IL-21 NK cells after 48 hours of co-culture with GSC20 (n=4 donors). Mean ± SEM; One-way ANOVA with Bonferroni correction. (I) Schema of the in vivo experiment. Bioluminescence imaging (BLI) was used to monitor the growth of FFluc-labeled GSC272 tumor cells in NSG mice injected with GSC272 alone, or GSC272 plus NT, NT CEBPD OE, IL-21 Cas9 control or IL-21 CEBPD KO NK cells. (J) Average radiance (BLI) data for the denoted treatment conditions. Mean ± SEM; Two-way ANOVA for multiple comparisons between NK treated groups with Bonferroni correction. (K) Kaplan-Meier analysis (n=5 mice/group). Log-rank test. ns=not significant, *p ≤ 0.05, **p ≤ 0.01, ***p ≤ 0.001. See also Figure S9.
Figure 7.
Figure 7.. STAT3 as a mediator of CEBPD expression in IL-21 NK cells and CEBPD target gene validation.
(A) Relative expression levels of CEBPD by qPCR in IL-21 Cas9 vs IL-21 STAT3 KO NK cells (n=3 donors). Mean ± SD; Unpaired t-test. (B) Chromatin immunoprecipitation (ChIP) of pSTAT3 and pSTAT1 followed by qPCR analysis of CEBPD (n=3 donors); CEBPD-BS (CEBPD-binding sites for STAT1/3 in the promoter region); CEBPD-NC (CEBPD-negative control containing no potential STAT1/3 binding sites. Mean ± SD; Two-way ANOVA with Bonferroni correction. (C) Barcode Enrichment Plot for CEBPD downstream genes; all genes from the dataset are ranked along x-axis according to enrichment score (y-axis), and the ranked position of each gene within a signature is shown in the x-axis. rank-based test employing a Kolmogorov–Smirnov-like statistic. (n=4 donors). (D) Heatmap showing the average log2 fold change in two comparisons (left: NT CEBPD OE vs NT; right: IL-21 CEBPD KO vs IL-21). Listed are genes in the CEBPD downstream signaling pathway which are hierarchically clustered (n=4 donors). (E) CEBPD occupancy of CEBPD-specific regulon gene targets (KLF2, BNIP3L, IRF1 and ETS1) in IL-21 vs NT NK cells (n=2 donors). Profile plots of CEBPD ChIP-seq normalized tags around promoter regions (−300, +100 bp) of transcription start sites (TSS). (F) Boxplot of CEBPD ChIP-seq normalized tag densities across gene target sites. Boxplot summarizes the minimum/maximum (whiskers), 25th/75th percentile (box), and the median (middle line) of values. Unpaired, two-tailed t-test between NT and IL-21 NK cells. (G) Relative expression levels of KLF2 (left) and BNIP3L (right) by qPCR in IL-21 Cas9 vs IL-21 CEBPD KO NK cells (n=4 donors). Mean ± SD; Unpaired t-test. (H) Schematic diagram depicting how IL-21 induces CEBPD which in turn regulates downstream target genes (e.g., KLF2 and BNIP3L) in NK cells. ns=not significant, *p ≤ 0.05, **p ≤ 0.01, ***p ≤ 0.001. See also Figure S10.

Similar articles

Cited by

References

    1. Lim M, Xia Y, Bettegowda C, and Weller M (2018). Current state of immunotherapy for glioblastoma. Nat Rev Clin Oncol 15, 422–442. 10.1038/s41571-018-0003-5. - DOI - PubMed
    1. McCutcheon IE, and Preul MC (2021). Historical Perspective on Surgery and Survival with Glioblastoma: How Far Have We Come? World Neurosurg 149, 148–168. 10.1016/j.wneu.2021.02.047. - DOI - PubMed
    1. Lathia JD, Mack SC, Mulkearns-Hubert EE, Valentim CL, and Rich JN (2015). Cancer stem cells in glioblastoma. Genes Dev 29, 1203–1217. 10.1101/gad.261982.115. - DOI - PMC - PubMed
    1. Gras Navarro A, Bjorklund AT, and Chekenya M (2015). Therapeutic potential and challenges of natural killer cells in treatment of solid tumors. Front Immunol 6, 202. 10.3389/fimmu.2015.00202. - DOI - PMC - PubMed
    1. Shaim H, Shanley M, Basar R, Daher M, Gumin J, Zamler DB, Uprety N, Wang F, Huang Y, Gabrusiewicz K, et al. (2021). Targeting the alphav integrin/TGF-beta axis improves natural killer cell function against glioblastoma stem cells. J Clin Invest 131. 10.1172/JCI142116. - DOI - PMC - PubMed

MeSH terms