. 2024 Sep 19;187(19):5336-5356.e30.
doi: 10.1016/j.cell.2024.07.030. Epub 2024 Aug 12.

Macrophage-mediated myelin recycling fuels brain cancer malignancy

Affiliations

Macrophage-mediated myelin recycling fuels brain cancer malignancy

Daan J Kloosterman et al. Cell. .

Abstract

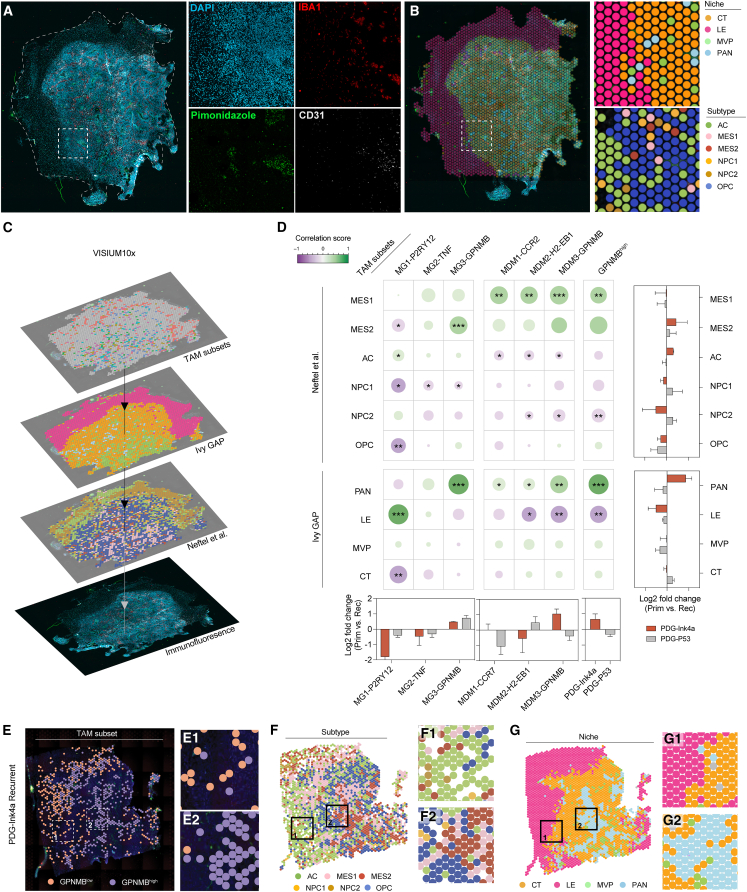
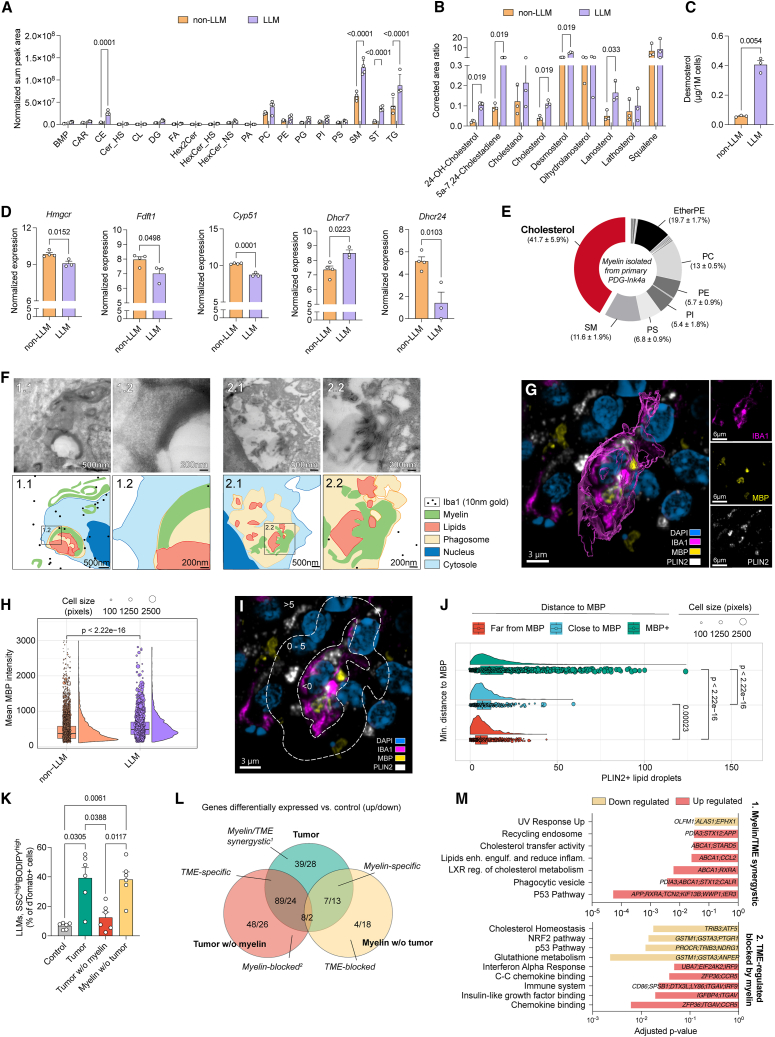
Tumors growing in metabolically challenged environments, such as glioblastoma in the brain, are particularly reliant on crosstalk with their tumor microenvironment (TME) to satisfy their high energetic needs. To study the intricacies of this metabolic interplay, we interrogated the heterogeneity of the glioblastoma TME using single-cell and multi-omics analyses and identified metabolically rewired tumor-associated macrophage (TAM) subpopulations with pro-tumorigenic properties. These TAM subsets, termed lipid-laden macrophages (LLMs) to reflect their cholesterol accumulation, are epigenetically rewired, display immunosuppressive features, and are enriched in the aggressive mesenchymal glioblastoma subtype. Engulfment of cholesterol-rich myelin debris endows subsets of TAMs to acquire an LLM phenotype. Subsequently, LLMs directly transfer myelin-derived lipids to cancer cells in an LXR/Abca1-dependent manner, thereby fueling the heightened metabolic demands of mesenchymal glioblastoma. Our work provides an in-depth understanding of the immune-metabolic interplay during glioblastoma progression, thereby laying a framework to unveil targetable metabolic vulnerabilities in glioblastoma.

Keywords: cancer immunity; cholesterol; glioblastoma; lipid metabolism; macrophages; myelin recycling; tumor microenvironment.


Conflict of interest statement

Declaration of interests L.A., D.J.K., A.K., and J.E. are inventors on European patents P091147NL and P099572EP describing relevant claims and their therapeutic potential.

Figures

None
Graphical abstract
Figure 1
Figure 1
Single-cell analyses reveal co-occurrence of glioblastoma mesenchymal subtype and GPNMBhigh TAMs (A) Schematic diagram of experimental design assessing macrophage subsets and glioblastoma subtype/niche heterogeneity and interactions using glioblastoma GEMM and public datasets (see STAR Methods). (B) Uniform manifold approximation and projection (UMAP) representation of major cell populations from scRNA-seq glioblastoma mouse dataset (DCs, dendritic cells; ECs, endothelial cells). (C) Visual representation of glioblastoma subtype heterogeneity subjected to scRNA-seq. The module scores of each individual cell are depicted on the axes. (D) Average fraction of the glioblastoma cell subtypes (outer circle) per model. Pseudo-location assignment of glioblastoma cells (inner circle) displayed as a percentage of cellular subtype. (E) UMAP representation of MG and MDM sub-clusters. (F) Gene set enrichment analysis (GSEA) scores of depicted pathways in MG and MDM clusters identified in (E). (G) Pseudo-location niche assignment of TAM subsets from clusters identified in (E); represented as mean ± SEM. (H) Left and middle: differential abundance of TAM subsets upon recurrence in glioblastoma models. Right: correlation matrix between TAM subset and glioblastoma cellular subtype abundance. (I) Top 25 differentially expressed genes between GPNMBhigh and GPNMBlow TAM clusters (Table S1C). (J) Correlation between GPNMBhigh TAMs and MES glioblastoma cells in murine and human glioblastoma scRNA-seq datasets., Statistics: Kendall trend test (H) or simple linear regression (J) (p < 0.05, ∗∗p < 0.01, ∗∗∗p < 0.001). P2RY12, Purinergic Receptor P2Y12; TNF, Tumor Necrosis Factor; GPNMB, Glycoprotein Nmb; CCR2, C-C Chemokine Receptor type 2; H2-EB1, Histocompatibility 2, class II antigen E Beta. See also Figure S1 and Table S1. Relevant gene signatures used for computational analysis of single-cell RNA sequencing and VISIUM10x dataset, related to Figures 1 and 2, Table S2. Gene set over-representation analyses of macrophage subclusters, related to Figure 1, Table S3. Gene set over-representation analysis of GPNMBlow and GPNMBhigh TAMs, related to Figure 1.
Figure S1
Figure S1
In-depth transcriptional analysis of macrophage landscape in glioblastoma, related to Figure 1 (A) Stacked violin plots depicting the expression of representative genes defining MG1–4 and MDM1–4 clusters identified in the MG and MDM population (52,688 cells) represented in Figures 1B and 1E; Table S1A. MG and MDM from all PDG-Ink4a primary (n = 3) and recurrent (n = 3) and PDG-p53 primary (n = 4) and recurrent (n = 3) tumor samples are represented. Colors correspond to cell clusters presented in Figure 1E. (B) Heatmap of the averaged enrichment scores derived from GSEA for the depicted relevant published signatures per macrophage cluster, data are scaled between 1 and 0 per column. The displayed signatures were derived from published studies referenced in Table S1B. (C and D) Bar plots depicting the adjusted p values of relevant pathways specific to each MG (C) and MDM (D) clusters. Results were generated by gene set enrichment analyses of the top 30 significantly DE genes for each cluster (padjusted < 0.05) (see Table S2). (E) Line plot depicting the averaged enrichment scores of the 12- and 48-h glioblastoma MDM timestamp modules in each MDM cluster. (F) Pie chart representing each MG subset present as a percentage of total macrophages of a healthy brain captured by scRNA-seq. (G) Bar plot showing the adjusted p value of relevant significantly enriched pathways related to the top differentially expressed 30 genes increased in GPNMBlow or GPNMBhigh clusters (Table S3). Statistics: Fisher’s exact test in combination with the Benjamini-Hochberg method for correction of multiple hypotheses testing. (H) Violin plot of the GPNMBhigh signature enrichment score per MG and MDM cluster, showing percentages of macrophages assigned as GPNMBhigh per cluster. (I) Pie chart representing the macrophage subset composition assigned as GPNMBhigh TAMs captured by scRNA-seq of all tumors sequenced. (J) Scatter plot depicting the correlation between T cell content (as percentage of CD45+ cells) and the abundance of GPNMBhigh TAMs (as percentage of total TAMs) in glioblastoma patient sample scRNA-seq dataset., Each data point represents a single glioblastoma tumor (n = 22). Red line represents simple linear regression. The Pearson’s correlation coefficient and p value are depicted at the top right corner.
Figure 2
Figure 2
MES-like cancer cells and GPNMBhigh TAMs co-localize in hypoxic niches (A) Representative immunofluorescence staining on fresh-frozen brain tumor sections used in VISIUM 10X spatial transcriptomics. (B) Visualization of the classification of dominant niche and glioblastoma cellular subtype transcriptional activity per VISIUM 10X sequenced spot (see STAR Methods). (C) Spatial co-occurrence workflow: transcriptional modules from TAM subsets, glioblastoma cellular subtypes, and niches were assigned to each spot to infer correlation coefficients. (D) Central: correlation matrix of TAM subset transcriptional modules and either the glioblastoma cellular subtype (top) or microanatomical niche transcriptional modules (bottom) across all VISIUM 10X samples; dot color and size correspond to the correlation coefficient. LogFC of TAM subset, tumor niche, or glioblastoma cell subtype occurrence in recurrent compared with primary glioblastoma are shown in the bottom and right side of the matrix, respectively; data represented as mean + S.D. (E–G) Representative visualization of spatial transcriptomic analyses, highlighting GPNMBhigh deserted (1) and enriched (2) areas. Spots assigned as GPNMBlow or GPNMBhigh are overlayed onto the corresponding IF image (E) and paralleled to glioblastoma cellular subtypes (F) or microanatomical niches (G) as defined in (B). Statistics: Kendall trend test (D) (p < 0.05, ∗∗p < 0.01, ∗∗∗p < 0.001). See also Figure S2 and Table S2.
Figure S2
Figure S2
Spatial analyses of macrophage subsets and validation that lipid-laden macrophages transcriptionally represent GPNMBhigh TAMs in glioblastoma, related to Figures 2 and 3 (A) Schematic of the 3-step classification strategy to identify macrophage subset spatial distribution on a representative Visium 10X dataset from a primary PDG-Ink4a tumor. After assigning spots positive for a pan-macrophage signature (Aif1, Lgals3, Itga1, Trem2, P2ry12, and Siglech), spots are either classified as MG or MDMs based on microglia-specific gene expression (P2ry12 and Siglech). Curated gene signatures, specific to each MG or MDM clusters (see Table S1H), were used to assign a subset score. The highest subset score classified each respective spot to a specific TAM subset in the TME (right). (B) Representative IF images of fresh-frozen primary murine glioblastoma tissue sections (PDG-Ink4a). DAPI: nuclear stain (blue); IBA1: pan-macrophage (magenta); PLIN2: lipid droplets (LDs) (white); BODIPY: neutral lipid marker (yellow). Cells positive for IBA1, but negative for PLIN2 and BODIPY were identified as non-LLMs (left magnified). Cells positive for IBA1, PLIN2, and BODIPY were identified as LLMs (right magnified). (C) IF quantification of LLMs (IBA1+ cells with a surface area of ≥500 pixels [0.325 μm/pixel] and containing ≥5 PLIN2+ spots [defined as LDs]) as a percentage of total TAMs in primary and recurrent tumors isolated from PDG-Ink4a tumor-bearing mice. (D) Quantification of LLMs in hypoxic and non-hypoxic areas in primary and recurrent PDG-Ink4a glioblastoma. Linked pairs of dots represent the same sample. (E) Representative flow cytometry plots depicting the LLM FACS-purification gating strategy in a recurrent PDG-Ink4a glioblastoma. Live macrophages (CD45+CD11b+Ly6ClowLy6Glow) of each TAM subpopulations (MG; CD49dlow) and MDMs (CD49dhigh) were sorted as LLMs or non-LLMs (independently of their ontogeny) based on SSC-A (granularity) and BODIPY (neutral lipids) intensity. (F) Heatmap depicting the logFC of normalized gene expression between LLMs and non-LLMs from the RNA-seq analysis. Genes shown in heatmap are commonly upregulated in lipid-laden MG and MDMs represented in Figure 3B. Statistics: two-stage step-up unpaired t test (C) or two-tailed paired t test (D). Data are represented as mean + SEM (C).
Figure 3
Figure 3
Lipid-laden macrophage pro-tumorigenic phenotype correlates with loss of chromatin accessibility (A) Schematic overview of lipid-laden macrophage (LLM) multi-omics analyses. (B) Venn diagram of differentially expressed genes identified by RNA-seq in non-LLMs and LLMs from FACS-isolated MG and MDM subpopulations. (C) Stacked violin plots depicting TAM subset (from Figure 1E) transcriptional enrichment for gene signatures identified in RNA-seq analyses from FACS-purified macrophage subpopulations (Table S1D). (D) Average peak profiles (top) and heatmaps (bottom) depicting the normalized ATAC-seq (assay for transposase-accessible chromatin with sequencing) signals at differentially accessible chromatin regions in macrophage subpopulations. (E) LogFC of gene expression associated with higher and lower accessibility in LLM promoter regions, compared with expression of the same genes in non-LLMs from MG and MDM subpopulations. (F) Log10(FDR, false discovery rate) of significantly enriched gene sets based on gene expression associated with higher or lower promoter accessibility in MDM-LLMs compared with non-LLMs. (G) Normalized relevant ATAC-seq peak signals from MDM subpopulations. (H) Flow cytometry MFI of H3K27me3 in macrophage subpopulations. (I) Log2FC of MFI for the indicated cell surface marker expression in macrophage subpopulations. Statistics shown in Figure S3J. (J) Flow cytometry quantification of LLMs (BODIPYhigh, SSC-Ahigh). (K) Kaplan-Meier curve showing animal survival over time in control (DMSO); RT (5x2 Gy) and DMSO; SSO (30 mg/kg daily treatment); or RT + SSO treatment groups. (L) Flow cytometry quantification of LLMs (BODIPYhigh, SSC-Ahigh) from treatment groups in (K). Statistics: Wilcoxon signed-rank test (E), two-way ANOVA with Sídák correction for multiple comparisons (H and L), two-stage step-up unpaired t test with Benjamini, Krieger, and Yekutiel correction for multiple comparisons (J), or log-rank test (K). Data are represented as mean ± SEM (H–J and L). See also Figures S2, S3, and S4 and Tables S3 and S4.
Figure S3
Figure S3
Extended ontogeny-specific lipid-laden macrophage chromatin landscape analysis, related to Figure 3 (A) Normalized ATAC-seq signal at gene regions related to MG specific (Sall1) or MDM specific (Itga4) accessibility in LLMs and non-LLMs from MG and MDM subpopulations. (B) Venn diagram depicting the number of consensus peaks from the ATAC-seq in non-lipid-laden MG and MDMs. (C and D) Histogram showing the −log10(FDR) of significantly enriched gene sets in non-lipid laden MDMs (C) and MG (D) based on differentially expressed genes depicted in (B). Vertical line at −log10(FDR) = 2 represents the threshold for significance. Colors indicate the overlap between the differentially accessible genes and gene sets. (E) Venn diagram depicting the consensus peaks in LLMs versus non-LLMs from MG (top) and MDMs (bottom) determined from ATAC-seq analyses. (F) Dot plots depicting the −log10(FDR) of the motif enrichment analyses performed for all differentially accessible peaks in LLMs (left) and non-LLMs (right) from monocytic origin. Colors represent the logFC of the motif enrichment from the differentially accessible peaks compared with all peaks detected (background). Relevant motif clusters are highlighted in blue, and TFs related to these motifs are given in the bottom panels. (G) Heatmap depicting the logFC (comparison based on variable on x axis) of the gene expression of chromatin regulators determined from bulk RNA-seq analyses (shown in Figure 3B). (H) Histogram depicting the mean fluorescent intensity (MFI) of H3K27me3 in LLMs and non-LLMs from MG (purple) and MDM (blue) subpopulations from recurrent PDG-Ink4a tumor-bearing mice. (I) Quantification of mean fluorescent intensity (MFI) of EZH2 in LLMs and non-LLMs from MG and MDM subpopulations from primary (left) and recurrent (right) PDG-Ink4a tumor-bearing mice. (J) MFI of depicted cell surface markers in lipid-laden MG (left) and MDMs (right) compared with non-lipid-laden MG and MDMs from the same primary PDG-Ink4a glioblastoma samples. Statistics: two-stage step-up multiple paired t test with Benjamini, Krieger, and Yekutieli correction for multiple testing (H–J). Data shown as mean + SEM (H–J).
Figure S4
Figure S4
Validation of myelin-derived lipids as modulators of TAM phenotype, which can be altered by CD36 inhibition in combination with radiotherapy, related to Figures 3 and 4 (A) Dot plot displaying CD36 RNA expression levels in the most abundant cell types identified in the murine scRNA-seq dataset. Colors represent the average expression; size depicts the percentage of cells that express Cd36. (B) Quantification of mean fluorescent intensity (MFI) of CD36 in various cell populations in recurrent PDG-Ink4a tumors post RT at the trial endpoint. Tumor cells: CD45CD11bCD31 cells; endothelial cells: CD45CD11bCD31+ cells. All macrophages and LLM-macrophages: see Figure S2E. (C) Flow cytometry quantification of lipid-laden (BODIPYhighSSC-Ahigh) MG (left) and MDMs (right) in primary, 2 days post-5x2 Gy RT, and recurrent PDG-Ink4a glioblastoma. (D) Schematic overview of the experimental design and treatment schedules. Tumors were initiated as described in STAR Methods to generate PDG-Ink4a tumor-bearing mice. At 4–6 weeks post tumor initiation, tumor size was quantified by MRI, and block randomization was used to evenly distribute mice between treatment groups based on tumor volume (20–90 mm3). Treatment groups were control (DMSO), fractionated ionizing radiation (RT, 5 × 2 Gy), and DMSO, SSO (30 mg/kg daily treatment), or RT + SSO. DMSO and SSO treatments were initiated 48 h post last dose of RT in the combination groups. Mice were euthanized when symptomatic or at the indicated time points. (E) Graph depicting the mean fluorescent intensity (MFI) of lipid metabolism markers in MG (left) and MDMs (right) isolated from recurrent PDG-Ink4a tumors post RT + DMSO and RT + SSO treatment at the trial endpoint. (F) Flow cytometry quantification of MHC-II+ MDMs as a percentage of total MDMs in recurrent PDG-Ink4a tumors post RT + DMSO and RT + SSO treatment at the trial endpoint. (G) Quantification of CD3+ lymphoid cell populations (as percentage of CD45+ cells) in recurrent PDG-Ink4a glioblastoma post RT + DMSO or RT + SSO treatment at the trial endpoint. B cells: NK1.1CD19+; CD8T cells: NK1.1CD19CD3+CD8+; CD4T cells: NK1.1CD19CD3+CD4+. (H and I) Mean fluorescent intensity (MFI) of depicted activation markers in CD8 T cells (H) and CD4 T cells (I) from recurrent PDG-Ink4a glioblastoma post RT + DMSO or RT + SSO treatment at the trial endpoint. (J) Schematic of cholesterol de novo biosynthesis pathway, depicting cholesterol precursors and derivatives, as well as enzymes (in italics) involved. Enzymes and intermediates that are increased in LLMs are marked in green, decreased in red, as determined by lipidomics (Figures 4A–4C) and RNA-seq (Figure 4D). (K) Representative IF images of fresh-frozen recurrent PDG-Ink4a glioblastoma tissue sections illustrating the LLM location in relation to myelin basic protein. DAPI: nuclear stain (blue); IBA1: pan-macrophage (magenta); PLIN2: lipid droplets (LDs) (white); myelin basic protein (MBP) (yellow). T, tumor; H, adjacent healthy brain. (L) Pie chart depicting the average fraction of each major lipid species found in myelin isolated from healthy mouse brains. Data for this graph was extracted from NMR to quantify cholesterol (red) and Lipidyzer analysis quantifying other lipid classes (gray). Statistics: mixed-effects analysis (B and C) or two-way ANOVA with Sídák correction for multiple comparisons (E–I). Data are represented as mean + SEM (B and G–I), ± SEM (C, E, and F), or ± SD (L).
Figure 4
Figure 4
LLM formation relies on myelin phagocytosis and subsequent sterol accumulation (A and B) Normalized levels of depicted lipid classes (abbreviations in Figure S6J) and corrected area ratio of sterols in FACS-purified LLMs and non-LLMs. (C) Desmosterol concentration in FACS-purified LLMs and non-LLMs, assessed from the lipidomic analyses depicted in (B). (D) Normalized expression of cholesterol synthesis pathway genes in FACS-purified LLMs and non-LLMs from Figure 3B. (E) Average fraction of major lipid species present in myelin isolated from tumor. (F) Representative electron microscopy images of primary PDG-Ink4a tumor sections. Boxes 1.2 and 2.2 are high-magnification images from boxes 1.1 and 2.1, respectively. (G) Representative IF image of primary PDG-Ink4a tumor sections. DAPI: nuclear stain (blue); IBA1: pan-macrophage (magenta); PLIN2: lipid droplets (white); MBP: myelin basic protein (yellow). (H) Quantification of mean MBP intensity in TAM subsets in primary PDG-Ink4a tumors (as presented in Figure S4K). Each dot represents individual TAMs (IBA1+), size corresponds to cell area. (I) Visual IF image representation of an IBA1+PLIN2+ LLM and distance to myelin used to annotate individual TAMs (IBA1+) as MBP+ (minimal distance to MBP < 0 pixels), close to MBP (0–5 pixels), or far from MBP (>5 pixels). (J) Quantification of the total number of lipid droplets present in each TAM correlated to their minimal distance to MBP+ staining as described in (I). (K) Flow cytometry quantification of ex vivo LLMs (experiments depicted in Figure S5C). (L) Differentially expressed genes (Table S5A) identified in RNA-seq from FACS-purified dTomato+ BMDMs used in (K). (M) p values of relevant pathways enriched based on GSEA of signatures derived from (L) (Tables S5B–S5J). Statistics: two-way ANOVA with Sídák correction for multiple comparisons (A and B), two-tailed paired t test (C and D), pairwise comparison for analyzing multiple population means in pairs (H), pairwise comparison for analyzing multiple population means in pairs (J), one-way ANOVA with Sídák correction for multiple comparisons (K), Fisher’s exact test in combination with the Benjamini-Hochberg correction (M). Data are represented as mean + SEM (A–D and K) or ± SD (E). See also Figures S4 and S5 and Table S5.
Figure S5
Figure S5
Assessment of the impact of TME-mediated education and myelin uptake on TAM lipid metabolism and inflammation activity, related to Figures 4 and 5 (A) Representative spatial expression plot of de- and remyelination transcriptional modules overlayed on recurrent PDG-Ink4a tumor tissue used in VISIUM 10x spatial transcriptomics. (B) Dot plot representing the correlation matrix between de- or remyelination transcriptional signatures and healthy brain, tumor, glioblastoma cellular subtypes, glioblastoma niches, or TAM subsets transcriptional modules across all VISIUM 10x samples (n = 13, n = 4 PDG-Ink4a primary, n = 3 PDG-Ink4a recurrent, n = 3 PDG-p53 primary, n = 3 PDG-p53 recurrent). Dot color and size correspond to the correlation coefficient. (C) Schematic of ex vivo assay used for LLM quantification in Figure 4K and in (D). Tumors were extracted from PDG-Ink4a glioblastoma-bearing mice and dissociated as a single cell preparation prior to magnetic beads-isolation of myelin. The dissociated glioblastoma (with or without myelin) or myelin only (extracted from the tumor) was then added to dTomato+ BMDMs for 48 h, after which LLM formation was assessed by flow cytometry based on dTomato, SSC-A (granularity), and BODIPY staining (as described in Figure S2E). (D) Flow cytometry quantification of BODIPY (left) or SSC-A (right) mean fluorescence intensity (MFI) in dTomato+ BMDMs incubated with control media (gray); dissociated PDG-Ink4a primary tumors containing myelin (green) or not (red); tumor-extracted myelin (yellow). (E) Bar plots depicting the p values of relevant pathways related to TME-driven and Myelin-regulated genes depicted in Figure 4L. Genes driving pathway enrichment are stated within each respective bar. Colors represent pathways that belong to genes that are either down- (beige) or upregulated (red) within that signature (Tables S5F, S5G, S5K, and S5L). (F) Relative uptake of CFSE-labeled myelin or FluoSpheres based on mean fluorescent intensity (MFI) of BMDMs educated with conditioned media (CM) from ex vivo dissociated primary PDG-Ink4a tumors ± SSO (100 μM). Data normalized per experiment. (G) Relative expression of genes representative of the OPC and MES glioblastoma subtypes assessed by RT-qPCR in cell lines isolated from PDG-Ink4a primary (OPC-like) or recurrent (MES-like) glioblastoma. Represented genes were obtained from previously reported glioblastoma subtype classification, with OPC-like cells resembling the proneural state. Data scaled by columns. (H–J) Seahorse assay was performed on glioblastoma cell lines generated from primary (blue, n = 4) or recurrent (red, n = 4) PDG-Ink4a mice to assess (H and I) mitochondrial respiration and (J) glycolysis and glycolytic reserve. (H) Oxygen consumption rate (OCR) over time upon injection of drugs interfering with mitochondrial respiration, as indicated. (I) Left: OCR measured at start minus OCR after injection of antimycin A and rotenone reflects basal respiration; right: OCR difference measured of basal respiration and maximal OCR reflects maximal respiratory capacity. (J) Left: ECAR measured after injection of glucose reflects basal glycolytic activity; right: ECAR measured after injection of FCCP reflects glycolytic reserve. (K) In vitro assay experimental setup used to generate data for (L) and for Figures 5B, 5C, and S6C: bone marrow-derived macrophages (BMDMs) or primary MG were cultured in control media (10% FBS) or tumor-conditioned media (TCM) derived from OPC-like or MES-like glioblastoma cells for 24 h. When indicated, 2-DG was incorporated to the TCM preparation in order to block glycolysis. BMDMs were then exposed either to myelin for 3 h and maintained in culture for an additional 24 h before assessing LLM formation using flow cytometry analyses of intracellular BODIPY staining and SSC-A; or to myelin-CFSE or FluoSpheres for 3 h before assessing phagocytosis activity using flow cytometry analyses of the fluorescent phagocytic source. (L) Graph depicting the fold-change of CFSE-labeled myelin and FluoSpheres mean fluorescent intensity (MFI) (added 3 h before measurement) in BMDMs previously exposed to MES-like TCM for 24 h. Statistics: two-tailed unpaired t test. Statistics: Kendall trend test (B), one-way ANOVA Dunnett’s multiple comparisons test (D), Fisher’s exact test in combination with the Benjamini-Hochberg method for correction of multiple hypotheses testing (E), two-way ANOVA with Sídák correction for multiple comparisons (F), two-stage step-up multiple paired t test with Benjamini, Krieger, and Yekutieli method for multiple testing (G), or two-tailed unpaired t test (I, J, and L) (p < 0.05, ∗∗p < 0.01, ∗∗∗p < 0.001). Data are represented as mean + SEM (D, F, H–J, and L).
Figure 5
Figure 5
LXR pathway activation in LLMs stimulates lipid exchange within the TME (A) Extracellular acidification rate (ECAR) over time in Seahorse glycolytic activity assay on glioblastoma cell lines generated from primary/OPC-like (n = 4) or recurrent/MES-like (n = 4) PDG-Ink4a tumors. (B) Relative fold-change of myelin-carboxyfluorescein succinimidyl ester (CFSE) uptake (MFI) in BMDMs. (C) Relative fold-change of BODIPY MFI in myelin-exposed BMDMs over control (no myelin). (D) Relative fold-change of H3K27me3 MFI in BMDMs in monoculture (±myelin) or in co-culture with MES-like glioblastoma cells. (E and F) Relative expression LXR pathway genes assessed by quantitative real-time PCR (RT-qPCR) in BMDMs exposed to (E) control media or MES-like TCM, and (F) MES-like TCM ± myelin. (G) Expression levels of lipid export and lipoprotein receptor genes in the most abundant cell types identified in the murine scRNA-seq dataset (Figure 1B). (H) Free cholesterol quantified in the supernatant of BMDMs previously exposed to myelin for 24 h in vitro. (I) Experimental design illustrating the collection of TIF from glioblastoma (see STAR Methods). (J) Relative levels (sum of peaks) of total lipids detected in the TIF. (K) Fold-change in cholesteryl ester (CE) levels quantified in the TIF compared with Ntb tissue (control). Statistics: Friedman test with Dunn’s correction for multiple comparisons (B, C, J, and K), one-way ANOVA with Sídák (D), two-way ANOVA with Sídák correction for multiple comparisons (E and F), or two-tailed paired t test (H). Data are represented as mean + SEM (A–C) or ± SEM (D–F, H, J, and K). See also Figure S5 and S6.
Figure S6
Figure S6
Analysis of myelin-induced LXR activation in macrophages orchestrating lipid exchanges in the TME, related to Figure 5 (A) Representative flow cytometry plots from BMDMs exposed to MES-like TCM ± myelin as shown in Figure S5K. Gate is set on BODIPYhigh and SSC-Ahigh BMDMs to identify LLMs in vitro. (B) Flow cytometry quantification of LLMs (BODIPYhigh, SSC-Ahigh) as a percentage of primary microglia (MG) previously exposed to control media or MES-like TCM, 24 h post myelin debris exposure (3 h). (C) BODIPY MFI fold-change in MES-like TCM-educated BMDMs after exposure to myelin (3 h), compared with no myelin exposure. MES-like TCM was collected from cells treated or not with the glycolysis inhibitor 2-DG (Figure S5K). Lipid accumulation in response to myelin uptake in BMDMs was assessed by flow cytometry using BODIPY staining. (D and E) Relative expression of genes representative of the LLM signature (as established in Figure 1I) was assessed by qPCR in BMDMs exposed to (D) MES-like TCM ± myelin for 1 or 24 h, (E) control media, or MES-like TCM alone. (F) Relative expression of Abca1, Abcg1, Dhcr24, and Nr1h3 as assessed by qPCR in BMDMs conditioned with MES-like TCM and exposed to myelin ± LXR inhibitor. (G and H) Immunofluorescence staining of Filipin (cholesterol stain) was performed on in vitro BMDMs conditioned with MES-like TCM ± LXR inhibitor (LXRi) for 24 h and exposed or not to myelin (3 h). Histogram depicting mean intensity of Filipin per BMDM (G) or per lipid droplet in BMDMs (H). Lines represent median and quartiles. (I) Violin plots depicting normalized gene expression levels of the cholesterol efflux-related genes Abca1, Abcg1, Apoc1, and Apoe in LLMs and non-LLMs, extracted from the murine scRNA-seq dataset. (J) Fold-change in the depicted lipid classes quantified by lipidomics analyses in the TIF of primary/OPC-like and recurrent/MES-like PDG-Ink4a tumors compared with non-tumor-bearing brain (Ntb) tissue. BRSE, brassicasterol ester; CASE, campesterol ester; CL, cardiolipin; CE, cholesteryl ester; Cer_BS, ceramide beta-hydroxy fatty acid-sphingosine; Cer_NS, ceramide non-hydroxyfatty acid-sphingosine; CoQ, coenzyme Q; DG, diacylglycerol; FA, free fatty acid; LPC, lysophophatidylcholine; LPI, lysophosphatidylinositol; MGDG, monogalactosyldiacylglycerol; PA, phosphatidic acid; PC, phosphatidylcholine; PE, phosphatidylethanolamine; PE_Cer, ceramide phosphoethanolamine; PG, phosphatidylglycerol; PI, phosphatidylinositol; PI_Cer, ceramide phosphoinositol; PS, phosphatidylserine; SHexCer, sulfatide; SM, sphingomyelin; SSulfate, sterol sulfate; TG, triacylglycerol; CAR, acylcarnitine; ST, sterol. (K) Relative fold-change of ceramide (Cer) species levels in the interstitial fluid (IF) of Ntb mice, primary/OPC-like and recurrent/MES-like PDG-Ink4a tumors. (L) Total lipid levels (sum peak area) detected in the IF of Ntb, primary, RT-recurrent, and SSO-treated recurrent PDG-Ink4a tumors. Data points in the Ntb, primary, and recurrent PDG-Ink4a group from Figure 5J. (M) Relative levels of cholesteryl ester (CE) quantified in the tumor interstitial fluid (TIF) of Ntb, primary, RT-recurrent, and SSO-treated recurrent PDG-Ink4a tumors. Data points in the Ntb, primary, and recurrent PDG-Ink4a group from Figure 5K. Statistics: two-way ANOVA with Sídák correction for multiple comparisons (B, D–F, J, and K), two-stage step-up ratio paired t test (C), or mixed-effects analysis with Sídák correction for multiple comparisons (G, H, L, and M). Data are represented as mean + SEM (B, C, and F) and ± SEM (D, E, and J–M).
Figure S7
Figure S7
Conserved human mesenchymal glioblastoma metabolic properties in murine tumors, which underlie MES-like tumor cells’ requirement to outsource lipidic needs, related to Figure 6 (A) Dot plot displaying the expression levels of de novo cholesterol biosynthesis genes in the most abundant cell types identified in the murine scRNA-seq dataset (Figure 1B). Color represents the average expression; size depicts percentage of cells that express each specific gene. (B) Dot plot displaying the expression levels of de novo cholesterol biosynthesis and import genes in the glioblastoma cell subtypes identified in patient scRNA-seq datasets. Dot color represents the average expression; size depicts percentage of cells expressing each specific gene. (C) Radar plot depicting normalized GSEA scores (between 0 and 1 based on each pathway) of the represented metabolic pathways (KEGG) between OPC, MES, NPC, and AC glioblastoma cancer cells extracted from patient scRNA-seq datasets. Gray area represents the average activity in each metabolic pathway across all tumor cells. (D) Graph depicting MFI of CFSE-labeled myelin uptake in BMDMs or OPC-like and MES-like glioblastoma cells. (E) Schematic of ex vivo assay used for EdU and Annexin V staining as depicted in (F) and in Figures 6K and S8G–S8I. Primary tumors were extracted from PDG-Ink4a glioblastoma-bearing mice and dissociated as single cells prior to magnetic beads-mediated myelin removal and/or CD11b+ cell depletion. The dissociated tumors were then placed in culture for 24 h, media was refreshed to remove cellular debris, and LXRi, ABCA1i, or BMDMs were added when specified. Tumor cell proliferation (EdU staining) or viability (Annexin V, Zombie) was assessed after 48 h by flow cytometry. (F) Histogram depicting the fold-change of tumor cells in S phase (EdU+) compared with tumor cells without CD11b+Abca1/Abcg1KO BMDMs ± myelin. Culture conditions are described in (E). (G) Schematic of in vitro LLM/glioblastoma cell co-culture experimental design: BMDMs educated in OPC-like or MES-like TCM as previously described (Figure S5K) were exposed to (1) clickable cholesterol overnight or (2) myelin for 3 h and placed in co-culture with glioblastoma cells. (1) Uptake/transfer of cholesterol from BMDMs to glioblastoma cells was measured by flow cytometry after 0, 1, and 3 h of co-culture to reveal macrophage-derived cholesterol uptake with a Click-iT reaction (see STAR Methods). (2) Glioblastoma cell proliferation was measured by flow cytometry after 48 h of co-culture (EdU staining). (H) Schematic of in vitro LLM/MES-like glioblastoma cancer cell co-culture design to study effect of macrophage-mediated myelin recycling on tumor cell lipidome and transcriptome: MES-like tumor cells were grown in 2% lipid-free FBS DMEM before addition of BMDMs (or not) to the co-culture. After 24 h, myelin was added for different durations (0, 6, or 24 h) prior to MES-like tumor cells and BMDMs FACS-isolation and downstream bulk RNA-seq or lipidomics analyses (see STAR Methods). (I) Volcano plot depicting the differentially expressed genes between MES-like tumor cells cultured with myelin debris for 24 h or not. Colors correspond to significantly increased (red) or decreased (blue) genes. Genes are identified by bulk RNA-seq from FACS-purified MES-like tumor cells as depicted in (H). (J) Bar plots depicting the adjusted p values of relevant pathways specific to genes downregulated (blue) or upregulated (red) in MES-like tumor cells in response to myelin exposure in monoculture from (I). Statistics: one-way ANOVA (D) or two-way ANOVA with Sídák correction for multiple comparisons (F) or Fisher’s exact test in combination with the Benjamini-Hochberg method for correction of multiple hypotheses testing (J). Data are represented as mean ± SEM (D and F).
Figure 6
Figure 6
LLM-mediated lipid export fuels MES-like cell malignancy in the lipid-scarce glioblastoma TME (A) Normalized GSEA scores in glioblastoma cell subtypes from murine scRNA-seq dataset. Gray areas = average metabolic activity of each pathway. (B) Expression levels of cholesterol biosynthesis and import genes in glioblastoma cell subtypes from murine scRNA-seq dataset. (C) Flow cytometry MFI quantification of cholesterol content in glioblastoma cells following co-culture with BMDMs previously loaded with clickable cholesterol (Figure S7G). (D) Fold-change expression (x axis) and −log10p value (y axis) of depicted lipid classes quantified in MES-like tumor cells in mono- or co-culture with TAMs + myelin, compared with no myelin (Figure S7H). (E) Cholesterol and triglyceride (TG) levels in MES-like glioblastoma cells exposed to myelin in monoculture or co-culture with BMDMs. (F) Relative distribution (based on lipid ng/μg protein) of labeled 13C among lipid classes quantifiable 24 h after administration of CE13C-FA in MES-like glioblastoma cells in vitro (n = 3). (G) Quantification of metabolized CE13C-FA per lipid species in which U13C-FA18:1 was detected. (H) Percentage of glioblastoma cells in S phase (EdU+) after 48 h co-culture with TCM-conditioned BMDMs ± myelin (Figure S7G). EdU, 5-ethynyl 2′-deoxyuridine. (I) Electron microscopy representative images depicting the contact points between MES-like tumor cells (T) and myelin-loaded BMDMs (M). LD, lipid droplet; CV, coated vesicle; MD, myelin debris. (J) Percentage of MES-like glioblastoma cells in S phase (EdU+) after 48 h of co-culture with TCM-conditioned BMDMs ±myelin, ±CD36 inhibitor (SSO) ±ABCA1 inhibitor valspodar (ABCA1i). (K) Viable glioblastoma cells (ZombieNIR, Annexin V) as a percentage of total tumor cells in dissociated glioblastoma where myeloid cells were maintained (+CD11b+) or ex vivo depleted (−CD11b+) (Figure S7E) ± ABCA1i or LXR inhibitor GSK2033 (LXRi). Statistics: two-way ANOVA (C, E, H, and K) and mixed-effects analysis with Sídák correction for multiple comparisons (J). Data are represented as mean + SEM (C, E, G, H, J, and K). See also Figures S7 and S8 and Table S6.
Figure S8
Figure S8
Extended analyses of macrophage-mediated myelin recycling on shielding tumor cells from lipotoxicity and fueling MES-like cells in an LXR-Abca1/Abcg1-dependent manner, related to Figure 6 (A) Venn diagram depicting the differentially expressed genes in MES-like tumor cells co-cultured with BMDMs in the absence (control) or presence of myelin debris (+myelin debris), compared with MES-like tumor cells in monoculture (Table S6). Genes are identified by bulk RNA-seq from FACS-purified MES-like tumor cells as described in Figure S7H. (B) Bar plots depicting the p values of pathways downregulated (left) and upregulated (right) in MES-like tumor cells in co-culture with BMDMs (±myelin debris) compared with MES-like tumor cells in monoculture from Figure S7H. (C) Representative IF images of MES-like tumor cells exposed to cholesteryl esters (CEs) containing a click handle on the cholesterol (left, yellow) or fatty acid (right, pink) at various time point (0, 8, and 24 h post addition of Click-CE). DAPI: nuclear stain (blue). (D) Representative flow cytometry plots depicting the gating strategy for the EdU proliferation assay analyses, in which EdU+ cells are depicting cells in S phase, as shown in (E), (F), and Figures 6H and 6J. (E) Graph depicting the percentage of live glioblastoma cells in S phase (EdU+) assessed 48 h post co-culture with TCM-preconditioned BMDMs previously exposed to myelin (3 h) or not and separated by transwells. (F) Graph depicting the percentage of MES-like glioblastoma cells in S phase (EdU+) assessed after 48 h of co-culture with WT or Abca1/Abcg1 KO BMDMs previously educated in MES-like TCM ± myelin (3 h). (G) Quantification of viable glioblastoma cells (ZombieNIR, Annexin V) as a percentage of total tumor cells (CD45CD11b cells) in ex vivo assays (Figure S7E). PDG-Ink4a glioblastoma from tumor-bearing mice was dissociated into single cells and cultured in media supplemented with lipid-rich FBS. Myeloid cells were either maintained (+CD11b+) or depleted (−CD11b+) from the dissociated tumor, and the ABCA1 inhibitor valspodar (ABCA1i) or LXR inhibitor GSK2033 (LXRi) were added. (H and I) Quantification of viable glioblastoma cells (ZombieNIR, Annexin V) as a percentage of total tumor cells (CD45CD11b cells) in ex vivo assays (Figure S7E). PDG-Ink4a glioblastoma from tumor-bearing mice was dissociated into single cells and cultured in media supplemented with lipid-free FBS. Myeloid cells were depleted (−CD11b+) before addition of WT or Abca1/Abcg1 KO BMDMs (previously exposed to myelin debris or not) to the dissociated tumor ± LXR inhibitor GSK2033 (LXRi). Data points from non-treated (no Tx) controls in (I) are taken from (H). Statistics: Fisher’s exact test in combination with the Benjamini-Hochberg method for correction of multiple hypotheses testing (B), two-way ANOVA with Sídák correction for multiple comparisons (E and G–I), or mixed-effects analysis with Tukey’s correction for multiple comparisons (F). Data are represented as mean + SEM (E–I).
Figure 7
Figure 7
Lipid-laden macrophages predict patients’ clinical outcome (A) Kaplan-Meier curves of glioblastoma patients, stratified by low and high LLM signature enrichment in primary Isocitrate dehydrogenase wild-type (IDHWT) glioblastoma patients. (B and C) Boxplots depicting the single-sample (ss) GSEA scores of the LLM signature for all IDHWT glioblastoma samples segregated according to their dominant transcriptional subtype (CL, classical; MES, mesenchymal; PN, proneural) in the (B) TCGA and (C) GLASS datasets. (D and E) Heatmap of the LLM gene signature expression in primary IDHWT glioblastoma tumors stratified by low/high LLM enrichment scores based on ssGSEA scores. (F) Kaplan-Meier curves of glioblastoma patients, stratified by low and high LLM signature enrichment in primary IDHWT glioblastoma patients excluding MES glioblastoma. (G) Left: schematic overview of pan-cancer TAM analysis.,, Right: violin plot depicting the average LLM signature scores in TAMs. (H) Percentage of LLMs in scRNA-seq datasets of treatment-naive, recurrent, and neoadjuvant anti-PD-1-treated glioblastoma patient samples. (I) Percentage of non-LLM or LLM TAMs in responder and non-responder melanoma patients prior to ICB treatment. (J) Receiver operating characteristic curves comparing the predictive value of tumor mutational burden, LLMs, non-LLMs, and total macrophages as a percentage of CD45+ cells to predict ICB response in melanoma. Statistics: log-rank test (A and F), Kruskal-Wallis test and the pairwise comparisons with Wilcoxon-test (B and C), one-way ANOVA with Sídák correction for multiple comparisons (H), two-tailed paired t test (I), or unpaired two-sided bootstrap test (J). Data are represented as mean ± SEM (H and I).

Similar articles

Cited by

References

    1. Erbani J., Boon M., Akkari L. Therapy-induced shaping of the glioblastoma microenvironment: macrophages at play. Semin. Cancer Biol. 2022;86:41–56. doi: 10.1016/j.semcancer.2022.05.003. - DOI - PubMed
    1. Puchalski R.B., Shah N., Miller J., Dalley R., Nomura S.R., Yoon J.-G., Smith K.A., Lankerovich M., Bertagnolli D., Bickley K., et al. An anatomic transcriptional atlas of human glioblastoma. Science. 2018;360:660–663. doi: 10.1126/science.aaf2666. - DOI - PMC - PubMed
    1. Klemm F., Maas R.R., Bowman R.L., Kornete M., Soukup K., Nassiri S., Brouland J.-P., Iacobuzio-Donahue C.A., Brennan C., Tabar V., et al. Interrogation of the microenvironmental landscape in brain tumors reveals disease-specific alterations of immune cells. Cell. 2020;181:1643–1660.e17. doi: 10.1016/j.cell.2020.05.007. - DOI - PMC - PubMed
    1. Friebel E., Kapolou K., Unger S., Núñez N.G., Utz S., Rushing E.J., Regli L., Weller M., Greter M., Tugues S., et al. Single-cell mapping of human brain cancer reveals tumor-specific instruction of tissue-invading leukocytes. Cell. 2020;181:1626–1642.e20. doi: 10.1016/j.cell.2020.04.055. - DOI - PubMed
    1. Couturier C.P., Ayyadhury S., Le P.U., Nadaf J., Monlong J., Riva G., Allache R., Baig S., Yan X., Bourgey M., et al. Single-cell RNA-seq reveals that glioblastoma recapitulates a normal neurodevelopmental hierarchy. Nat. Commun. 2020;11 doi: 10.1038/s41467-020-17186-5. - DOI - PMC - PubMed