. 2024 Aug 23;69(17):10.1088/1361-6560/ad6edd.
doi: 10.1088/1361-6560/ad6edd.

Turn-table micro-CT scanner for dynamic perfusion imaging in mice: design, implementation, and evaluation

Affiliations

Turn-table micro-CT scanner for dynamic perfusion imaging in mice: design, implementation, and evaluation

A J Allphin et al. Phys Med Biol. .

Abstract

Objective.This study introduces a novel desktop micro-CT scanner designed for dynamic perfusion imaging in mice, aimed at enhancing preclinical imaging capabilities with high resolution and low radiation doses.Approach.The micro-CT system features a custom-built rotating table capable of both circular and helical scans, enabled by a small-bore slip ring for continuous rotation. Images were reconstructed with a temporal resolution of 3.125 s and an isotropic voxel size of 65µm, with potential for higher resolution scanning. The system's static performance was validated using standard quality assurance phantoms. Dynamic performance was assessed with a custom 3D-bioprinted tissue-mimetic phantom simulating single-compartment vascular flow. Flow measurements ranged from 1.51to 9 ml min-1, with perfusion metrics such as time-to-peak, mean transit time, and blood flow index calculated.In vivoexperiments involved mice with different genetic risk factors for Alzheimer's and cardiovascular diseases to showcase the system's capabilities for perfusion imaging.Main Results.The static performance validation confirmed that the system meets standard quality metrics, such as spatial resolution and uniformity. The dynamic evaluation with the 3D-bioprinted phantom demonstrated linearity in hemodynamic flow measurements and effective quantification of perfusion metrics.In vivoexperiments highlighted the system's potential to capture detailed perfusion maps of the brain, lungs, and kidneys. The observed differences in perfusion characteristics between genotypic mice illustrated the system's capability to detect physiological variations, though the small sample size precludes definitive conclusions.Significance.The turn-table micro-CT system represents a significant advancement in preclinical imaging, providing high-resolution, low-dose dynamic imaging for a range of biological and medical research applications. Future work will focus on improving temporal resolution, expanding spectral capabilities, and integrating deep learning techniques for enhanced image reconstruction and analysis.

Keywords: bioprinted phantom; contrast agents; micro-CT; perfusion imaging; preclinical.


Figures

Figure 1:
Figure 1:
CAD model (left) and photograph (right) of the micro-CT system. The bubble labels correspond to the rows of Table 1. We note that the object-to-be-scanned is placed on the platform above the slip ring (bubble 5). We also note that the CAD model is shown with the translating platform in the highest possible position. The platform can translate down approximately 22 cm from the position shown. The black and silver box in the photograph to the rear of the detector (bubble 1) is a counterweight for balance.
Figure 2:
Figure 2:
Perfusion phantom design. A) The digital CAD model with diameter specifications. B) A photograph of the phantom filled with red-dyed phosphate-buffered saline (PBS) solution. C) A micro-CT scan of the phantom filled with iodinated contrast. The color bar shows the image windowing in Hounsfield units (HU).
Figure 3:
Figure 3:
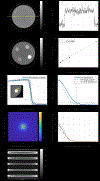
Standard quality assessment using commercial QA phantoms. A) Axial view of the water phantom alongside a line profile illustrating uniformity. B) Axial view of the high contrast HA phantom alongside a plot of measurements illustrating CT number linearity. C) Plot of the radial lines used to construct the ESF alongside the MTF estimation. We have included in the ESF plot a small image showing how these profiles were sampled. D)NPS derived from the water phantom. The left image shows a 2D slice of the NPS while the right plot shows the average of 8 radial lines extending from the center of the NPS. E) Sagittal view of the Defrise phantom illustrating the presence of cone-beam artifacts. All CT images are displayed in grayscale with associated color bars in HU.
Figure 4:
Figure 4:
Effect of iterative reconstruction on image noise levels. The left column contains weighted filtered back projection (FBP) reconstructions, and the right column contains iterative reconstructions. We have included the time-average images as a reference to illustrate the increase in noise that comes with temporal under sampling. These images are windowed according to the color bar in HU.
Figure 5:
Figure 5:
Temporal phantom reconstruction results for each of the 6 flow rates at each of 20 timepoints. We show cropped views of the phantoms in the upper portion of this figure organized as rows with different colors. These colors match the gamma variate curves in the lower plot. These curves were generated by fitting a gamma variate function to mean measurements at the phantom inlet. Each curve represents a different circulating flow speed. We note the appropriate relative decrease in curve width associated with increasing fluid flow. It’s also worth noting that due to the lower apparent pressure at 1.5 mL/min, contrast flowed through one branch of the phantom for the first few timepoints due to a slight difference in resistance between the two branches. The color bar in the upper right indicates the windowing for the CT images in HU.
Figure 6:
Figure 6:
Quantitative perfusion phantom results. The upper images show a 2D view of three perfusion metric maps: (from top to bottom) time-to-peak, mean transit time, and blood flow index. The lower plots show a mean ROI measurement for each image. We have also included a line fitted to the blood flow index measurements. This line, with its associated R2 value (0.906), serves as a quantitative assessment of the linearity and relative accuracy of our blood flow measurements.
Figure 7:
Figure 7:
Temporal reconstruction results for the APOE44 mouse. The left images are maximum intensity projections intended to capture some key vessels and structures in the brain, lungs, and kidneys (from top to bottom). The upper left image within each montage is the first reconstructed CT timepoint. All subsequent images show the other timepoints minus the first timepoint (e.g., 20 – 1 for the last image). The injection occurred just before the second timepoint at t=3s. The 3 body regions were acquired as 3 separate, serial scans. Each timepoint represents a period of 3.125 seconds. The color bar in the upper right of each image group indicates the windowing of the images in HU. To the right of the image montages, we show gamma variate curves fit to ROI mean values for the 20 timepoints. We include the R2 value for each fit.
Figure 8:
Figure 8:
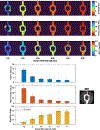
Quantitative in vivo perfusion results. The upper images show spatial perfusion maps—TTP, MTT, and BFI—for 3 body regions. The left and right images within each pair correspond to the 2 mice in our study. The left mouse (“Mouse 1”) is homozygous for APOE3 while the right mouse (“Mouse 2”) is homozygous for APOE4. These spatial maps are overlaid on the 11th-timepoint CT images to provide anatomical context. The plots in the bottom portion of the figure show measurements of the 3 spatial perfusion maps in various anatomical regions.

References

    1. Miles KA and Griffiths MR, Perfusion CT: a worthwhile enhancement? The British Journal of Radiology, 2003. 76(904): p. 220–231. - PubMed
    1. Hayasaka N, et al. , In Vivo Diagnostic Imaging Using Micro-CT: Sequential and Comparative Evaluation of Rodent Models for Hepatic/Brain Ischemia and Stroke. PLOS ONE, 2012. 7(2): p. e32342. - PMC - PubMed
    1. Clark DP and Badea CT, Micro-CT of rodents: State-of-the-art and future perspectives. Physica Medica, 2014. 30(6): p. 619–634. - PMC - PubMed
    1. Badea CT, et al. , Lung perfusion imaging in small animals using 4D micro-CT at heartbeat temporal resolution. Medical Physics, 2010. 37(1): p. 54–62. - PMC - PubMed
    1. Song J, et al. , Sparseness prior based iterative image reconstruction for retrospectively gated cardiac micro-CT. Medical Physics, 2007. 34(11): p. 4476–4483. - PMC - PubMed

Publication types

LinkOut - more resources