. 2024 Dec;17(6):1212-1221.
doi: 10.1016/j.mucimm.2024.08.004. Epub 2024 Aug 11.

RIPK3 and caspase-8 interpret cytokine signals to regulate ILC3 survival in the gut

Affiliations

RIPK3 and caspase-8 interpret cytokine signals to regulate ILC3 survival in the gut

Ann M Joseph et al. Mucosal Immunol. 2024 Dec.

Abstract

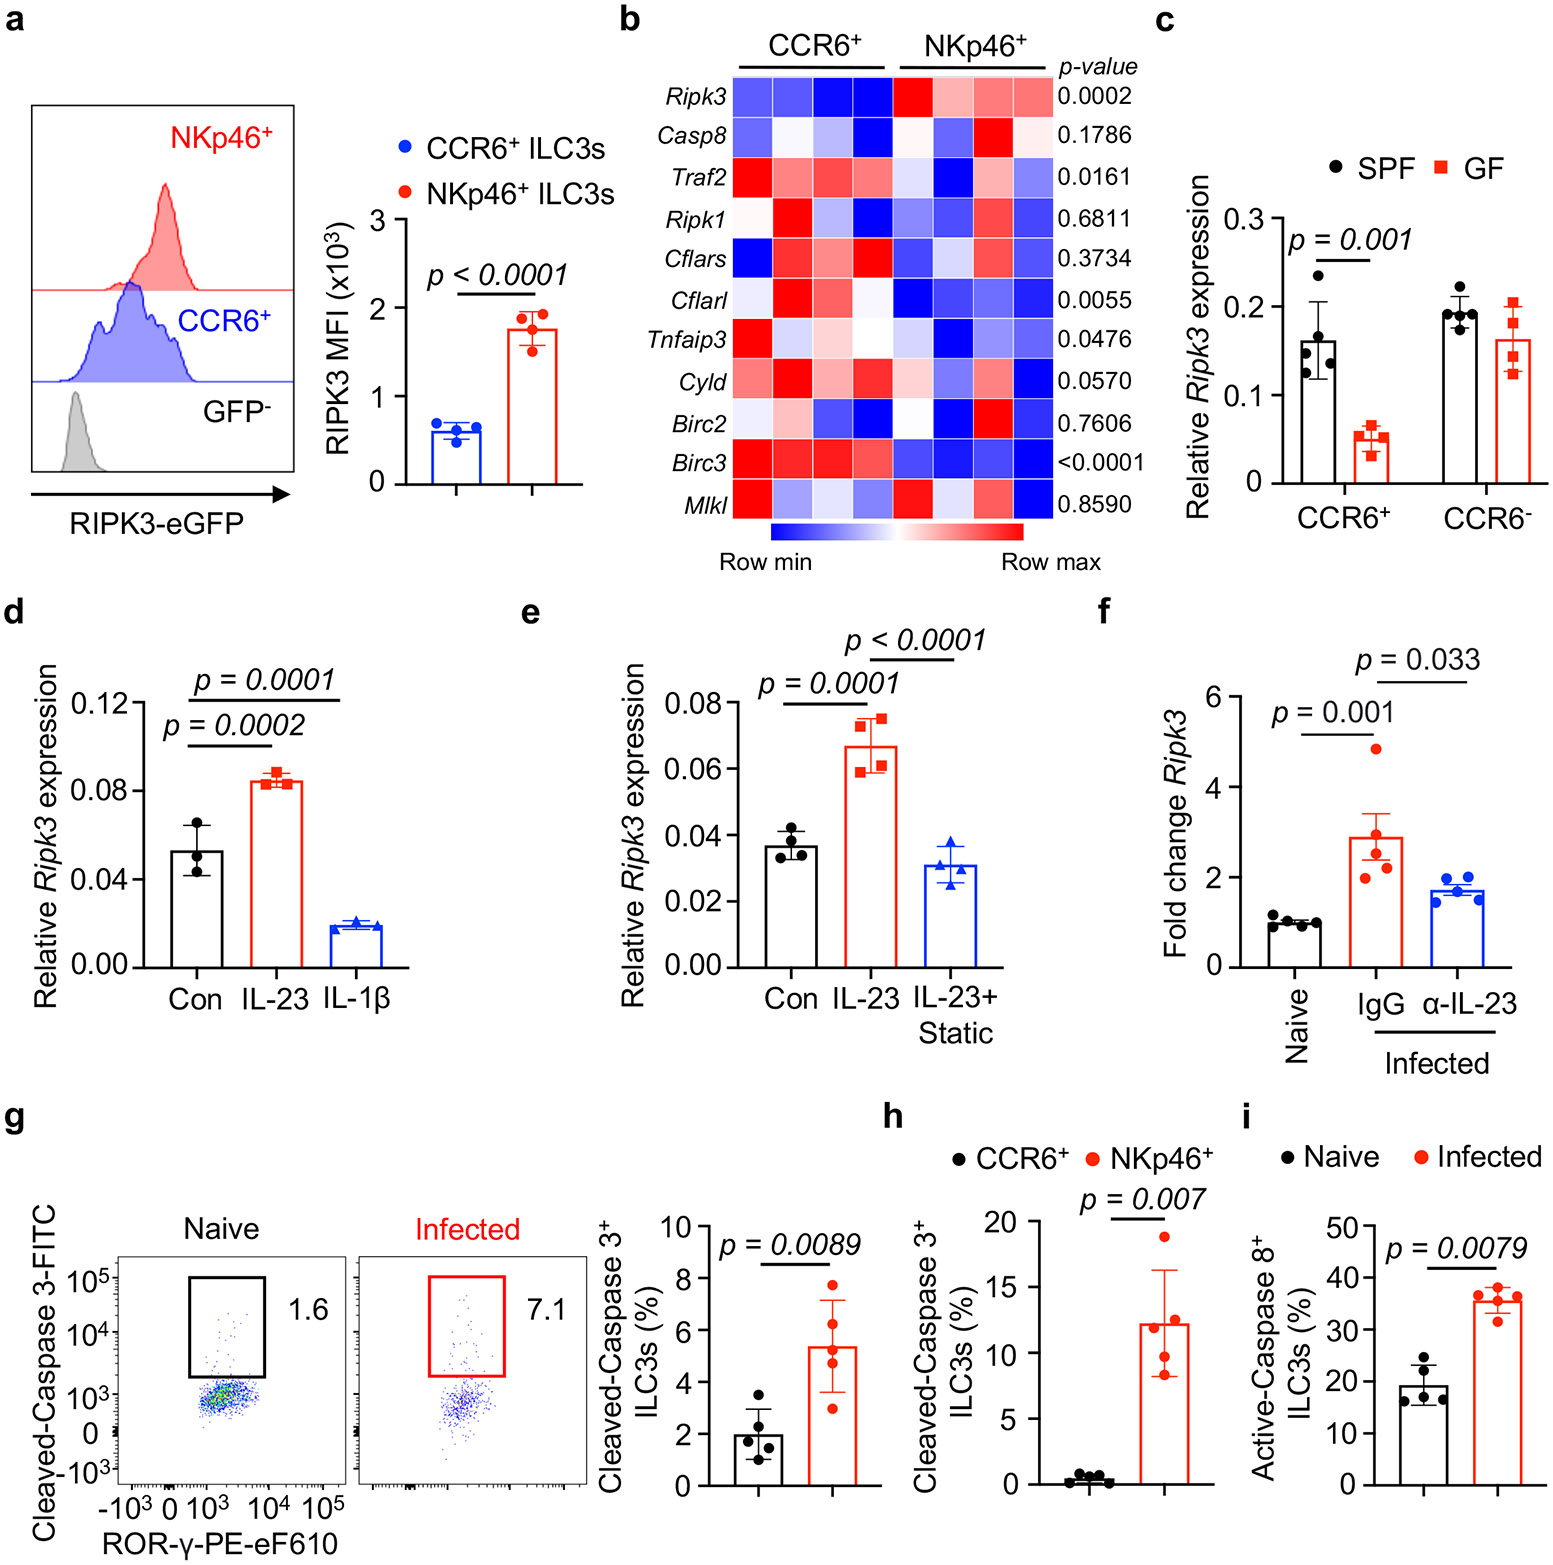
Group 3 innate lymphoid cells (ILC3s) are abundant in the developing or healthy intestine to critically support tissue homeostasis in response to microbial colonization. However, intestinal ILC3s are reduced during chronic infections, colorectal cancer, or inflammatory bowel disease (IBD), and the mechanisms driving these alterations remain poorly understood. Here we employed RNA sequencing of ILC3s from IBD patients and observed a significant upregulation of RIPK3, the central regulator of necroptosis, during intestinal inflammation. This was modeled in mice where we found that intestinal ILC3s express RIPK3, with conventional (c)ILC3s exhibiting high RIPK3 and low levels of pro-survival genes relative to lymphoid tissue inducer (LTi)-like ILC3s. ILC3-specific RIPK3 is promoted by gut microbiota, further upregulated following enteric infection, and dependent upon IL-23R and STAT3 signaling. However, lineage-specific deletion of RIPK3 revealed a redundant role in ILC3 survival, due to a blockade of RIPK3-mediated necroptosis by caspase 8, which was also activated in response to enteric infection. In contrast, lineage-specific deletion of caspase 8 resulted in loss of cILC3s from the healthy intestine and all ILC3 subsets during enteric infection, which increased pathogen burdens and gut inflammation. This function of caspase 8 required catalytic activity induced by TNF or TL1A and was dispensable if RIPK3 was simultaneously deleted. Caspase 8 activation and cell death were associated with increased Fas on ILC3s, and the Fas-FasL pathway was upregulated by cILC3s during enteric infection, which could restrain the abundance of intestinal ILC3s. Collectively, these data reveal that interpretation of key cytokine signals controls ILC3 survival following microbial challenge, and that an imbalance of these pathways, such as in IBD or across ILC3 subsets, provokes depletion of tissue-protective ILC3s from the inflamed intestine.

Keywords: Cytokines; IBD; Innate immunity; Innate lymphoid cells; Mucosal inflammation.


Conflict of interest statement

Declaration of competing interest The authors declare the following financial interests/personal relationships which may be considered as potential competing interests: G.F.S. is on the Editorial Board of Mucosal Immunology. No other authors have a conflict of interest.

Figures

Figure 1 ∣
Figure 1 ∣. Depletion of ILC3s in human IBD is associated with an upregulation of RIPK3.
a, Flow cytometry plots of ILC3s and ILC1s in the inflamed or normal adjacent tissue of IBD patients. Populations gated on Live CD45+, Lineage, CD3e, CD127+, CRTH2. b,c, Frequencies of NKp44+ (b) or NKp44 (c) ILC3s in normal adjacent or inflamed tissue of IBD patients. d, Frequencies of ILC1s in normal adjacent or inflamed tissue of IBD patients. e, Volcano plot of differentially expressed genes (DEGs) in bulk RNA-seq dataset of ILC3s sorted from the inflamed or normal adjacent intestinal tissue of IBD patients. f, Heat map of cell death associated pathways in sorted ILC3s. The statistics in b,c,d were calculated by paired, two-tailed student’s t-tests. The statistics in f were calculated using the Wald test within DESeq2.
Figure 2 ∣
Figure 2 ∣. Microbial colonization and IL-23 upregulate RIPK3 in intestinal ILC3s.
a, Representative histogram plots with bar graph showing MFI of RIPK3-eGFP expression in the large intestine lamina propria ILC3 subsets (n = 4 mice). Populations gated as Live CD45+, Lineage, CD90.2+, CD127+, KLRG1, NK1.1, c-kit+ cells. b, Heat map showing expression of genes regulating caspase 8-RIPK3 mediated cell death by qPCR in CCR6+ and NKp46+ ILC3s isolated from the small intestine lamina propria of mice. c, Ripk3 gene expression in ILC3s isolated from the large intestine lamina propria of specific pathogen free (SPF) or germ free (GF) mice (n = 5 or 4 mice). d,e, Ripk3 gene expression in sorted CCR6+ ILC3s treated in vitro with indicated cytokines (d) and cytokines with and without STAT3-inhibitor Static (e) (n = 3 or 4 mice). f, Ripk3 expression in ILC3s sorted from the large intestine lamina propria of naïve mice or mice infected with C. rodentium treated with IgG control or anti-IL-23 antibody (n = 5 mice). g-i, Flow cytometry plots with bar graph showing cleaved caspase 3 in ILC3s (g), across ILC3 subsets (h), and bar graph showing active caspase 8 levels in ILC3s (i) from the large intestine lamina propria of naïve and C. rodentium infected C57BL/6 mice at day 7 post infection (n = 5 mice). Gene expression was normalized to Hprt in all experiments. Data in a-i is representative of two independent experiments with similar results. Statistics were calculated by unpaired, two-tailed student’s t-tests or by Mann–Whitney U-test (unpaired, two-tailed).
Figure 3 ∣
Figure 3 ∣. Caspase 8 blocks RIPK3 to permit ILC3 survival in the healthy gut.
a-c, Frequency (a) and cell counts of total ILC3s (b) and ILC3 subsets (c) in the large intestine lamina propria of Casp8f/f and RORγtcre Casp8f/f mice (n = 3 or 4 mice). d-f, Frequency (d) and cell counts of total ILC3s (e) and ILC3 subsets (f) in the large intestine lamina propria of catalytically dead Casp8(cd)f/f and RORγtcre Casp8(cd)f/f mice (n = 3 mice). g-i, Frequency (g) and cell counts of ILC3s (h) and ILC3 subsets (i) in the large intestine lamina propria of Casp8f/f, RORγtcre Casp8f/f and RORγtcre Casp8f/f Ripk3f/f (n = 4 mice). Data is representative of two independent experiments with similar results. Statistics in a-i were calculated by unpaired, two-tailed student’s t-tests.
Figure 4 ∣
Figure 4 ∣. ILC3-intrinsic caspase 8 promotes cell survival and protects from gut inflammation.
a-c, Frequency (a) and cell counts of total ILC3s (b) or ILC3 subsets (c) in the large intestine lamina propria of Casp8f/f and RORγtcre Casp8f/f mice infected with C. rodentium (n = 5 mice). d, Cleaved-caspase 3 levels in ILC3s from the large intestine lamina propria of Casp8f/f and RORγtcre Casp8f/f mice infected with C. rodentium (n = 7 mice). e-g Faecal bacterial load (e) at indicated days post infection, and colon lengths (f) and representative H&E-stained colon histology with histopathology scores (g) at day 7 post infection in Casp8f/f and RORγtcre Casp8f/f mice infected with C. rodentium (n = 3, 4 or 7 mice). Data in a-c are representative of two independent experiments with similar results. Data in d-g were pooled from two independent experiments with similar results. Statistics in a-g were calculated by unpaired, two-tailed student’s t-tests.
Figure 5 ∣
Figure 5 ∣. TL1A and TNF activate caspase 8 and upregulate Fas to restrain intestinal ILC3s.
a,b, Analysis of active caspase 8 levels (a) and cell viability (b) in total ILC3s cultured for 16 hours with indicated cytokines and cIAP inhibitor. c,d, Representative histogram plots (c) and bar graph (d) of Fas expression on ILC3s cultured for 16 hours with indicated cytokines. e,f, Fas expression (e) and cell viability (f) of ILC3 subsets cultured for 16 hours with indicated cytokines. g, qPCR analysis of Fasl expression in ILC3 subsets at steady state. h,i, qPCR analysis of Fas (h) and Fasl (i) gene expression in total ILC3s isolated from the large intestine lamina propria of control or C. rodentium infected mice. j,k, Representative flow cytometry plot (j) and corresponding frequencies (k) of Fas−/− to wild-type CD45.1 ILC3s in the large intestine of mixed bone marrow chimeras. The expression was normalized to Hprt in all experiments. Data in a-k is representative of two independent experiments with similar results. Statistics in a,b,d,e,f,g,h,i,k were calculated by unpaired, two-tailed student’s t-tests.
Figure 6 ∣
Figure 6 ∣. RIPK3 and Caspase-8 interpret cytokine signals to regulate ILC3 survival in the gut.
This research identifies that upon sensing of intestinal microbes, there is upregulation of key cytokines that engage cell survival pathways in ILC3s. These include IL-23 that upregulates expression of RIPK3, as well as TL1A and TNF that activate caspase 8 in ILC3s. Activation of caspase 8 limits necroptosis induced by RIPK3 and is required for ILC3 survival in the gut. TL1A and TNF also upregulate FAS that restrains the overall abundance of ILC3s. Collectively, interpretation of these cytokine signals controls ILC3 survival in the context of microbial challenge, and suggests that an imbalance of these pathways, such as in IBD or across ILC3 subsets, provokes depletion of tissue-protective ILC3s from the inflamed intestine.

References

    1. Fawkner-Corbett D, Antanaviciute A, Parikh K, Jagielowicz M, Geros AS, Gupta T et al. Spatiotemporal analysis of human intestinal development at single-cell resolution. Cell 2021; 184(3): 810–826 e823. - PMC - PubMed
    1. Elmentaite R, Kumasaka N, Roberts K, Fleming A, Dann E, King HW et al. Cells of the human intestinal tract mapped across space and time. Nature 2021; 597(7875): 250–255. - PMC - PubMed
    1. Horn V, Sonnenberg GF. Group 3 innate lymphoid cells in intestinal health and disease. Nat Rev Gastroenterol Hepatol 2024; 21(6): 428–443. - PMC - PubMed
    1. Artis D, Spits H. The biology of innate lymphoid cells. Nature 2015; 517(7534): 293–301. - PubMed
    1. Zhou W, Sonnenberg GF. Activation and Suppression of Group 3 Innate Lymphoid Cells in the Gut. Trends Immunol 2020; 41(8): 721–733. - PMC - PubMed

MeSH terms