. 2024 Dec;17(6):1242-1255.
doi: 10.1016/j.mucimm.2024.08.006. Epub 2024 Aug 11.

Distinct cell death pathways induced by granzymes collectively protect against intestinal Salmonella infection

Affiliations

Distinct cell death pathways induced by granzymes collectively protect against intestinal Salmonella infection

Amanpreet Singh Chawla et al. Mucosal Immunol. 2024 Dec.

Erratum in

Abstract

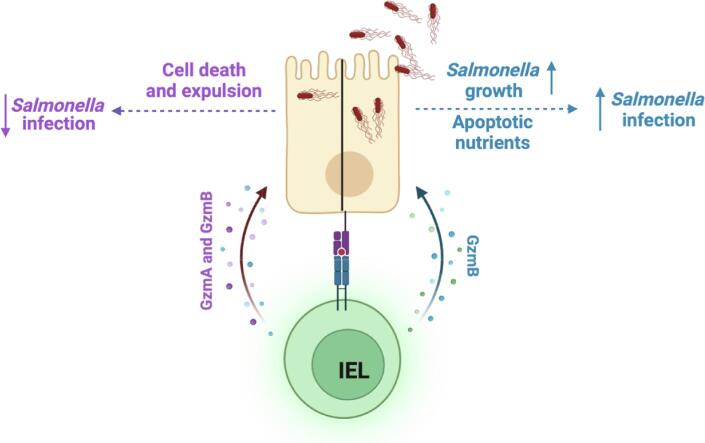
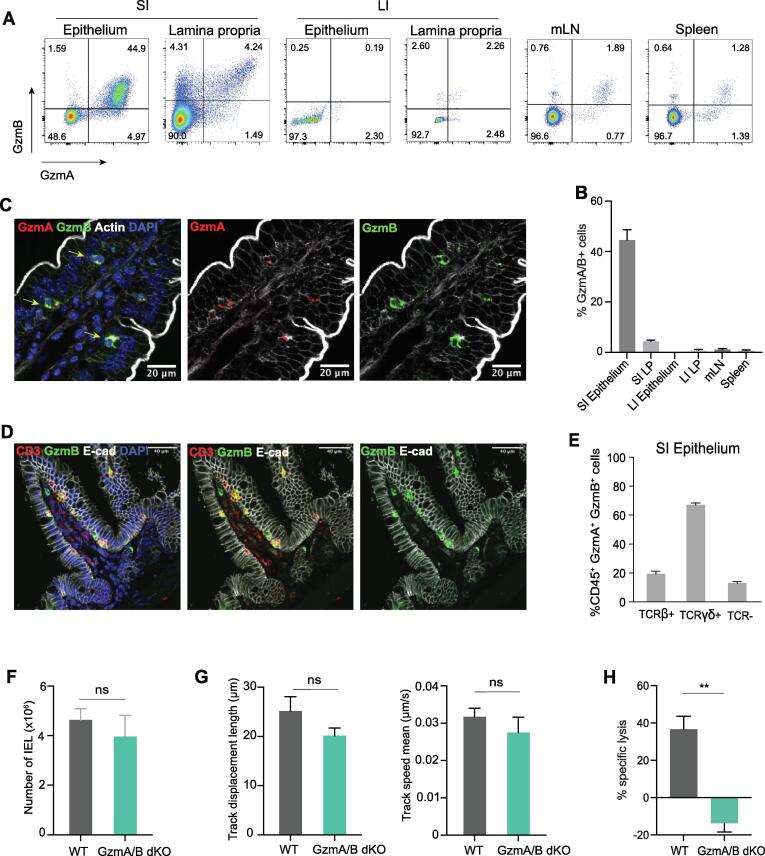
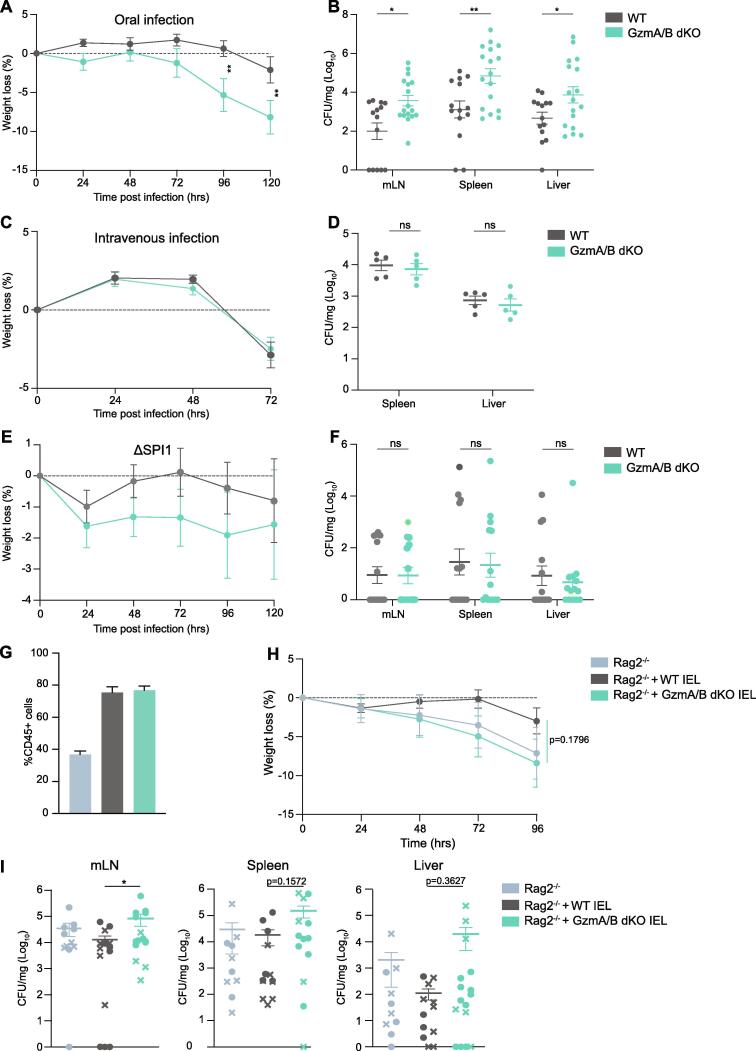
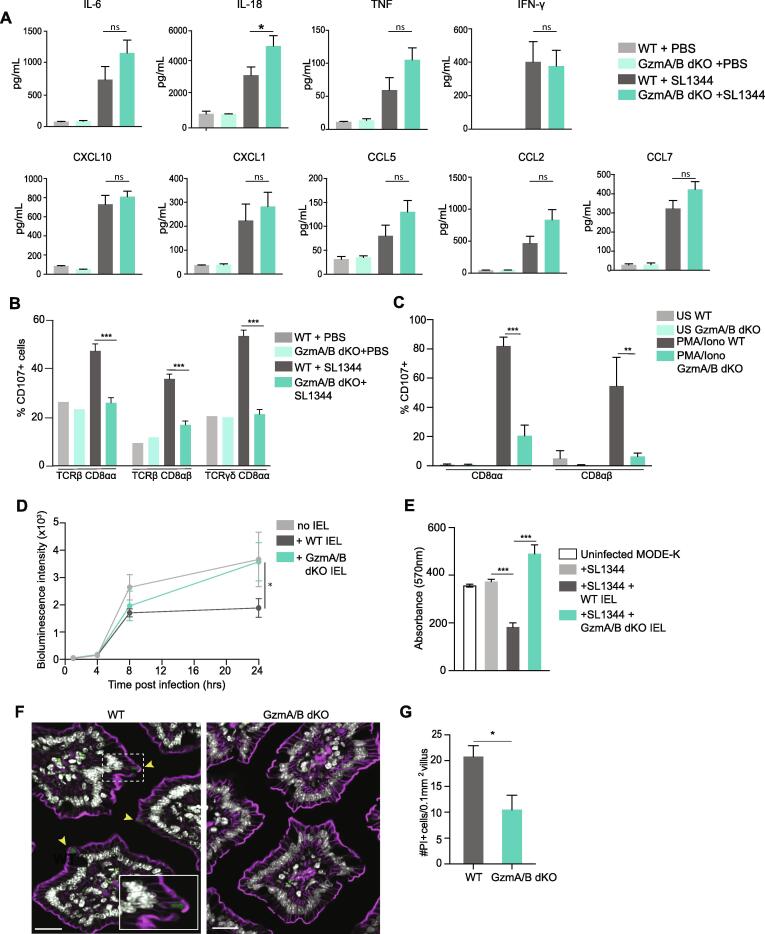
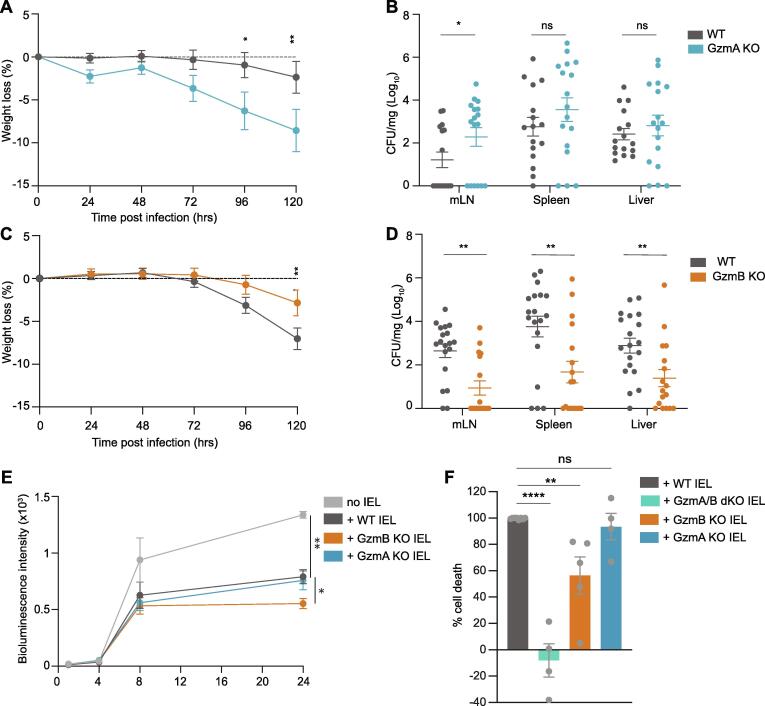
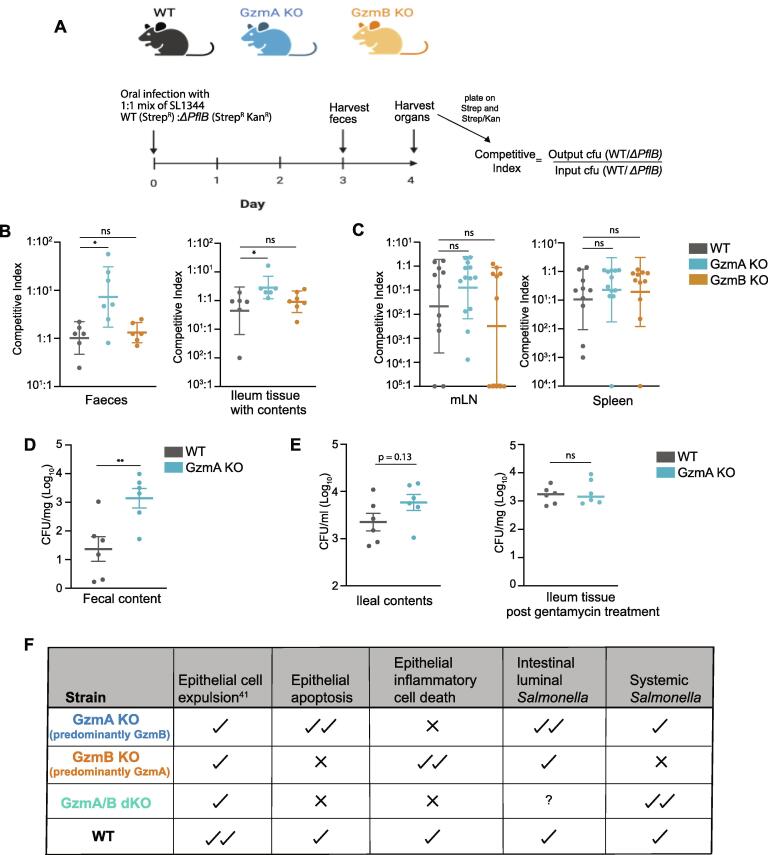
Intestinal intraepithelial T lymphocytes (IEL) constitutively express high amounts of the cytotoxic proteases Granzymes (Gzm) A and B and are therefore thought to protect the intestinal epithelium against infection by killing infected epithelial cells. However, the role of IEL granzymes in a protective immune response has yet to be demonstrated. We show that GzmA and GzmB are required to protect mice against oral, but not intravenous, infection with Salmonella enterica serovar Typhimurium, consistent with an intestine-specific role. IEL-intrinsic granzymes mediate the protective effects by controlling intracellular bacterial growth and aiding in cell-intrinsic pyroptotic cell death of epithelial cells. Surprisingly, we found that both granzymes play non-redundant roles. GzmB-/- mice carried significantly lower burdens of Salmonella, as predominant GzmA-mediated cell death effectively reduced bacterial translocation across the intestinal barrier. Conversely, in GzmA-/- mice, GzmB-driven apoptosis favored luminal Salmonella growth by providing nutrients, while still reducing translocation across the epithelial barrier. Together, the concerted actions of both GzmA and GzmB balance cell death mechanisms at the intestinal epithelium to provide optimal control that Salmonella cannot subvert.

Keywords: Cell death; Granzymes; Infection; Intraepithelial lymphocytes; Salmonella.


Figures

None
Graphical abstract
Fig. 1
Fig. 1
IEL are the main source of Gzms in the mouse at steady state. A. Representative flow cytometry dot plots of GzmA and GzmB expression in the small intestinal (SI) epithelium and lamina propria, large intestinal (LI) epithelium and lamina propria, mesenteric lymph nodes (mLN) and spleen of naïve WT mice (left). B. Bar graphs showing the quantification of GzmA+/GzmB+ cells in different organs shown in (A), n > 3 mice per organ. C. Immunofluorescent micrographs showing cells expressing GzmA (red) and GzmB (green) in the epithelial layer of a jejunal villus. Sections were counterstained with phalloidin to show actin (white) and DAPI (blue) to show nuclei. Scale bar = 20 µm. D. Immunofluorescent micrographs showing cells expressing CD3 (red), GzmB (green) and E-cad (white) in the jejunal villus. Scale bar = 40 µm. E. Bar graphs showing which CD45+ cell subsets express GzmA and GzmB in the epithelium (n = 5). F-H. Bar graphs showing F. CD45+ C103+ total IEL in co-housed WT and GzmA/B dKO (n = 5), G. Track displacement (left) and mean track speed (right) of WT and GzmA/B dKO IEL from mice which have been cohoused) in coculture with WT intestinal organoids (n = 3/group). H. Specific cell lysis of K562 cells by either WT or GzmA/B dKO IEL from mice that have been cohoused. IEL were cultured with K562 at a 40:1 ratio, in the presence of 20 ng/ml IL-15 and 1 μg/ml anti-CD3 (n = 3 per genotype). All data are presented as mean ± SEM. For (F-H), unpaired t-test was used to calculate the significance. ns: not significant, ** p < 0.01. (For interpretation of the references to colour in this figure legend, the reader is referred to the web version of this article.)
Fig. 2
Fig. 2
Granzymes are important for protection against oral intestinal infection. A-B. Cohoused WT (n = 14) and GzmA/B dKO (n = 17) mice were orally infected with SL1344-GFP and culled 5 days post infection (dpi). Weight loss (A) and CFU/mg in mLN, spleen and liver at the time of sacrifice (B) are shown. Data were pooled from 3 independent experiments. C-D. Cohoused WT and GzmA/B dKO mice were infected i.v. with SL1344-GFP and culled 3 dpi. Weight loss (C) and CFU/mg in spleen, liver at the time of sacrifice (D) are shown (n = 5/group). E-F. Cohoused WT and GzmA/B dKO mice were orally infected with ΔSPI1-SL1344 and culled 5dpi. Weight loss (E) and CFU/mg in mLN, spleen and liver are shown (F). Data were pooled from 2 independent experiments (n = 14/group). G-I. Rag2-/- mice were adoptively transferred with either WT (n = 12) or GzmA/B dKO IEL (n = 15) from cohoused mice, or no IEL (n = 10). 4 weeks after IEL transfer mice were orally infected with SL1344-GFP. (G) Percentages of CD45 + cells out of total live cells isolated from the intestinal epithelia of Rag2-/- mice, Rag2-/- mice reconstituted with WT IEL, and Rag2-/- mice reconstituted with GzmA/B dKO IEL after infection. Data were pooled from two independent experiments, where infected mice were either culled 4 or 5 dpi, depending on the severity of symptoms. Weight loss (H) and CFU/mg (I) in mLN (left), spleen (middle) and liver (right) are shown. In (I), cfu data from the two independent experiments culled 4dpi (circles) or 5dpi (crosses) are indicated. All data are presented as mean ± SEM. For bacterial counts, ranks were compared using the Mann-Whitney U test. ns: not significant, * p < 0.05, ** p < 0.01, *** p < 0.001.
Fig. 3
Fig. 3
IEL use granzymes to kill infected epithelial cells. A. Chemokine and cytokine levels in plasma of naïve and orally infected cohoused GzmA/B dKO (n = 9) compared to WT (n = 9) from Fig. 2, at 5 dpi. Data were pooled from 2 independent experiments. B. Bar graphs showing percentage of CD107+ cells in co-housed WT and GzmA/B dKO IEL 5 dpi of Salmonella infection (n = 5). C. Percentage of CD107+ cells in cultured WT and GzmA/B dKO IEL isolated from co-housed mice (n = 3 each), 3 h after in vitro PMA/ionomycin treatment. D. MODE-K cells were infected with SL1344-lux for 1 h, treated with gentamycin, and then incubated with WT or GzmA/B dKO IEL from co-housed mice (n = 3) (See Suppl. Fig. 3C for schematic). Bioluminescence intensity was measured when IEL were added, then after 4 h, 8 h and 24 h. E. Infected MODE-K cells were incubated with WT or GzmA/B dKO IEL, as in (D) and infected MODE-K cells were stained with crystal violet 24 h after incubation with IEL from WT and GzmA/B dKO pooled from 3 independent experiments. Absorbance of crystal violet (at 570 nm) is shown as representative of live cells. F. Representative images of PI+ enterocytes in jejunal villi of co-housed WT or GzmA/B dKO mice 1 h after FlaTox treatment (0.16ug/g PA, 0.08 µg/g LFn-Fla). Nuclei are shown in white PI in green and F-actin in magenta. Yellow arrowheads indicate PI+ enterocytes. Scale bar = 20 µm, inset: scale bar = 10 µm. G. Morphometric analysis of PI+ enterocytes (n = 5). All data are represented as mean ± SEM. P values were calculated by (A-E) ordinary one-way ANOVA with Sidak’s multiple comparisons, (G) unpaired t-test. ns: not significant, * p < 0.05, ** p < 0.01, *** p < 0.001. (For interpretation of the references to colour in this figure legend, the reader is referred to the web version of this article.)
Fig. 4
Fig. 4
Divergent roles of GzmA and GzmB in intestinal infection. A-B. GzmA KO mice (n = 18) and their WT littermate controls (n = 19) were orally infected with SL1344-GFP and culled 5dpi. Weight loss (A) and CFU/mg in mLN, spleen and liver (B) are shown. Data were pooled from 2 independent experiments. C-D. GzmB KO mice (n = 17) and their littermate WT controls (n = 19) were orally infected with SL1344-GFP and culled 5dpi. Weight loss (C) and CFU/mg in mLN, spleen and liver (D) are displayed. Data were pooled from 2 independent experiments. E. MODE-K cells were infected with SL1334-lux for 1 h and then incubated with GzmA or GzmB KO or their WT littermate control IEL (n = 3). Bioluminescence intensity was measured when IEL were added, then after 4 h, 8 h and 24 h. F. Infected MODE-K cells were stained with Crystal violet 24 h after incubation with IEL from WT (n = 8), GzmA/B dKO (n = 4), GzmB KO (n = 5), GzmA KO (n = 4) mice, pooled from 5 independent experiments. The percentage cell death relative to infected MODE-K cells without IEL was normalized to the cell death induced by WT IEL. All data are presented as mean ± SEM.  P values were calculated for bacterial counts (B, D) using Mann-Whitney U test to compare ranks, and for all other comparisons, two-way ANOVA was used, with Sidak’s multiple comparisons tests. ns: not significant, * p < 0.05, ** p < 0.01, *** p < 0.001, **** p < 0.0001. (For interpretation of the references to colour in this figure legend, the reader is referred to the web version of this article.)
Fig. 5
Fig. 5
Differential cell death pathways induced by GzmA and GzmB drive divergent outcomes in infection. A. Schematic showing the set-up of competitive index experiment. WT, GzmA KO and GzmB KO generated from the same line as described in the methods, were orally infected with 1:1 mixture of wildtype:ΔPflB SL1344. Feces were collected at day 3 and other organs were collected at day 4 post infection. B-C. Scatter plots showing the competitive index in (B) feces (n = 6/strain) and ileum (n = 6/strain), and in (C) mLN and spleen (pooled from two experiments with n > 10/strain). D-E. WT (n = 6) and GzmA KO (n = 6) mice were orally infected with SL1344-GFP and culled at various days post infection (dpi) with (D) showing the fecal bacterial counts at day 3 post infection and (E) showing the bacterial counts at day 4 post infection in ileal contents as a read out for extracellular luminal bacteria (left panel) and in ileal tissue washed with gentamycin (right panel) for 30 mins to kill off any extracellular bacteria. All data are presented as mean ± SEM. For bacterial counts, ranks were compared using the Mann-Whitney U test. ns: not significant, * p < 0.05, ** p < 0.01. F. Summary describing the roles of IEL intrinsic granzymes driving the phenotypes of the KO mice in intestinal Salmonella infection.

References

    1. Davies A., et al. Infection-induced expansion of a MHC class Ib-dependent intestinal intraepithelial γδ T Cell subset. J Immunol. 2004;172:6828–6837. - PubMed
    1. Godinez I., et al. T cells help to amplify inflammatory responses induced by salmonella enterica serotype typhimurium in the intestinal mucosa. Infect Immun. 2008;76:2008–2017. - PMC - PubMed
    1. Klose C.S.N., et al. A T-bet gradient controls the fate and function of CCR6−RORγt+ innate lymphoid cells. Nature. 2013;494:261–265. - PubMed
    1. Kurioka A., et al. MAIT cells are licensed through granzyme exchange to kill bacterially sensitized targets. Mucosal Immunol. 2015;8:429–440. - PMC - PubMed
    1. Li Z., et al. Small intestinal intraepithelial lymphocytes expressing CD8 and T cell receptor γδ are involved in bacterial clearance during salmonella enterica serovar typhimurium infection. Infect Immun. 2012;80:565–574. - PMC - PubMed