

Randomised controlled trial of intermittent calorie restriction in people with multiple sclerosis
- PMID: 39137977
- PMCID: PMC11877063
- DOI: 10.1136/jnnp-2024-333465
Randomised controlled trial of intermittent calorie restriction in people with multiple sclerosis
Abstract
Background: Calorie restriction (CR) ameliorates preclinical models of multiple sclerosis (MS) via multiple mechanisms. These include decreased leptin, a proinflammatory adipokine, but mechanistic studies in humans are lacking. Tests of daily and intermittent CR (iCR) in people with MS (pwMS) showed improvements in fatigue and well-being measures. This trial studied the effects of 12-week iCR on metabolic, immunological, and clinical outcomes in pwMS.
Method: Relapsing-remitting MS participants were randomised to iCR or a control group. Study visits were conducted at baseline, 6 and 12 weeks. The primary outcome was reduction in serum leptin levels at 12 weeks. Feasibility and safety were assessed by diet adherence and adverse events (AEs). Secondary outcomes included changes in anthropometric and body composition measures, metabolic and immunologic profiling, and clinical measures. Mixed effects linear regression models were used to evaluate outcome differences between and within groups over time.
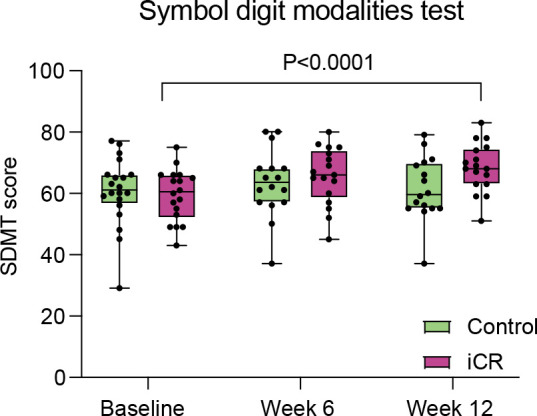
Results: Forty-two pwMS were randomised, 34 completed the study (17/group). Leptin serum levels at 12 weeks were significantly lower in the iCR versus the control group (mean decrease -6.98 µg/dL, 95% CI: -28.02 to 14.06; p=0.03). Adherence to iCR was 99.5% and 97.2% at 6 and 12 weeks, respectively, and no serious AEs were reported. An increase in blood CD45RO+ regulatory T-cell numbers was seen after 6 weeks of iCR. Exploratory cognitive testing demonstrated a significant improvement in the Symbol Digit Modality Test Score in the iCR group at 12 weeks.
Conclusions: iCR has the potential to benefit metabolic and immunologic profiles and is safe and feasible in pwMS.
Trial registration number: NCT03539094 .
Keywords: MULTIPLE SCLEROSIS; NEUROIMMUNOLOGY.
© Author(s) (or their employer(s)) 2025. Re-use permitted under CC BY-NC. No commercial re-use. See rights and permissions. Published by BMJ Group.
Conflict of interest statement
Competing interests: LP has received research funding from the National MS Society, the NIH, the Department of Defense and Fondazione Italiana Sclerosi Multipla; she has been funded by Alector and Biogen for a project not related to the one included in this manuscript. She is one of the Editor-in-Chief of Journal of Neuroimmunology. AHC received compensation for consulting for Biogen, EMD Serono, Bristol Myers Squibb, TG Therapeutics, Octave, Genentech, Roche, Novartis, Horizon and Janssen (J&J). AHC was supported by the Manny & Rosalyn Rosenthal-Dr. John L. Trotter MS Center Chair in Neuroimmunology during this study. CAR received compensation for consulting for CoreTechs.ai, Eli Lilly, Voxelwise, Neurevolution. GFW received compensation for consulting for EMD Serono, Genzyme, Novartis, Sangamo, Roche, Alumis and the US Department of Justice. He has received research grant funding from the NIH, National MS Society, Doris Duke Foundation, US Department of Veterans Affairs, Biogen, EMD Serono and Genentech. He serves on the editorial boards of Neurology: Neuroimmunology & Neuroinflammation and the Journal of Neuroimmunology. He serves on advisory boards for Progentec and Genentech. RTN has consulted for Alexion Pharmaceuticals, Biogen, Bristol Myers Squibb, Celltrion, Genentech, Genzyme, EMD Serono, Horizon Therapeutics, Novartis, TG Therapeutics. AS receives research funding from Multiple Sclerosis Society of Canada, National Multiple Sclerosis Society, CMSC and the Department of Defense Congressionally Directed Medical Research Program and is a member of the editorial board for Neurology. She serves as a consultant for Gryphon Bio and Abata Therapeutics. She is a member of the Data and Safety Monitoring Board for Premature Infants Receiving Milking or Delayed Cord Clamping (PREMOD2), Central Vein Sign: A Diagnostic Biomarker in Multiple Sclerosis (CAVS-MS), Ocrelizumab for Preventing Clinical Multiple Sclerosis in Individuals With Radiologically Isolated Disease (CELLO) and Methotrexate treatment of Arthritis caused by Chikungunya virus (MARCH). She holds the Kenney Marie Dixon-Pickens Distinguished Professorship in Multiple Sclerosis Research.
Figures


References
Publication types
MeSH terms
Substances
Associated data
Grants and funding
LinkOut - more resources
Full Text Sources
Medical