. 2024 Aug 13;22(8):e3002685.
doi: 10.1371/journal.pbio.3002685. eCollection 2024 Aug.

GRK2 kinases in the primary cilium initiate SMOOTHENED-PKA signaling in the Hedgehog cascade

Affiliations

GRK2 kinases in the primary cilium initiate SMOOTHENED-PKA signaling in the Hedgehog cascade

Madison F Walker et al. PLoS Biol. .

Abstract

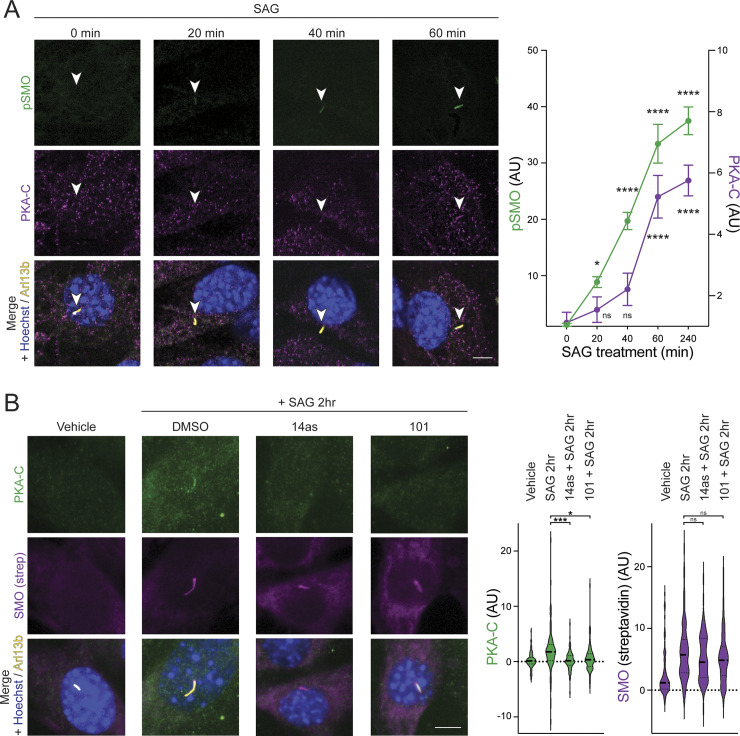
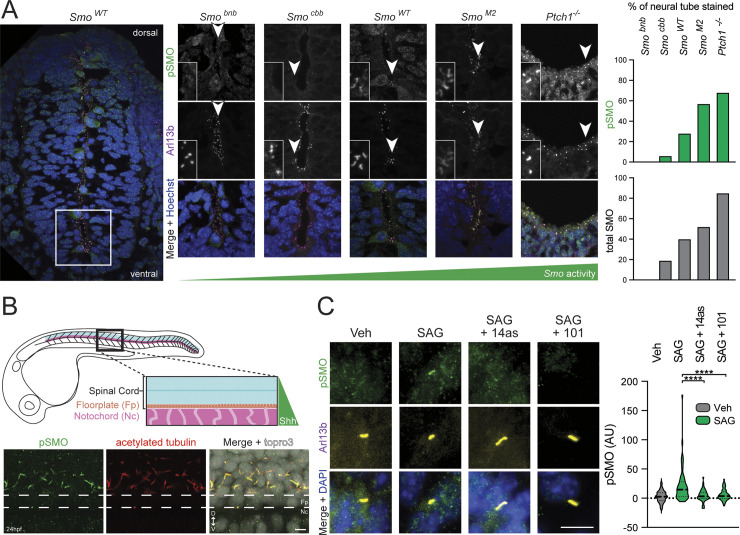
During Hedgehog (Hh) signal transduction in development and disease, the atypical G protein-coupled receptor (GPCR) SMOOTHENED (SMO) communicates with GLI transcription factors by binding the protein kinase A catalytic subunit (PKA-C) and physically blocking its enzymatic activity. Here, we show that GPCR kinase 2 (GRK2) orchestrates this process during endogenous mouse and zebrafish Hh pathway activation in the primary cilium. Upon SMO activation, GRK2 rapidly relocalizes from the ciliary base to the shaft, triggering SMO phosphorylation and PKA-C interaction. Reconstitution studies reveal that GRK2 phosphorylation enables active SMO to bind PKA-C directly. Lastly, the SMO-GRK2-PKA pathway underlies Hh signal transduction in a range of cellular and in vivo models. Thus, GRK2 phosphorylation of ciliary SMO and the ensuing PKA-C binding and inactivation are critical initiating events for the intracellular steps in Hh signaling. More broadly, our study suggests an expanded role for GRKs in enabling direct GPCR interactions with diverse intracellular effectors.


Conflict of interest statement

I have read the journal’s policy and the authors of this manuscript have the following competing interests: S.S. is the founder and scientific advisor of 7TM Antibodies GmbH, Jena, Germany. F.N. is an employee of 7TM Antibodies. All other authors declare no competing interests.

Figures

Fig 1
Fig 1. GRK2 relocalizes from the base to the shaft of the cilium upon SMO activation.
(A) Schematic illustration of a cell with the cilium attached to the coverslip surface for TIRF imaging (left). A close-up view of the cilium (right) where the microtubule was labeled with SiR-Tub and GRK2-eGFP was stably expressed. (B) Flowchart outlining the sample preparation procedures for imaging. (C) Representative montage from live-cell imaging of a cilium. Merged (red = SiR-Tubulin and white = GRK2-eGFP) and GRK2-eGFP channels are shown. SMO was activated at t = 00:00 (hh:mm) by adding SAG21k. The montages show that eGFP signal was observed in the base of the cilium. After SAG21k addition, eGFP signal is observed in the shaft, and the signal persists for the duration of imaging. The purple box on the GRK2 channel indicates the earliest timepoint following SAG21k addition at which GRK2-eGFP is observed in the ciliary shaft. Scale bar = 1 μm. (D) Profiles of GRK2-eGFP intensity per unit area before and after SAG21k activation, for the cilium in (C). (E) Scatterplot of the GRK2 latency, defined as the time after SAG21k addition when a GRK2-eGFP signal was observed in the cilium; dashed line indicates median. The underlying data for this figure can be found under S1 Data. GRK2, GPCR kinase 2; TIRF, total internal reflection fluorescence.
Fig 2
Fig 2. Hh pathway activation leads to accumulation of GRK2-phosphorylated SMO in the cilium.
(A) Alignment of a region of the SMO pCT from various species, with the yellow highlighted residues indicating the conserved GRK2 phosphorylation cluster recognized by our anti-pSMO antibody (see “Methods”). (B) NIH3T3 cells were treated overnight with SAG21k (500 nM) in the presence or absence of the GRK2 inhibitor Cmpd101 (101, 30 μm) or the casein kinase 1 inhibitor D4476 (10 μm), or with a vehicle control. Cells were then fixed and stained with anti-pSMO (green), anti-SMO (magenta), anti-Arl13b (to mark cilia, yellow), and DAPI (to mark nuclei, blue). Representative cilia (arrowhead) are highlighted below each image. (C) NIH3T3 dync2 cells were treated with SAG21k or a vehicle control, then stained and quantified as in (B). Insets show close-up views of a representative cilium from each field. (D) NIH3T3 cells stably expressing FLAG-tagged SMO (right) or parental NIH3T3 controls (left) were treated for 4 h with vehicle, SAG21k, or SAG21k plus Cmpd101, as described in (B), then lysed and subjected to FLAG immunoaffinity chromatography. FLAG eluates were blotted with anti-pSMO and anti-FLAG to detect phosphorylated SMO and total SMO, respectively. The total protein from the input fractions (prior to FLAG chromatography) serve as loading controls. See S5H Fig for quantification. (E) Isogenic FLAG-SMO-expressing NIH3T3 Flp-in wild-type (left panel) or Kif3a-/- (right panel) cells [72] were treated with SAG21k (vs. a vehicle control, lanes 1–2 in each panel), or ShhN conditioned medium (vs. control conditioned medium, lanes 3–4 in each panel), and SMO phosphorylation was monitored via anti-pSMO immunoblotting as in (D). Significance in (B) and (C) was determined via a Mann–Whitney test. *, p < 0.05; ****, p < 0.0001; ns, not significant; n = 22–30 or 32–37 individual cilia per condition in (B) and (C), respectively. Scale bar = 10 μm in all images. The underlying data for this figure can be found under S2 Data. The uncropped protein gels and westerns are included in S1 Raw Images. GRK2, GPCR kinase 2; Hh, hedgehog; pCT, proximal cytoplasmic tail.
Fig 3
Fig 3. GRK2 phosphorylation of ciliary SMO is an early event in intracellular Hh signal transmission.
(A) Left: Wild-type NIH3T3 cells were treated with 100 nM SAG for times ranging from 5 min to 1 h, then fixed and stained for pSMO (green) and Arl13b (yellow). Right: quantification of the mean pSMO intensity in cilia at each indicated time point. (B) The same experiment was performed, except NIH3T3 cells were first pretreated with 5 μm cyclopamine overnight, followed by SAG treatment as described in (A). Representative cilia (arrowhead) are highlighted below each image. n = 50–100 cells per condition. Significance was determined via one-way ANOVA followed by Dunnett’s multiple comparison test. **, p < 0.01; ****, p < 0.0001; ns, not significant. Data are represented as means ± SEM. Scale bar = 5 μm in all images. The underlying data for this figure can be found under S3 Data. GRK2, GPCR kinase 2; Hh, hedgehog.
Fig 4
Fig 4. Continuous GRK2 activity sets the SMO phosphorylation state.
(A) NIH3T3 cells were treated overnight with SAG21k (500 nM) (left-most panel), and then Cmpd101 (101, 30 μm) was added for the indicated times. Cells were then fixed and stained for pSMO (green), SMO (magenta), Arl13b (yellow), and DAPI (blue), as described in Fig 2B. Representative cilia (arrowhead) are highlighted below each image. Quantification of pSMO and total SMO at the indicated time points are shown below. (B) NIH3T3 cells stably expressing FLAG-tagged SMO were treated as in (A), then SMO was purified using FLAG affinity chromatography and the eluates blotted with anti-pSMO and anti-FLAG antibodies. Graph below indicates quantification of band intensities. (C) A construct consisting of GRK2CT fused to a ciliary targeting signal and mNeonGreen (mNG) fluorescent protein [52], or a control construct lacking GRK2CT, was stably expressed in NIH3T3 Flp-in cells. Following SAG21k treatment, SMO phosphorylation (green), Arl13b (yellow), DAPI (blue), and the cilium-targeted fusion (mNG, magenta) in the indicated stable cell lines (middle and right panels), or parental NIH3T3 Flp-in control cells (left panels), were monitored via immunofluorescence. Significance in (A) and (C) was determined via a Mann–Whitney test, and in (B) via one-way ANOVA. *, p < 0.05; **, p < 0.01; ****, p < 0.0001; ns, not significant; n = 24–47 individual cilia per condition in (A); mean +/- standard deviation is shown in (B). Scale bar = 10 μm. The underlying data for this figure can be found under S4 Data. The uncropped protein gels and westerns are included in S1 Raw Images. GRK2, GPCR kinase 2.
Fig 5
Fig 5. GRK2 phosphorylation controls SMO/PKA-C colocalization in cilia.
(A) NIH3T3 cells stably expressing SMO-V5-TurboID were pretreated with cyclopamine for 16 h, followed by SAG for the indicated times, and accumulation of PKA-C (magenta) and phosphorylated SMO (pSMO, green) in cilia (Arl13b, yellow) were monitored via immunofluorescence microscopy. Hoechst (blue) marks nuclei. Left: raw data; right: quantification of pSMO (left axis) and PKA-C (right axis). Cilium is marked by an arrowhead. (B) NIH3T3 cells stably expressing SMO-V5-TurboID were treated with vehicle, Cmpd101 or 14as for 16 h. SAG was then added to the culture medium in the presence of the indicated inhibitors and incubated for 2 h. Cells were labeled with biotin for 10 min before fixation, and stained for PKA-C (green), streptavidin (magenta), Arl13b (yellow), and Hoechst (blue). Streptavidin staining marks the localization of SMO-V5-TurboID in the cilium. Left: raw data; right: quantification. Significance was determined via one-way ANOVA followed by Dunnett’s multiple comparison test. **, p < 0.01; ****, p < 0.0001; ns, not significant; n = 50–100 cells per condition. Data are represented as means ± SEM. Scale bar = 5 μm in all images. The underlying data for this figure can be found under S5 Data. GRK2, GPCR kinase 2; PKA-C, protein kinase A catalytic.
Fig 6
Fig 6. GRK2 phosphorylation of SMO is sufficient to induce SMO/PKA-C interaction.
(A) Schematic diagram for 2 models of how GRK2 phosphorylation of SMO may promote interactions with PKA-C, either by directly triggering formation of a SMO/PKA-C complex (Direct Model) or acting via an intermediary protein, symbolized as “X” (Indirect Model). (B) Purified FLAG-tagged SMO was subject to phosphorylation by GRK2 in vitro in the presence of SMO agonist (SAG21k) or inverse agonist (KAADcyc) for the indicated minutes (min), and conversion of SMO to a phosphorylated form (pSMO) was analyzed by monitoring its mobility shift on SDS-PAGE via anti-FLAG immunoblotting. (C) Purified FLAG-tagged SMO in either a nonphosphorylated or phosphorylated state (SMO or pSMO, respectively, at 18.2 μm) was mixed with PKA-C in vitro (10 μm), and complex formation was detected via pulldown on anti-FLAG beads, followed by analysis of total protein in input and FLAG elution fractions on SDS-PAGE via stain-free imaging. SMO lacking the cytoplasmic tail (FLAG-SMOΔCT) serves as a negative control for PKA-C binding. Positions of SMO, pSMO, SMOΔCT, and PKA-C are indicated at right. (D) SMO/PKA-C pulldowns were performed as in (C), except that the following competitor peptides (red) were added during the initial SMO/PKA-C binding step: either a PKA pseudosubstrate peptide from PKIα (PKIα(5–24)), or a control, non-PKA-binding peptide (Ctrl peptide), each at a final concentration of 100 μm. The uncropped protein gels are included in S1 Raw Images. GRK2, GPCR kinase 2; PKA-C, protein kinase A catalytic.
Fig 7
Fig 7. GRK2 phosphorylation of ciliary SMO is a general, evolutionarily conserved aspect of Hh signal transduction in vivo.
(A) Mouse neural tubes from wild-type, Smo, or Ptch1 mutant E9.5 embryos (low-magnification view of wild-type mouse at left, higher-magnification view of wild-type, Ptch1-/-, or Smo alleles of differing strengths at right) were stained for pSMO (green), cilia (Arl13b, magenta), and nuclei (Hoechst, blue). Images are oriented with dorsal pointing up and ventral pointing down. Insets show close-up views of representative cilia from each field. The percent of each neural tube that was stained by anti-pSMO (green) or anti-SMO (gray) antibodies is quantified at right. Raw data from anti-SMO staining is presented in S9B Fig. (B) Top: Schematic of 24 hpf zebrafish embryos showing location of the spinal cord relative to Shh-secreting floorplate and notochord. Bottom: Lateral views of whole-mount zebrafish embryos at 24 h postfertilization (hpf) were stained with anti-pSMO (green) or anti-acetylated tubulin (red) antibodies, with topro3 counterstain to mark nuclei (white). Magnified view of the ventral spinal cord is shown, with the floorplate indicated by dashed white lines. The dorsal spinal cord is facing up and the ventral spinal cord is facing down. (C) CGNPs freshly isolated from neonatal mice were cultured ex vivo and treated with vehicle or SAG, in the presence or absence of Cmpd101 or 14as, followed by staining with anti-pSMO (green) and Arl13b (yellow). Ciliary anti-pSMO intensity is quantified and significance determined via one-way ANOVA. ****, p < 0.0001. Scale bar = 5 μm in (B); 10 μm in (C). The underlying data for this figure can be found under S7 Data. CGNP, cerebellar granule neural precursor; GRK2, GPCR kinase 2; Hh, hedgehog.
Fig 8
Fig 8. Model for SMO-GRK2-PKA communication during Hh signal transduction in the cilium.
See main text for details. GRK2, GPCR kinase 2; Hh, hedgehog.

Update of

References

    1. Briscoe J, Thérond PP. The mechanisms of Hedgehog signalling and its roles in development and disease. Nat Rev Mol Cell Biol. 2013;14:416–429. doi: 10.1038/nrm3598 - DOI - PubMed
    1. Ingham PW. Hedgehog signaling. Curr. Top. Dev Biol. 2022;149:1–58. doi: 10.1016/bs.ctdb.2022.04.003 - DOI - PubMed
    1. Kong JH, Siebold C, Rohatgi R. Biochemical mechanisms of vertebrate hedgehog signaling. Development. 2019;146. doi: 10.1242/dev.166892 - DOI - PMC - PubMed
    1. Zhang Y, Beachy PA. Cellular and molecular mechanisms of Hedgehog signalling. Nat Rev Mol Cell Biol. 2023;24:668–687. doi: 10.1038/s41580-023-00591-1 - DOI - PubMed
    1. Pak E, Segal RA. Hedgehog Signal Transduction: Key Players, Oncogenic Drivers, and Cancer Therapy. Dev Cell. 2016;38:333–344. doi: 10.1016/j.devcel.2016.07.026 - DOI - PMC - PubMed