. 2024 Sep 3;63(17):2183-2195.
doi: 10.1021/acs.biochem.4c00331. Epub 2024 Aug 13.

Insights into the Interaction Landscape of the EVH1 Domain of Mena

Affiliations

Insights into the Interaction Landscape of the EVH1 Domain of Mena

Lanette LaComb et al. Biochemistry. .

Abstract

The Enabled/VASP homology 1 (EVH1) domain is a small module that interacts with proline-rich stretches in its ligands and is found in various signaling and scaffolding proteins. Mena, the mammalian homologue of Ena, is involved in diverse actin-associated events, such as membrane dynamics, bacterial motility, and tumor intravasation and extravasation. Two-dimensional (2D) 1H-15N HSQC NMR was used to study Mena EVH1 binding properties, defining the amino acids involved in ligand recognition for the physiological ligands ActA and PCARE, and a synthetic polyproline-inspired small molecule (hereafter inhibitor 6c). Chemical shift perturbations indicated that proline-rich segments bind in the conserved EVH1 hydrophobic cleft. The PCARE-derived peptide elicited more perturbations compared to the ActA-derived peptide, consistent with a previous report of a structural alteration in the solvent-exposed β7-β8 loop. Unexpectedly, EVH1 and the proline-rich segment of PTP1B did not exhibit NMR chemical shift perturbations; however, the high-resolution crystal structure implicated the conserved EVH1 hydrophobic cleft in ligand recognition. Intrinsic steady-state fluorescence and fluorescence polarization assays indicate that residues outside the proline-rich segment enhance the ligand affinity for EVH1 (Kd = 3-8 μM). Inhibitor 6c displayed tighter binding (Kd ∼ 0.3 μM) and occupies the same EVH1 cleft as physiological ligands. These studies revealed that the EVH1 domain enhances ligand affinity through recognition of residues flanking the proline-rich segments. Additionally, a synthetic inhibitor binds more tightly to the EVH1 domain than natural ligands, occupying the same hydrophobic cleft.


Conflict of interest statement

The authors declare no competing financial interest.

Figures
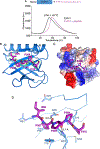
Figure 1.
Figure 1.
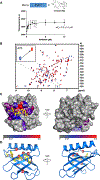
EVH1 domains and domain organization in Mena ligands. (A) Aligned amino acid sequences of EVH1 domains from Mena, VASP, Ena, SPRED1, and Homer1. Secondary structural elements (blue; helices as bars; strands as arrows) are indicated above the alignment. Alignment gaps are indicated by “−”. Conserved (full or partially) residues are shaded in blue. Mena EVH1 residues that have been shown to contact the polyproline type II helix are indicated by the pink circle. Mena EVH1 residues that have been shown to make both hydrogen bonds and hydrophobic interactions with polyproline type II are indicated by the green circle. (B) Domain organization (schematic amino acid position numbered) showing the distinct domains in Mena: EVH1 (blue), 19 amino acid insertion of invasive isoform of MenaINV (sequence denoted), LER (yellow), poly glycine/proline (green), and EVH2 (red). Domain organization in selected EVH1 interaction partners: ActA, the N-terminal domain (light blue), the central proline-rich domain (purple), and the C-terminal domain (pink). PCARE, N-terminal helical domain (light gray), and a proline-rich domain (purple); PTP1B, core phosphatase domain (gray), helix α7 (orange), proline-rich domain (purple), and C-terminal domain (pink). Potential amino acid residues for Mena EVH1 binding are highlighted.
Figure 2.
Figure 2.
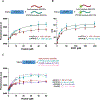
Mena EVH1 binding affinities (Kd) of ligand peptides. (A) Assay measuring intrinsic tryptophan fluorescence of Mena EVH1 used to derive affinities (Kd) for proline-rich ActA (residues 262–272; maroon filled circles) and PTP1B (residues 304–315; cyan filled squares) peptides. (B) Fluorescence polarization assays using 5-TAMRA tagged ActA (residues 262–272; maroon filled circles) and PTP1B (residues 304–315; cyan filled squares) peptides to derive affinities to Mena EVH1. (C) Assay measuring intrinsic tryptophan fluorescence of Mena EVH1 used to derive affinities (Kd) for polyproline containing ActA (residues 322–356; maroon filled circles), PCARE (residues 817–851; purple filled triangles), PCARE (residues 826–848; pink filled stars), and PTP1B (residues 293–327; cyan filled squares) peptides. Error bars (one standard deviation) obtained from three independent experiments performed in triplicate.
Figure 3.
Figure 3.
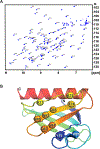
[15N] Mena EVH1 backbone assignment. (A) 2D 1H–15N HSQC spectrum with assignment (backbone) of Mena EVH1 with one letter amino acid code. (B) Ribbon diagram of the structure complex of Mena EVH1 and PTP1B (residues 304–311) (PDB entry 9C66) highlighting residue positions (Cα, sphere) that show significant chemical shift perturbations. PTP1B segment is omitted from the model for clarity.
Figure 4.
Figure 4.
Identifying residues of Mena EVH perturbed upon binding to physiological ligand ActA (residues 322–356). (A) Overlay of the 2D 1H-15N HSQC spectra of [15N]-Mena EVH1 without (blue) and with increasing concentrations (1:0.4 as green, 1:1.25 as yellow and 1:2.5 as red) of ActA (residues 322–356) (2× molar excess). Inset: expansion showing shift of K69 in Mena EVH1 observed during titration series. (B) Surface model heat map showing significant chemical shift perturbations (CSP; Δδ ≥ 0.07 ppm) upon binding to ActA (residues 322–356) (PDB entry 1EVH) (left: front) (right: back).
Figure 5.
Figure 5.
Identifying residues of Mena EVH1 that were perturbed upon binding to physiological ligand PCARE (residues 817–851). (A) Overlay of the 2D 1H–15N HSQC spectra of [15N] Mena EVH1 without (blue) and with increasing concentrations (1:0.4 as green, 1:1.6 yellow and 1:2.4 as red) of PCARE (residues 817–851) (2× molar excess). Inset: expansion showing shift of A73 in Mena EVH1 observed during titration series. (B) Surface model heat map showing significant chemical shift perturbations (CSP; Δδ ≥ 0.07 ppm) upon binding to PCARE (residues 817–851) (PDB entry 7LXF) (left: front) (right: back). (C) Difference distance matrix plot depicting the observed changes in pairwise distances between all Cα atoms with respect to Mena EVH1 bound to an extended PCARE peptide (residues 828–848, PDB entry 7LXF) and Mena EVH1 bound to a short proline-rich PTP1B peptide (residues 306–310, PDB entry 9C66). (D) Superposition of the Mena EVH1 domain bound to the extended PCARE peptide (residues 828–848, PDB entry 7LXF) or a short proline-rich PTP1B peptide (residues 306–310, PDB entry 9C66). Inset show alteration in the loop structure upon binding to an extended peptide.
Figure 6.
Figure 6.
Identifying residues of Mena EVH1 that were perturbed upon binding to nonphysiological ligand inhibitor 6c. (A) Assay measuring intrinsic tryptophan fluorescence of Mena EVH1 used to derive affinity (Kd) for inhibitor 6c. Error bars (one standard deviation) obtained from three independent experiments performed in triplicate. (B) Overlay of 2D 1H, 15N HSQC spectra of [15N]-Mena EVH1 without (blue) and with increasing concentrations (1:1.8 as yellow and 1:3.4 as red) of inhibitor 6c (2× molar excess). Inset: expansion showing shift of A73 in Mena EVH1 observed during titration series. (C) Surface model heat maps of the EVH1 domain (PDB entry 5NBX; left, interaction surface; right 180° view) showing significant chemical shift perturbations (CSP; Δδ ≥ 0.07 ppm) upon binding to inhibitor 6c. (D) Ribbon diagram of the Mena EVH1 residues that showed protection (residues in red) upon binding to the inhibitor 6c after <3.5 h of 70% D2O exchange.
Figure 7.
Figure 7.
PTP1B is an interaction partner of Mena EVH1. (A) Differential scanning fluorimetry of Mena EVH1 (black trace) and Mena EVH1 bound to PTP1B (residues 304–311; purple trace). (B) Views of the structure of Mena EVH1 domain (blue) as a ribbon with arrows for β strands and ribbons for helices. Bound PTP1B residues are shown in stick representation and are color-coded purple. Omit maps (σ = 4) corresponding to bound PTP1B residues are shown in the green mesh. (C) Surface representation of the Mena EVH1 domain colored by positive (blue) and negative (red) electrostatic potentials with bound PTP1B residues. (D) Close-up view of PTP1B (stick representation, purple) bound to Mena EVH1 (ribbon representation). Interacting side chains of Mena EVH1 with PTP1B are shown in stick representation. Potential H-bonds are indicated by black dashed lines and distances are denoted.

References

    1. Faix J; Rottner K Ena/VASP proteins in cell edge protrusion, migration and adhesion. J. Cell Sci. 2022, 135 (6), No. jcs259226, DOI: 10.1242/jcs.259226. - DOI - PubMed
    1. Volkman BF; Prehoda KE; Scott JA; Peterson FC; Lim WA Structure of the N-WASP EVH1 Domain-WIP Complex. Cell 2002, 111 (4), 565–576. - PubMed
    1. Barzik M; Carl UD; Schubert WD; Frank R; Wehland J; Heinz DW The N-terminal domain of Homer/Vesl is a new class II EVH1 domain. J. Mol. Biol. 2001, 309 (1), 155–169. - PubMed
    1. Zhang X; Meng X; Wang P; Luan C; Wang H Bioinformatics analysis for the identification of Sprouty-related EVH1 domain-containing protein 3 expression and its clinical significance in thyroid carcinoma. Sci. Rep. 2024, 14 (1), No. 4549, DOI: 10.1038/s41598-024-55187-2. - DOI - PMC - PubMed
    1. Peterson FC Diversity of polyproline recognition by EVH1 domains. Front. Biosci. 2009, 14 (3), 833–846. - PMC - PubMed

Publication types