Clinical Trial
. 2024 Aug 14;15(1):6970.
doi: 10.1038/s41467-024-51495-3.

Inhibition of glycosphingolipid synthesis with eliglustat in combination with immune checkpoint inhibitors in advanced cancers: preclinical evidence and phase I clinical trial

Affiliations
Clinical Trial

Inhibition of glycosphingolipid synthesis with eliglustat in combination with immune checkpoint inhibitors in advanced cancers: preclinical evidence and phase I clinical trial

Liang Dong et al. Nat Commun. .

Abstract

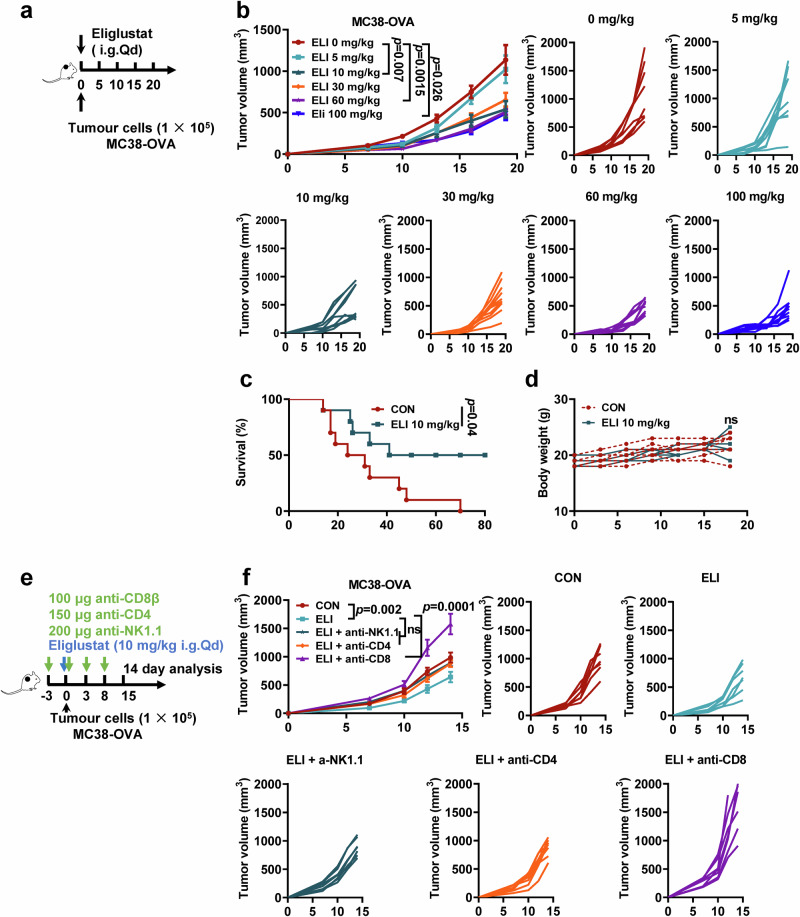
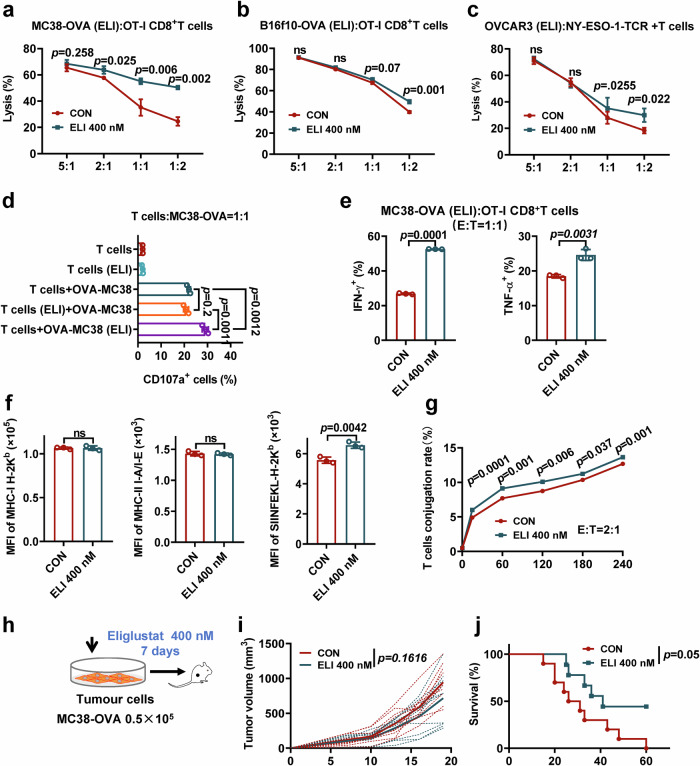
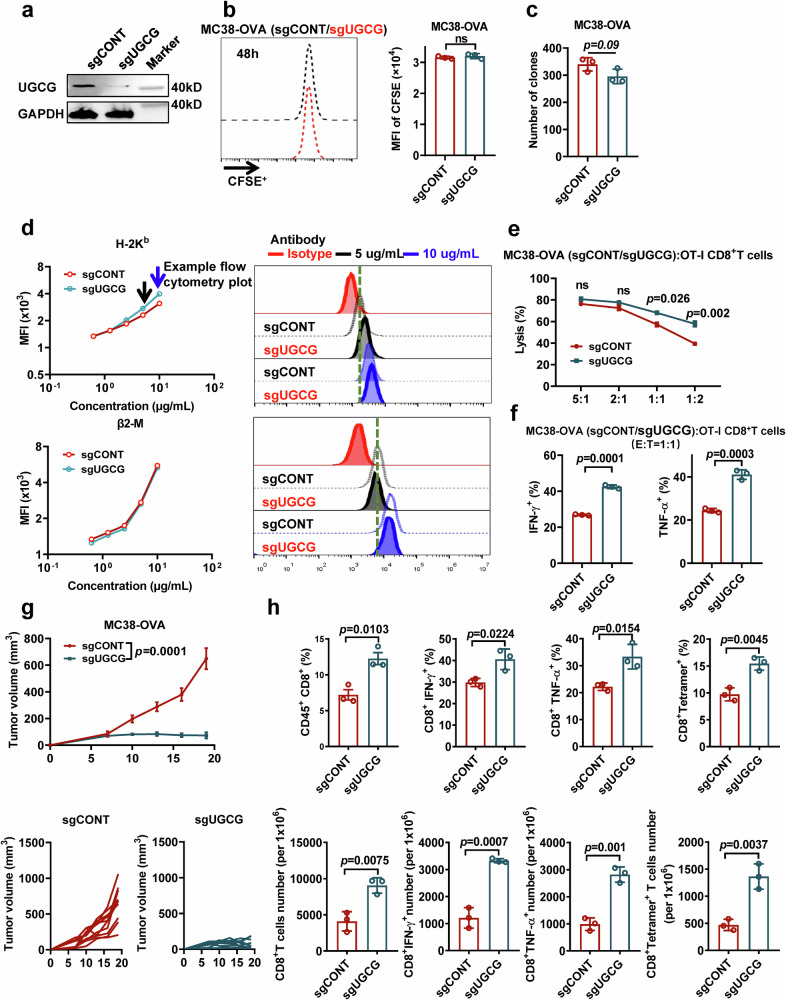
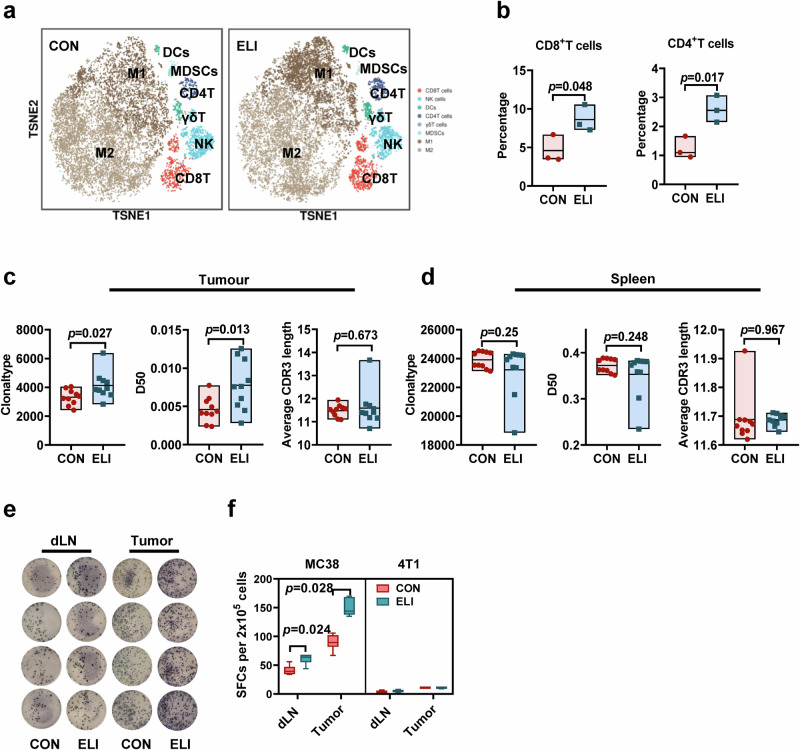
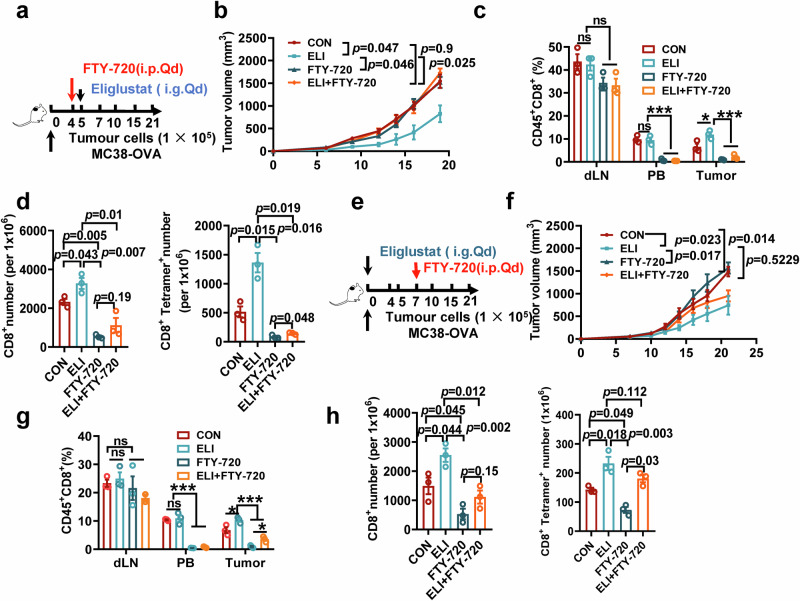
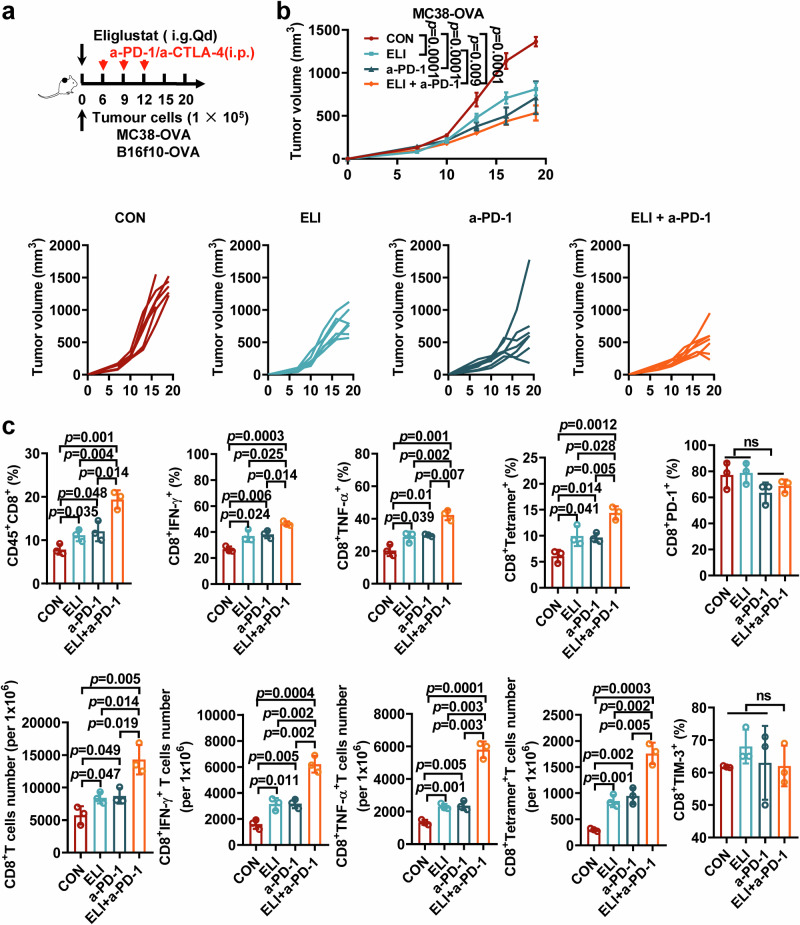
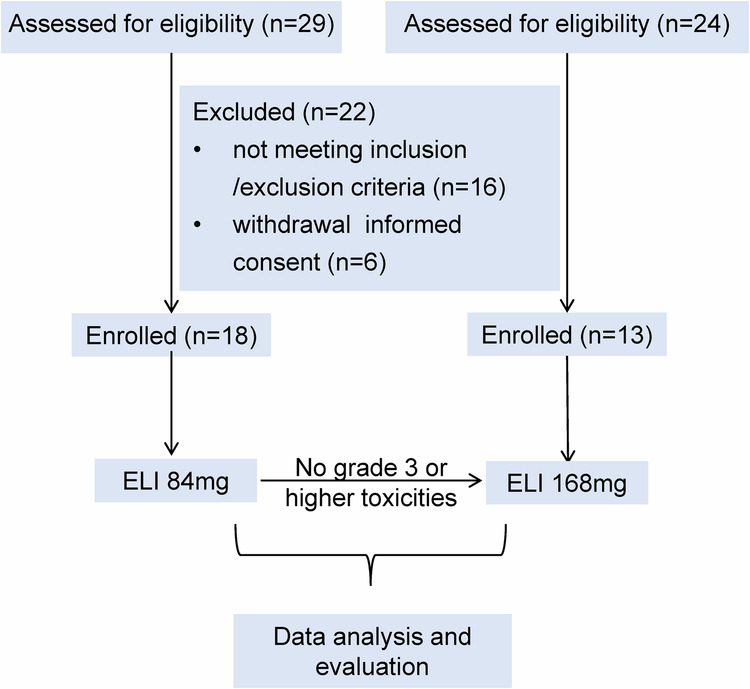
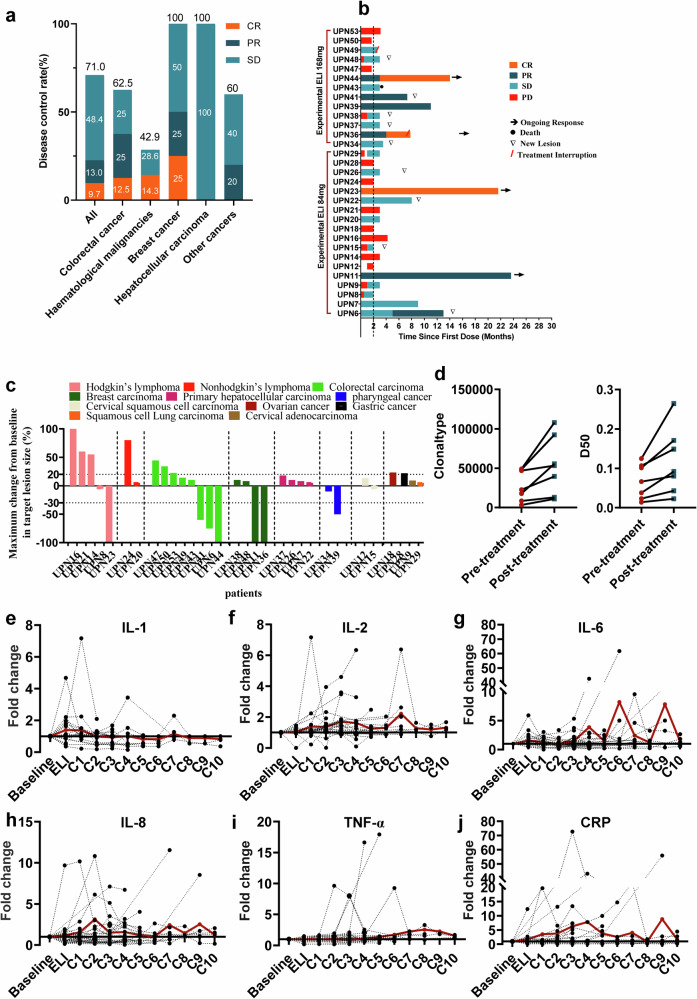
Glycosphingolipids (GSLs) are abundantly expressed in cancer cells. The effects of GSL-targeted immunotherapies are not fully understood. Here, we show that the inhibition of GSL synthesis with the UDP-glucose ceramide glucosyltransferase inhibitor eliglustat can increase the exposure of the major histocompatibility complex (MHC) and tumour antigen peptides, enhancing the antitumour response of CD8+ T cells in a range of tumour models. We therefore conducted a proof-of-concept phase I trial on the combination of eliglustat and an anti-PD-1 antibody for the treatment of advanced cancers (NCT04944888). The primary endpoints were safety and feasibility, and the secondary endpoint was antitumor activity. All prespecified endpoints were met. Among the 31 enrolled patients, only 1 patient experienced a grade 3 adverse event (AE), and no grade 4 AEs were observed. The objective response rate was 22.6% and the disease control rate reached 71%. Of the 8 patients with proficient mismatch repair/microsatellite stable (pMMR/MSS) colorectal cancer, one achieved complete response and two each had partial response and stable disease. In summary, inhibiting the synthesis of GSLs might represent an effective immunotherapy approach.


Conflict of interest statement

The authors declare no competing interests.

Figures

Fig. 1
Fig. 1. Eliglustat mediates tumour growth inhibition through the host immune system in vivo.
a Experimental design. A total of 1 × 105 tumour cells were subcutaneously injected and observed for tumour formation in C57BL/6 mice treated with different doses of eliglustat. b C57BL/6 mice were implanted with 1 × 105 MC38-OVA tumour cells, and the treatment scheme is shown in (a). Tumour sizes were measured every 3 days. The average and individual tumour curves (n = 10 per group) are shown. c Survival curves of MC38-OVA tumour-bearing mice in the control and 10 mg/kg eliglustat-treated groups (n = 10 per group). d Body weights of MC38-OVA tumour-bearing mice in the control and 10 mg/kg eliglustat-treated groups (n = 10 per group). e Injection schedule for antibody-mediated depletion of CD4+ and CD8+ T cells and NK cells and eliglustat treatment in MC38-OVA tumour-bearing mice. f C57BL/6 mice were implanted with 1 × 105 MC38-OVA cells, as shown in (e). Tumour sizes were measured every 3 days. The average and individual tumour curves (n = 7 per group) are shown. The data are shown as the mean ± SEM. ns, not significant. P values were calculated by unpaired two-sided t test in (d). P values were calculated by two-way repeated measures analysis of variance (ANOVA) in (b) and (f) and the log-rank test in (c). CON control, ELI eliglustst. Source data and exact p values are provided as a Source Data file.
Fig. 2
Fig. 2. Inhibiting GSL synthesis modulates receptor accessibility to HLA-I surface H-2Kb and potentiates the antitumour activity of CD8+ T cells.
a CD8+ T-cell killing assay of MC38-OVA-GFP cells cocultured at different ratios with CD8+ T cells isolated from OT-I mice that had been pretreated with anti-CD3, anti-CD28 antibodies and IL-2. MC38-OVA-GFP cells were pretreated with eliglustat. The number of viable MC38-OVA-GFP cancer cells at the end of the assay was determined and reported (n = 3). b, CD8+ T-cell killing assay of B16f10-OVA-GFP cells cocultured at different ratios with CD8+ T cells isolated from OT-I mice. B16f10-OVA-GFP cells were pretreated with eliglustat. The number of viable B16f10-OVA-GFP cancer cells at the end of the assay was determined and reported (n = 3). c NY-ESO-1-TCR+ T-cell killing assay of CD8+ T cells isolated from healthy volunteers cocultured at different ratios with OVCAR3-GFP cells pretreated with eliglustat. The number of viable OVCAR3-GFP cancer cells at the end of the assay was determined and reported (n = 3). d, e FACS analysis of IFN-γ-, TNF-α-, and CD107a-positive CD8+ T cells after coculture with MC38-OVA cancer cells at an effector-to-target ratio of 1:1 (n = 3). Bar colours (d): T cells (red), T cells treated with eliglustat (cyan), T cells + OVA-MC38 (dark green), T cells (eliglustat) + OVA-MC38 (orange), T cells + OVA-MC38(eliglustat) (purple). f MHC-I, MHC-II and H-2Kb-SIINFEKL of MC38-OVA were measured by flow cytometry (n = 3). Bar colours (e, f): control (red), 400 nM eliglustat (dark green). g OT-I T cells were stained with AF700-conjugated anti-CD8 and incubated with MC38-OVA (CFSE) cells at an E:T ratio of 2:1. Flow cytometry analysis of the proportion of OT-I T cells conjugated to MC38-OVA (CFSE) cells (n = 3). h Experimental design. MC38-OVA cells were pretreated with eliglustat for 7 days in vitro, and 0.5 × 105 tumour cells were injected subcutaneously. Tumour formation was observed in C57BL/6 mice. i The tumour curves of the MC38-OVA tumour-bearing mice are shown, and the treatment scheme is shown in (h). j The survival curves of MC38-OVA tumour-bearing mice are shown, and the treatment scheme is shown in (h) (n = 10 per group). The data represent three independent experiments with similar results (ag). The data are presented as the means ± SEMs. ns, not significant. P values in (df) were calculated by unpaired two-sided t tests. P values in (a), (b), (c), (g) and (i) were determined by two-way repeated measures ANOVA and the log-rank test in (j). CON control, ELI eliglustst. Source data and exact p values are provided as a Source Data file.
Fig. 3
Fig. 3. Knockout of UGCG and its effects on T cell anti-tumour in vitro and in vivo.
a Western blot analysis of the expression of UGCG in MC38-OVA with and without UGCG knockout. GAPDH was used as a protein loading control. The analysis was done thrice with biologically independent samples. b Cell proliferation of sgCONT or sgUGCG-MC38-OVA tumour cells by FACS analysis (n = 3). c Colony formation ability of MC38-OVA tumour cells with sgCONT or sgUGCG tumour cells on day 14 (n = 3). d Titration curves of MHC-I-specific antibodies on MC38-OVA cells. Flow cytometry charts of antibody stain as indicated by the arrow. MFI, mean fluorescence intensity (n = 3). e CD8+ T-cell killing assay of sgUGCG-MC38-OVA tumour cells cocultured in different ratios with CD8+ T cells isolated from OT-I mice. The number of viable sgUGCG-MC38-OVA tumour cells at the end point of the assay was determined and reported (n = 3). f FACS analysis IFN-γ, TNF-α, expression of CD8+ T cells after coculture with sgUGCG-MC38-OVA tumour cells at an effector-to-target ratio of 1:1 (n = 3). g, sgCONT- and sgUGCG-MC38-OVA cells grown in C57BL/6 mice(n = 10). About 2 × 105 sgCONT- and sgUGCG-MC38-OVA cells were inoculated subcutaneously into syngeneic mice and monitored for tumour formation. h Phenotype and function of TILs from sgCONT- and sgUGCG-MC38-OVA tumours were detected by flow cytometry analysis at day 21 after tumour inoculation (n = 3). Surface levels of CD8+ T cells, IFN-γ, TNF-α and Tetramer on tumour-infiltrating CD8+ T cells of different groups were analysed. Bar colours (f, h): control sgRNA (red), sgRNA targeting UGCG (dark green). The data represent three independent experiments with similar results (bf). Data are shown as the mean ± SEM. ns, not significant. P values in (b, c, f and h) were calculated by unpaired two-sided t test. P values in (e) were calculated by unpaired two-sided t tests. P values in (g) were determined by two-way repeated measures ANOVA. Source data and exact p values are provided as a Source Data file.
Fig. 4
Fig. 4. Eliglustat alters the immune cell composition and function of the tumour microenvironment.
a MC38-OVA tumour samples were collected from tumour-bearing mice on Day 21 with or without eliglustat and subjected to a CyTOF assay. The t-SNE plot shows all CD45+ cells, coloured according to the type of immunocyte (n = 3). b Proportions of CD4+ and CD8+ T cells in CD45+ T-cell clusters (n = 3). c,d Total TCRs, clonal type, unique TCRs (D50), and average CDR3 length of T cells from both the control and eliglustat-treated tumours and spleens were determined by using TCR-β CDR3 sequencing (n = 9). Box plots display the median (centre line) and minimum and maximum values (boxes) (bd). Box colours (bd): control (red), eliglustat treated (blue). e,f MC38 tumour-bearing mice 21 days after eliglustat treatment. CD8+ T cells were collected from dLNs and tumours, and the IFN-γ ELISPOT assay was performed with 4T1 or MC38 cell restimulation (n = 4). The data represent three independent experiments with similar results (bf). Box plot whiskers extend to the minimum and maximum values, with the centre line indicating the median, and the box encompassing the interquartile range. P values were determined by unpaired two-sided t tests in (b, c, d and f). CON control, ELI eliglustst, dLN draining lymph node. Source data and exact p values are provided as a Source Data file.
Fig. 5
Fig. 5. Tumour-specific T cells are primed in dLNs.
a Experimental design. MC38-OVA-bearing mice were administered FTY720 on Day 4 and 10 mg/kg eliglustat on Day 5, starting on Day 21 through the end of the experiment (n = 5). b Tumour curves of MC38-OVA tumour-bearing mice; the treatment scheme is shown in Fig. 4a. c Flow cytometric analysis of T cells from dLNs, peripheral blood, and tumours. The percentages of CD8+ T cells in the dLNs, peripheral blood, and tumours of different groups of mice (n = 3). d Absolute numbers of CD8+ T cells and CD8+ tetramer+ T cells in different groups of mice (n = 3). e Experimental design. MC38-OVA-bearing mice were administered 10 mg/kg eliglustat on Day 0 and were administered FTY720 on Day 7, starting on Day 21 through the end of the experiment (n = 5). f Tumour curves of MC38-OVA tumour-bearing mice(n = 7); the treatment scheme is shown in Fig. 4e. g Flow cytometric analysis of T cells from dLNs, peripheral blood, and tumours. The percentages of CD8+ T cells in the dLNs, peripheral blood, and tumours of different groups of mice (n = 3). h Absolute numbers of CD8+ T cells and CD8+ tetramer+ T cells in different groups of mice (n = 3). The data represent three independent experiments with similar results. The data are presented as the means ± SEMs. ns, not significant. P values were determined by two-way repeated measures ANOVA in (b and f) and by unpaired two-sided t tests in (c, d, g and h). CON control, ELI eliglustst, dLN draining lymph node, PB peripheral blood. Source data and exact p values are provided as a Source Data file.
Fig. 6
Fig. 6. Eliglustat synergizes with ICB.
a Experimental design. C57BL/6 mice were transplanted with 1 × 105 MC38-OVA cells and treated with PBS (CON group), eliglustat alone (ELI, 10 mg/kg), an anti-PD-1 antibody alone (a-PD-1, 200 mg/kg per mouse) or eliglustat plus anti-PD-1 as indicated (ELI+ a-PD-1). Tumour sizes were examined every other day. b Average and individual tumour growth curves of each treatment group are shown (n = 7). c The phenotype and function of tumour-infiltrating lymphocytes from MC38-OVA tumours were determined by flow cytometry analysis on Day 21 after tumour inoculation (n = 3). CD4+ T cells, CD8+ T cells, IFN-γ, TNF-α, PD-1, TIM-3 and tetramer+ cell surface levels in the tumours of different treatment groups. Absolute numbers of CD4+ T cells, CD8+ T cells and IFN-γ+, TNF-α+, and tetramer+ T cells per 106 cells (n = 3). Bar colours (d): control (red), eliglustat (cyan), ant-PD-1 (dark green), eliglustat + anti-PD-1 (orange). The data represent three independent experiments with similar results. The data are presented as the means ± SEMs. ns, not significant. P values were determined by two-way repeated measures ANOVA in (b) and unpaired two-sided t tests in (c). CON control, ELI eliglustst. Source data and exact p values are provided as a Source Data file.
Fig. 7
Fig. 7. CONSORT flow diagram.
Of the 53 patients recruited, 16 violated the inclusion/exclusion criteria, and 6 withdrew their informed consent, resulting in the final enrolment of 31 patients. The dose of eliglustat used in the early part of the trial was 84 mg, and after no dose-related toxicity was observed clinically, the remaining 13 patients were given a dose of 168 mg. Eliglustat was administered once daily for the first 14 days and then every other week until the 24th week. For participants who continued to benefit from the trial, eliglustat was administered daily every other week up to 96 weeks. Immune checkpoint inhibitors were administered intravenously on Day 5 or Day 15 every 3 weeks. For subjects whose greatest lesion diameter was ≥3 cm, immune checkpoint inhibitors were administered on Day 5. For subjects whose greatest lesion diameter was <3 cm, immune checkpoint inhibitors were administered on Day 15. ELI eliglustat.
Fig. 8
Fig. 8. Patient DCRs, response durations and serum cytokine levels.
a Disease control rate in all 31 patients and patients with different cancers. b Duration following initial treatment (n = 31). Patient 36 halted treatment due to severe skin breakdown but resumed treatment after hormonal therapy. Patient 43 died from a lung infection caused by coronavirus disease after three months of SD. Patient 49 was excluded due to receiving other tumour treatments. Nine patients developed new lesions, but the primary lesion was under control. Four patients maintained ongoing responses. c Waterfall plot showing maximum changes from baseline in target lesion size in tumours of patients with different tumour types (n = 31). d Total TCRs and unique TCRs of T cells from the PB of patients who achieved an objective response according to TCR-β CDR3 sequencing (n = 7). Red represents detection at pre-treatment and dark green represents detection at post-treatment. ej Changes in blood serum cytokine levels in patients after different cycles of anti-PD-1 antibody treatment compared to baseline (n = 31). Dotted lines represent individual patients; the solid line represents the mean of all patients. CR complete response, PR partial response, SD stable disease, PD disease progression. Source data and exact p values are provided as a Source Data file.

Similar articles

Cited by

References

    1. Hakomori, S. Aberrant glycosylation in tumors and tumor-associated carbohydrate antigens. Adv. cancer Res.52, 257–331 (1989). 10.1016/S0065-230X(08)60215-8 - DOI - PubMed
    1. Chang, W. W. et al. Expression of Globo H and SSEA3 in breast cancer stem cells and the involvement of fucosyl transferases 1 and 2 in Globo H synthesis. Proc. Natl. Acad. Sci.105, 11667–11672 (2008). 10.1073/pnas.0804979105 - DOI - PMC - PubMed
    1. Ho, M. Y., Yu, A. L. & Yu, J. Glycosphingolipid dynamics in human embryonic stem cell and cancer: their characterization and biomedical implications. Glycoconj. J.34, 765–777 (2017). 10.1007/s10719-016-9715-x - DOI - PubMed
    1. Lou, Y. W. et al. Stage-specific embryonic antigen-4 as a potential therapeutic target in glioblastoma multiforme and other cancers. Proc. Natl. Acad. Sci.111, 2482–2487 (2014). 10.1073/pnas.1400283111 - DOI - PMC - PubMed
    1. Yu, J., Hung, J. T., Wang, S. H., Cheng, J. Y. & Yu, A. L. Targeting glycosphingolipids for cancer immunotherapy. FEBS Lett.594, 3602–3618 (2020). 10.1002/1873-3468.13917 - DOI - PubMed

Publication types

MeSH terms