. 2024 Aug 14;15(1):6971.
doi: 10.1038/s41467-024-51166-3.

TFEB activation hallmarks antigenic experience of B lymphocytes and directs germinal center fate decisions

Affiliations

TFEB activation hallmarks antigenic experience of B lymphocytes and directs germinal center fate decisions

Matthias Münchhalfen et al. Nat Commun. .

Abstract

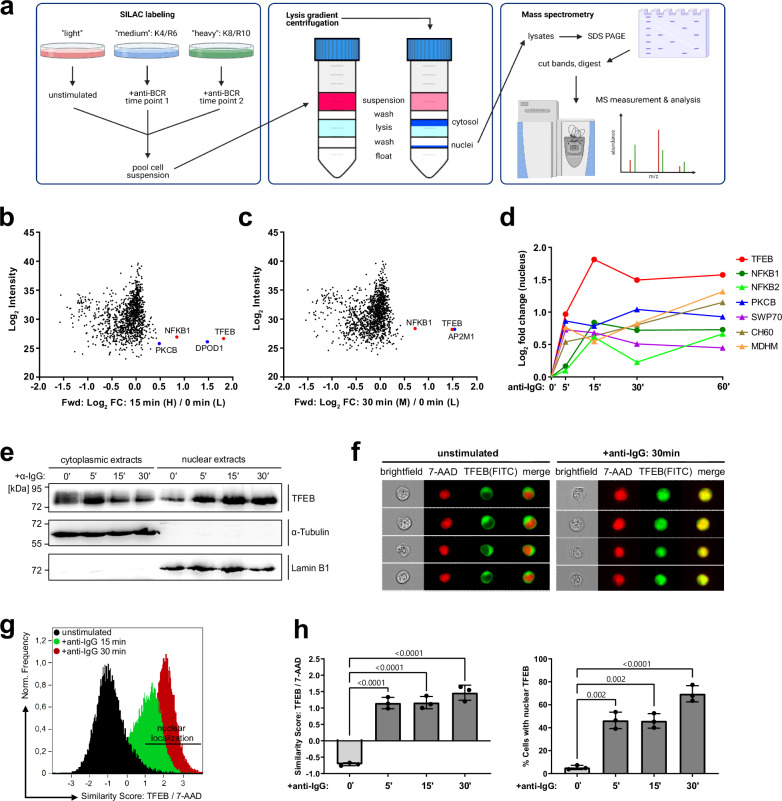
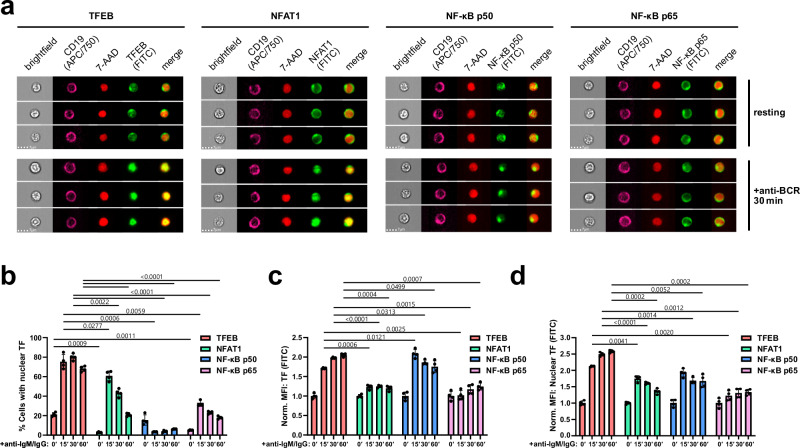
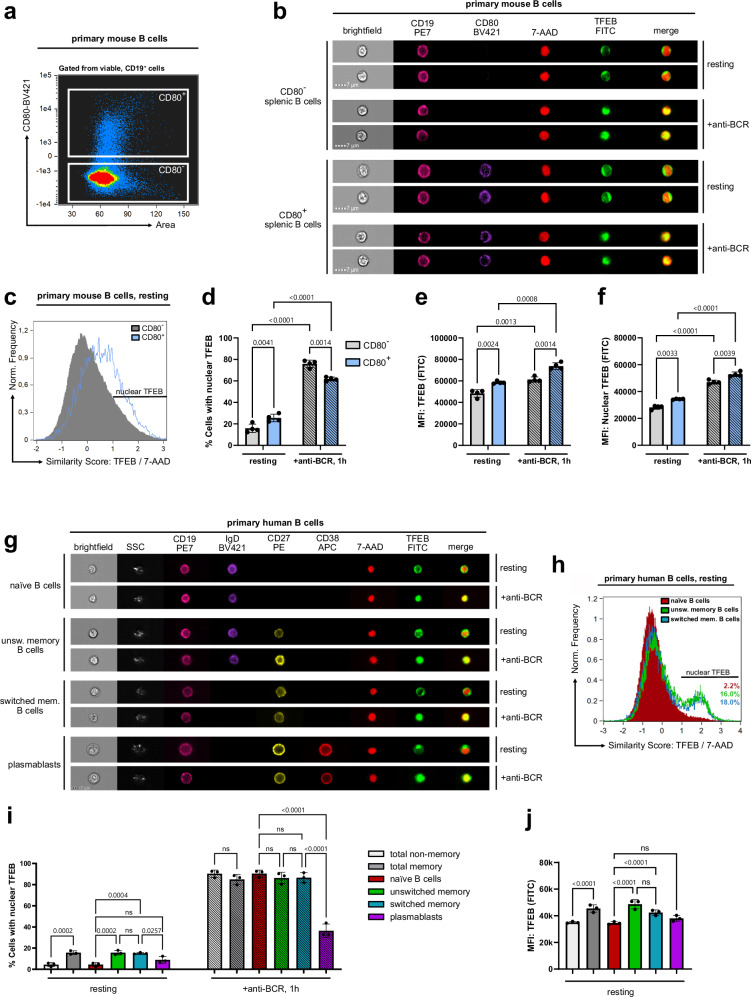
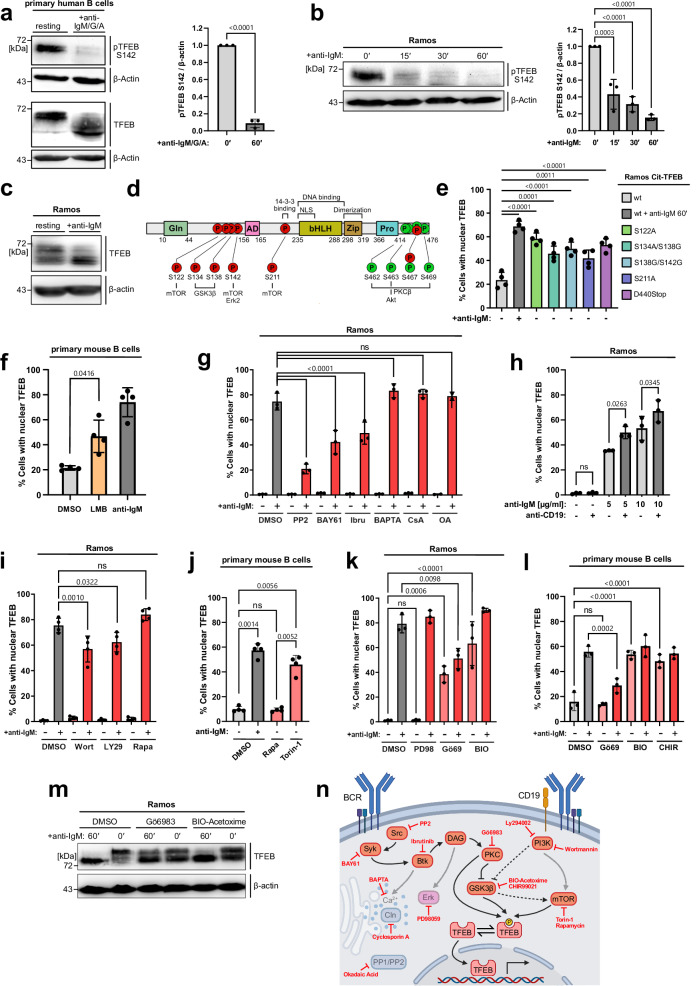
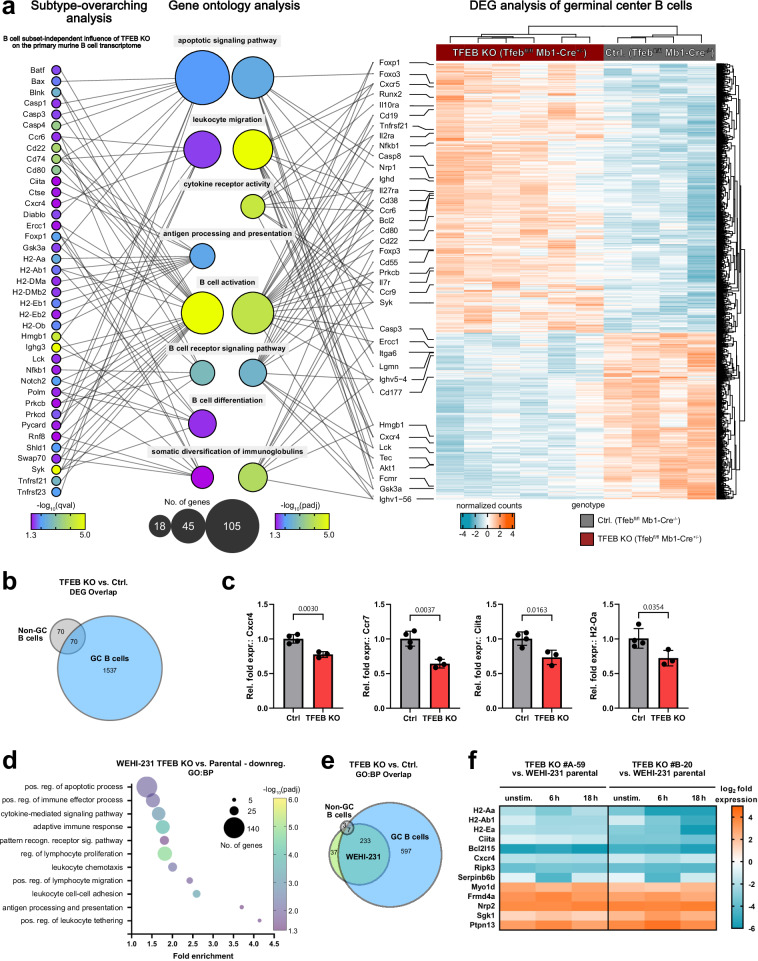
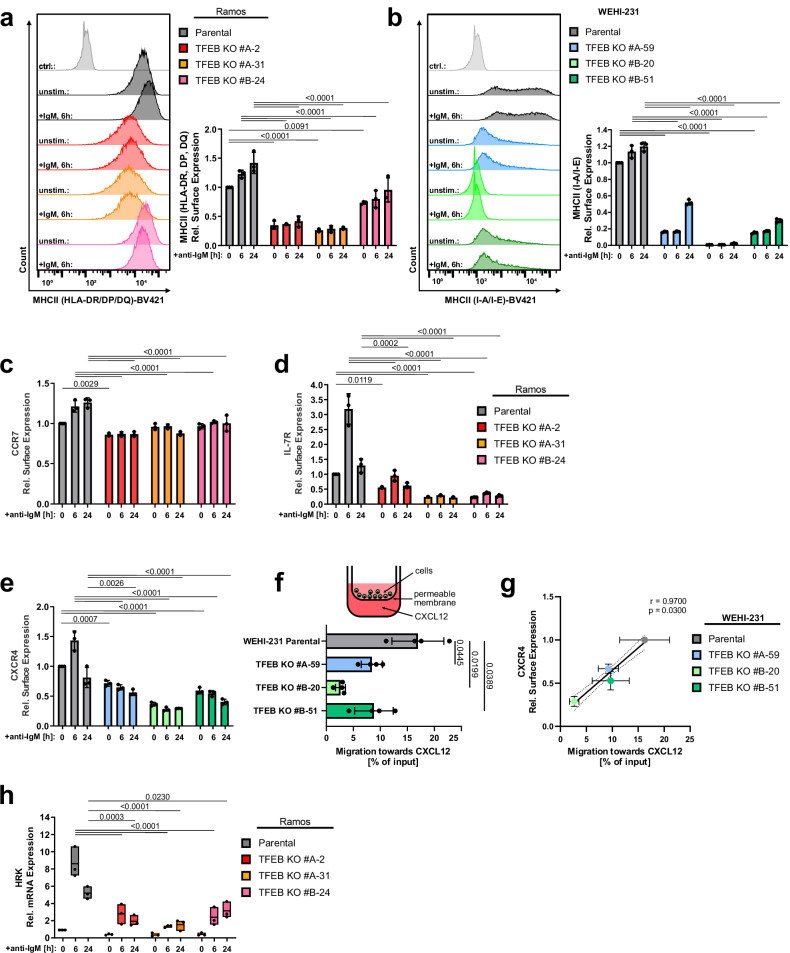
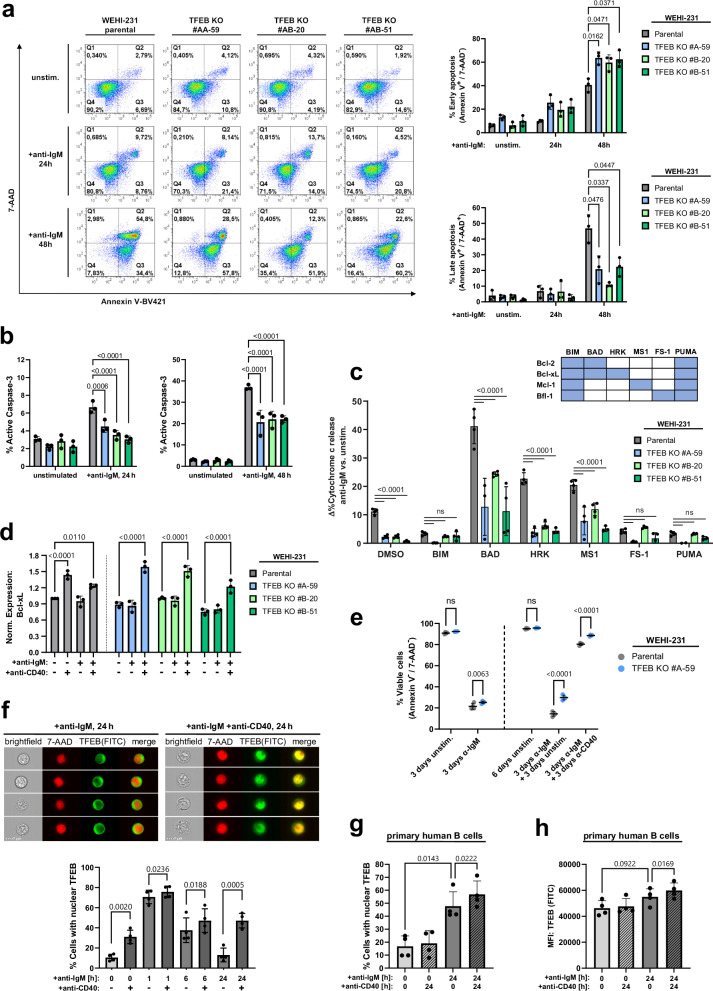
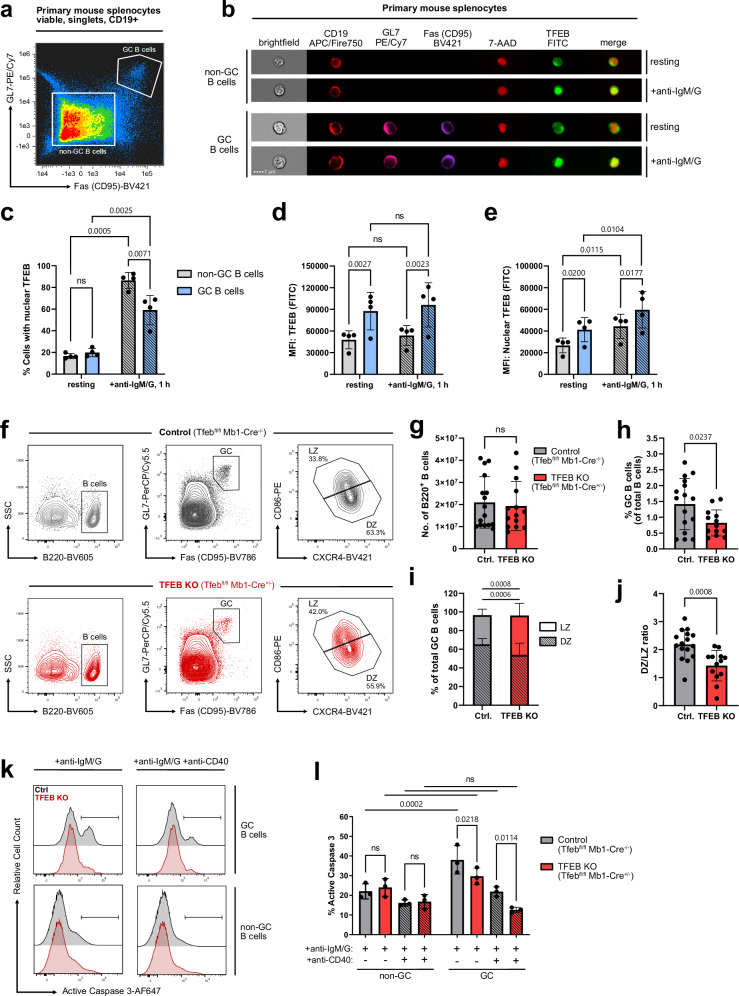
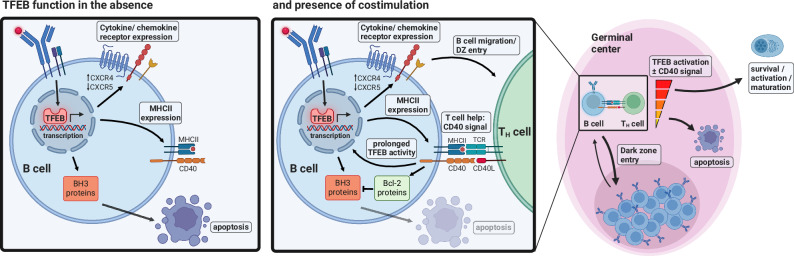
Ligation of the B cell antigen receptor (BCR) initiates humoral immunity. However, BCR signaling without appropriate co-stimulation commits B cells to death rather than to differentiation into immune effector cells. How BCR activation depletes potentially autoreactive B cells while simultaneously primes for receiving rescue and differentiation signals from cognate T lymphocytes remains unknown. Here, we use a mass spectrometry-based proteomic approach to identify cytosolic/nuclear shuttling elements and uncover transcription factor EB (TFEB) as a central BCR-controlled rheostat that drives activation-induced apoptosis, and concurrently promotes the reception of co-stimulatory rescue signals by supporting B cell migration and antigen presentation. CD40 co-stimulation prevents TFEB-driven cell death, while enhancing and prolonging TFEB's nuclear residency, which hallmarks antigenic experience also of memory B cells. In mice, TFEB shapes the transcriptional landscape of germinal center B cells. Within the germinal center, TFEB facilitates the dark zone entry of light-zone-residing centrocytes through regulation of chemokine receptors and, by balancing the expression of Bcl-2/BH3-only family members, integrates antigen-induced apoptosis with T cell-provided CD40 survival signals. Thus, TFEB reprograms antigen-primed germinal center B cells for cell fate decisions.


Conflict of interest statement

A. Ballabio is co-founder of CASMA Therapeutics and an advisory board member of Next Generation Diagnostics and Avilar Therapeutics. All other authors declare no competing interests.

Figures

Fig. 1
Fig. 1. Proteomic profiling of B-lymphoid nuclear logistics reveals TFEB as a BCR-inducible element.
a Schematic representation of the ‘translocatome’ approach. IIA1.6 B cells were metabolically labeled via SILAC using three distinct combinations of isotope-marked lysine (K) and arginine (R), and either left untreated or BCR-stimulated for multiple time points (left). Pooled cells were fractionated by iodixanol-based lysis gradient centrifugation (middle). Nuclei were lysed and nuclear proteins were quantified by LC/LC tandem mass spectrometry (right). This graphical overview was created with BioRender.com under a Creative Commons Attribution-NonCommercial-NoDerivs 4.0 international license. ac Triple SILAC MS analysis of BCR-induced nuclear translocation. b, c Scatter plots representing log2-fold enriched nuclear proteins following 15 and 30 min of BCR stimulation plotted against the log2 signal intensity. Proteins significantly enriched at two-time points are highlighted in blue, and significantly enriched proteins at ≥ 3-time points are marked in red. d Nuclear translocation kinetics of significantly enriched proteins detected at all indicated time points of BCR stimulation. Circles and triangles indicate proteins identified under ‘forward’ or ‘reverse’ SILAC labeling conditions. e IIA1.6 B cells were left untreated or BCR-stimulated for the indicated time periods, fractionated via iodixanol-based lysis gradient centrifugation and the subcellular distribution of TFEB was analyzed by immunoblotting with anti-TFEB antibodies. Successful subcellular fractionation was confirmed by immunoblotting with antibodies against tubulin and lamin B1 as cytosolic and nuclear envelope marker proteins, respectively. Relative molecular masses of marker proteins are indicated on the left in kDa. fh Resting or BCR-stimulated IIA1.6 B cells were fixed and stained with rabbit anti-TFEB and anti-rabbit-FITC antibodies. Nuclei were counterstained with 7-AAD. Nuclear translocation kinetics of TFEB was assessed by imaging flow cytometric analysis of 2 × 104 cells and is shown in (f) as representative images depicting untreated versus BCR-stimulated cells, in (g) as histograms depicting the similarity co-localization scores of TFEB (FITC) versus 7-AAD in (h) as mean similarity score of TFEB/7-AAD and as defined by the percentage of cells with similarity score of TFEB/7-AAD ≥ 1. Data is depicted as mean ± SD of n = 3 independent experiments. Statistical significances were calculated using one-way ANOVA and corrected for multiple testing via Tukey’s method. Source data are provided as a Source Data file.
Fig. 2
Fig. 2. Translocation of TFEB hallmarks B cell receptor signaling.
Splenocytes of wild-type C57BL/6 mice were left untreated or stimulated with anti-IgM and anti-IgG for the indicated durations. a, b TFEB, as well as the classical transcription factors NFAT1, NF-κB p50 and NF-κB p65 was assessed for BCR-induced nuclear translocation by staining the transcription factors together with the nuclear marker 7-AAD as described above. Cells with similarity scores ≥ 1 were defined as cells with nuclear localization of the respective transcription factor. Representative images (a) and statistical analysis (b) of nuclear translocation. c, d Expression levels, as defined by the fluorescence intensity of the respective transcription factors, (c) within the whole cell and (d) within the nucleus. All data are depicted as mean ± SD derived from n = 4 biological replicates. Statistical significances were calculated using RM two-way ANOVA and corrected for multiple testing via Dunnett’s method. Source data are provided as a Source Data file.
Fig. 3
Fig. 3. Nuclear TFEB reflects antigenic B cell experience.
af Splenocytes of aged-matched wild-type C57BL/6 mice were left untreated or stimulated with anti-IgM and anti-IgG for 60 min. Among splenic CD19+ B cells, CD80- B cells and CD80+ memory B cells were differentiated through surface staining (a). TFEB nuclear translocation was analyzed by imaging flow cytometry as described in Fig. 1. b Representative multi-channel images of individual cells. c Histograms depicting TFEB/7-AAD similarity scores of CD80- and CD80+ B cells in the absence of BCR ligation. d Percentages of cells with similarity scores of TFEB/7-AAD ≥ 1 in resting and BCR-stimulated subsets. e, f Expression of TFEB (e) within the whole cell and (f) within the nucleus. gj Primary human B cells were isolated from the blood of healthy donors and left untreated or BCR-stimulated for 60 min. Localization of TFEB in individual primary human B cell subpopulations is defined by the following cell surface staining patterns. CD19+CD27-IgD+ (naïve), CD19+CD27- (total non-memory), CD19+CD27+ (total-memory), CD19+CD27+IgD+ (unswitched memory), CD19+CD27+IgD- (switched memory), or CD19+CD27+IgD-CD38+ (plasmablasts). The corresponding gating strategy is shown in Supplementary Fig. 2f. g Representative multi-channel images of individual cells. h Histogram analysis of naïve B cells, or unswitched and switched memory B cells in the absence of BCR ligation. of TFEB (FITC) versus 7-AAD similarity score. i Percentages of cells with similarity scores of TFEB/7-AAD ≥ 1 in resting and BCR-stimulated B cell subsets. j TFEB expression among resting B cell subsets. All data are depicted as mean ± SD of n = 3 independent experiments. Statistical significances were calculated using one-way ANOVA and corrected for multiple testing via Tukey’s method. Source data are provided as a Source Data file.
Fig. 4
Fig. 4. BCR signaling mobilizes TFEB through kinase inhibition.
ac Resting or BCR-stimulated primary human B cells from the blood of healthy donors (a) or Ramos B cells (b, c) were subjected to immunoblot analysis of total TFEB and phospho-S142 TFEB. Quantification of phospho-S142 TFEB in (a, b) was normalized to β-actin and is depicted as mean ± SD of n = 3 independent experiments. Statistical significance was computed using (a) an unpaired two-tailed Student’s t-test or (b) Tukey-corrected one-way ANOVA. d Schematic representation of reported TFEB phosphorylation sites (P) within individual TFEB domains indicated by GLN (glutamin-rich), AD (transcriptional activation), bHLH (basic helix-loop helix), Zip (leucine zipper), Pro, (proline-rich) and NLS (nuclear localization site). e Ramos transductants expressing TFEB variants were left untreated (−) or BCR-stimulated (+), and TFEB translocation was analyzed by imaging flow cytometry as described before. f CD19+ B cells of age-matched C57BL/6 mice were treated with DMSO, incubated with 20 nM leptomycin B (LMB) or BCR-stimulated for 60 min. g Wild-type Ramos B cells were left untreated (−) or BCR-activated (+, 60 min) in the presence of the following pharmacological agents: PP2, BAY61-3606 or ibrutinib (inhibiting Src, Syk or Btk, respectively), or the Ca2+ chelator BAPTA-AM, or cyclosporin A (calcineurin inhbitor) or okadaic acid (inhibitor of PP1 and PP2) and analyzed for TFEB translocation. h Wild-type Ramos B cells were treated with anti-BCR antibodies or 10 µg/ml anti-CD19 antibodies as indicated. il Nuclear translocation of TFEB in wild-type Ramos (i and k) or CD19+ splenic B cells of age-matched C57BL/6 mice (j and l) were left untreated (−) or BCR-activated (+, 60 min) in the presence of the following pharmacological inhibitors: Wortmannin, LY294002 (both PI3K), rapamycin (mTOR), torin-1 (ATP-competitive mTOR inhibitor), PD98059 (ERK), BIO-Acetoxime (GSK3β), CHIR99021 (GSK3β) or Gö6983 (PKC). Data is depicted as mean ± SD of n = 3 (g, h, k and l) or n = 4 (e, f, i and j) independent experiments. Statistical significances were computed using Tukey-corrected one-way ANOVA. m Immunoblot analysis of TFEB phosphorylation in Ramos B cells left untreated or BCR-activated in the presence of the indicated kinase inhibitors. n Schematic representation of the examined signaling network. This graphical overview was created with BioRender.com under a Creative Commons Attribution-NonCommercial-NoDerivs 4.0 international license. Source data are provided as a Source Data file.
Fig. 5
Fig. 5. TFEB shapes the transcriptional landscape of GC B cells.
ae Splenocytes from TFEB-deficient C57BL/6 mice (n = 6) and control littermates (n = 4) were sorted into B220+Fas+GL7+ germinal center (GC) and B220+Fas-GL7- non-GC B cells and subjected to bulk RNA sequencing. a B cell subtype-overarching analysis shows the transcriptional deregulation explained by TFEB’s absence across non-GC and GC subsets. DEGs were defined by a qval< 0.05, with selected DEGs shown on the left. Statistical significances were computed using likelihood-ratio tests, corrected for multiple testing via Benjamini & Hochberg’s method. The heatmap on the right shows all > 1600 DEGs (padj< 0.05) in TFEB-negative GC B cells and their clustering among genotypes and samples. Statistical significances were computed using Wald tests, adjusted by Benjamini & Hochberg’s procedure. Selected DEGs found in either analysis were mapped onto relevant “biological process” GO terms (GO:BP, middle). GO enrichment and the number of DEGs per term are reflected in the respective bubble’s color and size. Selected target genes are connected via line to their respective GO terms. b Venn diagram of DEGs between TFEB-deficient GC and non-GC B cells. c FACS-sorted non-GC B cells from TFEB KO (n = 4) and control littermates (n = 3) were subjected to qRT-PCR analysis. Normalized expression of selected genes is depicted as mean ± SD. Statistical significances were computed using unpaired two-sided Student’s t-tests. df Independent TFEB-deficient WEHI-231 clones (#A-59 and #B-20) and parental cells were left untreated or BCR-stimulated for 6 or 18 h and subjected to RNA sequencing. Data were derived from n = 2 independent experiments using two mutant clones. DEGs were defined by an FDR < 0.01 and a log2 fold change of > 1 or < −1 and were subjected to gene ontology analysis (‘GOrilla’). d Selection of highly enriched GO terms. The number of genes per term is illustrated by bubble size, while adjusted FDR values are represented through a color gradient. e Venn diagram of significantly enriched GO:BP terms between TFEB-depleted GC B cells, non-GC B cells and WEHI-231 knockouts. f Heatmap depicting log2 fold changes of selected DEGs with immunological relevance for TFEB mutant clones versus parental WEHI-231 cells. Source data are provided as a Source Data file.
Fig. 6
Fig. 6. TFEB governs B cell responsiveness to co-stimulatory signals.
Wild-type or three independently generated TFEB mutants of either Ramos (a, c, and h) or WEHI-231 cells (b and e) were left untreated or BCR-stimulated for the indicated time periods. Subsequently, cell surface expression of MHC class II proteins (ab), the cytokine receptors CCR7 (c), IL-7 R (d) and CXCR4 (e) was analyzed by flow cytometry. f The migratory capability of wild-type or TFEB mutant WEHI-231 cells towards CXCL12 was measured through transwell migration assays. Data in (af) are presented as mean ± SD of n = 4 independent experiments. Statistical significances were computed using one-way ANOVA and corrected for multiple testing via Dunnett’s method. g The amount of surface CXCR4 expression measured in (e) was plotted against the migration efficiency towards CXCL12 depicted in (f). The linear relationship between these parameters was analyzed using Pearson’s correlation. Statistical significance is depicted as correlation coefficient and the corresponding two-sided p value. Linear regression is shown as solid line and the 95% CI is marked with dotted curves. h HRK relative mRNA expression was quantified by qRT-PCR using the ΔΔCT-method. Data is presented as mean of n = 3 independent experiments (with the box depicting min, max and the mean values). Source data are provided as a Source Data file.
Fig. 7
Fig. 7. TFEB balances pro-apoptotic BCR with CD40 rescue signals.
a Parental and TFEB-mutant WEHI-231 B cells were left untreated or BCR-stimulated for the indicated periods. Flow cytometric co-staining with Annexin V-BV421 and 7-AAD was used to detect early (Annexin V+/7-AAD-) and late apoptosis (Annexin V+/7-AAD+). b Flow cytometry analysis of active caspase-3 in WEHI-231 cells treated as described above. Data in (a, b) are depicted as mean percentage±SD of gated cells from n = 3 independent experiments. Significances were computed using Dunnett-corrected two-way ANOVA. c BH3 profiling of TFEB-depleted and parental WEHI-231 cells using the indicated BH3-agonistic peptides. Binding specificities towards Bcl-2 family proteins are indicated in the corresponding matrix. Cytochrome c release was monitored for resting cells or after 6 h of BCR ligation by flow cytometry. BCR-induced sensitization is presented as mean ± SD percent difference (Δ%) between n = 4 technical replicates of stimulated versus unstimulated cells. Depicted data are representative of n = 3 biological replicates. Statistical significances were calculated using Tukey-corrected one-way ANOVA. d WEHI-231 cells were incubated with the indicated combinations of anti-BCR and anti-CD40 antibodies for 6 h. Intracellular Bcl-xL expression was assessed by flow cytometry and is depicted as MFI, normalized to unstimulated parental cells. e Parental WEHI-231 and TFEB KO #A-59 cells were left untreated or stimulated, as indicated. Medium was changed on day 3, and cells were left untreated or were rescued with anti-CD40 until day 6. On day 3 and day 6, cells were incubated with Annexin V/7-AAD to access viability, as defined by a double negative staining. f WEHI-231 cells were BCR-stimulated for the indicated time periods in the presence or absence of CD40 ligation. Imaging flow cytometry-derived representative images and nuclear translocation of TFEB as percentages of cells with a TFEB/7-AAD similarity score ≥ 1. g, h Primary peripheral human CD19+ B cells were left untreated or BCR-stimulated for 24 h with or without CD40 ligation. Nuclear translocation (g) and expression (h) of TFEB was measured by imaging flow cytometry. Data shown in (dh) is presented as mean ± SD of n = 3 (d) or n = 4 (eh) independent experiments. Statistical significances were calculated using Tukey-corrected one-way ANOVA. Source data are provided as a Source Data file.
Fig. 8
Fig. 8. TFEB promotes antigen-induced apoptosis in GC B cells.
ae Mouse splenocytes were left untreated or stimulated with anti-IgM/G for 60 min and analyzed for TFEB expression and subcellular distribution by imaging flow cytometry. a Staining strategy to distinguish germinal center and non-GC B cells from total splenocytes. GC B cells were gated as CD19+Fas+GL7+, whereas non-GC B cells were defined as CD19+Fas-GL7- (gating depicted in Supplementary Fig. 9a). b Representative multi-channel images of individual resting and BCR-stimulated germinal center and non-GC B cells. c Percentage of cells with translocated TFEB, as defined by TFEB/7-AAD similarity score ≥ 1. d Mean fluorescence intensity of TFEB. e Mean fluorescence intensity of TFEB within the nucleus. Data are depicted as mean ± SD of n = 4 littermates. Statistical significances were computed using RM two-way ANOVA, corrected for multiple testing via Tukey’s method. fj Flow cytometric analyzes of GC subsets in B cell-conditional TFEB mutant mice (n = 13) and control littermates (n = 16). f GC B cells gated as B220+Fas+GL7+. were further distinguished in LZ and DZ GC B cells by their expression of CD86 and CXCR4. g Absolute number of splenic B220+ B cells. h Percentage of B220+Fas+GL7+ GC B cells among total B220+ B cells. i Percentage of LZ and DZ GC B cells among total GC B cells. j Ratio of LZ and DZ GC B cells. Data in (gj) are depicted as mean ± SD. Statistical significances were computed using Šidák-corrected RM two-way ANOVA (i) or two-tailed Student’s t-test (gj). k, l Splenocytes of TFEB-depleted and control mice were isolated and stimulated with anti-IgM/G and co-stimulated with CD40 for 18 h, as indicated. CD19+ B cells were further subgated into germinal center (CD19+Fas+GL7+) and non-GC B cells (CD19+Fas-GL7-; gating depicted in Supplementary Fig. 9b) and co-stained with anti-active caspase-3-AF647 and Zombie Green dye. k Selected histograms depicting active caspase-3 fluorescence intensity. l Proportions of active caspase-3-positive B cells among GC or non-GC B cells, depicted as mean ± SD of n = 3 independent experiments. Statistical significances were computed using RM two-way ANOVA and Fisher’s LSD test. Source data are provided as a Source Data file.
Fig. 9
Fig. 9. Proposed mechanisms by which TFEB governs B-lymphoid fate decisions.
Antigenic stimulation induces nuclear translocation of TFEB. In the absence of T cell help, TFEB transcriptional activity leads to death-by-neglect through upregulation of pro-apoptotic proteins (e.g., BH3-only proteins, caspase-3). Concomitantly, TFEB arranges for a possible rescue by promotion of B cell migration to lymph follicles and GC entry (e.g. via regulation of CXCR4 and CXCR5) as well as induction of antigen presentation via MHC II. In the presence of T-lymphoid co-stimulation, CD40 rescue prevents TFEB-driven apoptosis by upregulation of Bcl-2 family proteins. CD40 signaling concurrently prolongs TFEB nuclear activity, further enhancing TFEB’s stimulatory influence on B cells, leading to further activation and maturation through DZ (re-)entry. This graphical summary was created with BioRender.com under a Creative Commons Attribution-NonCommercial-NoDerivs 4.0 international license.

References

    1. Kwak, K., Akkaya, M. & Pierce, S. K. B cell signaling in context. Nat. Immunol.20, 963–969 (2019). - PubMed
    1. De Silva, N. S. & Klein, U. Dynamics of B cells in germinal centres. Nat. Rev. Immunol.15, 137–148 (2015). - PMC - PubMed
    1. Parker, D. C. T cell-dependent B cell activation. Annu. Rev. Immunol.11, 331–360 (1993). - PubMed
    1. Elgueta, R. et al. Molecular mechanism and function of CD40/CD40L engagement in the immune system. Immunol. Rev. 229, 152–72 (2009). - PMC - PubMed
    1. Goodnow, C. C. Balancing immunity and tolerance: deleting and tuning lymphocyte repertoires. Proc. Natl Acad. Sci.93, 2264–2271 (1996). - PMC - PubMed

MeSH terms

Substances