. 2024 Oct;38(10):2115-2126.
doi: 10.1038/s41375-024-02367-8. Epub 2024 Aug 13.

Loss of Dnajc21 leads to cytopenia and altered nucleotide metabolism in zebrafish

Affiliations

Loss of Dnajc21 leads to cytopenia and altered nucleotide metabolism in zebrafish

Sarada Ketharnathan et al. Leukemia. 2024 Oct.

Abstract

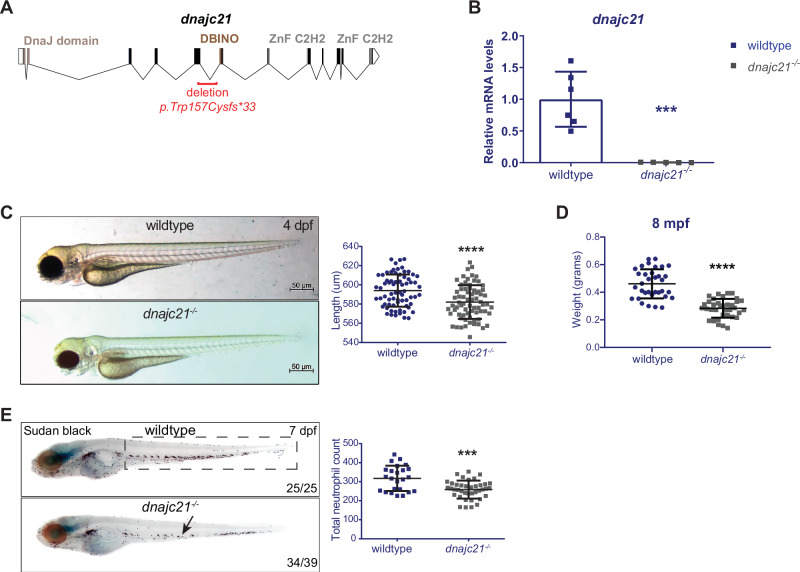
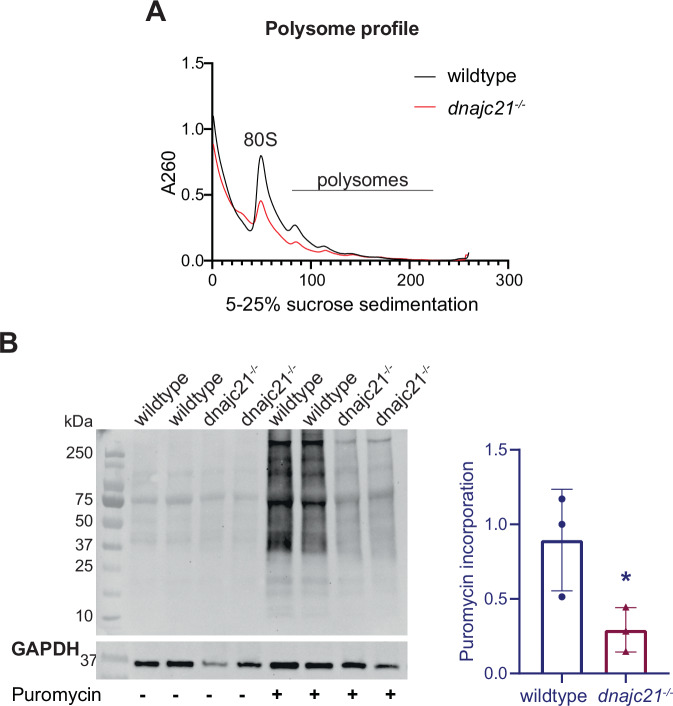
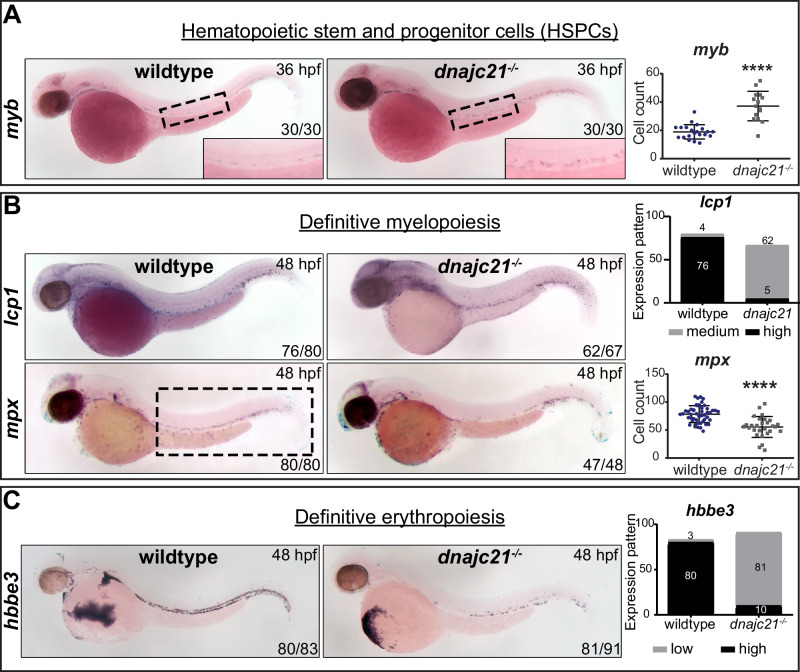
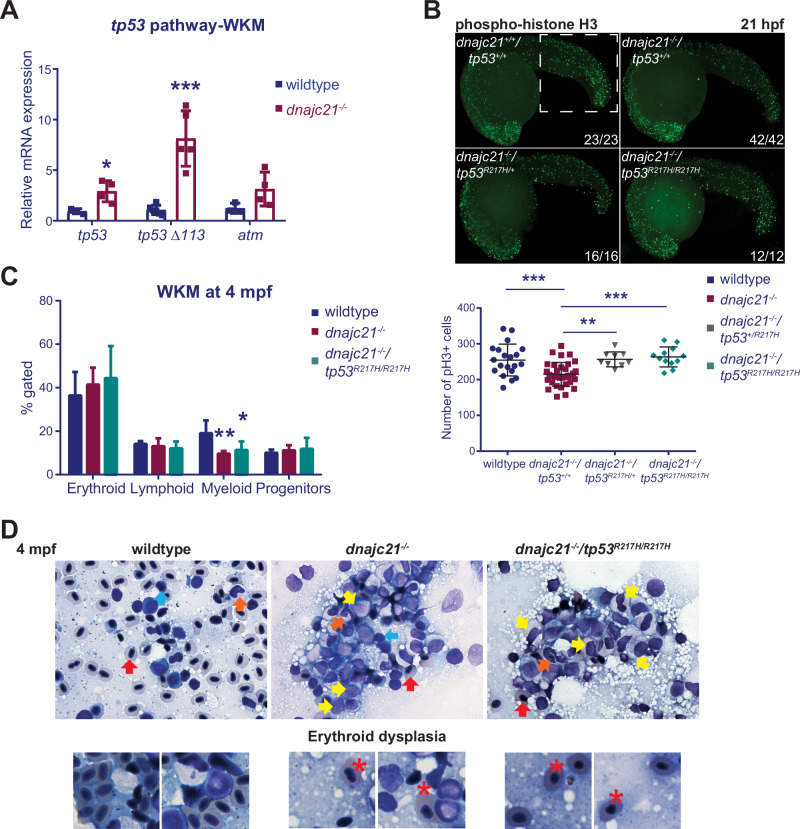
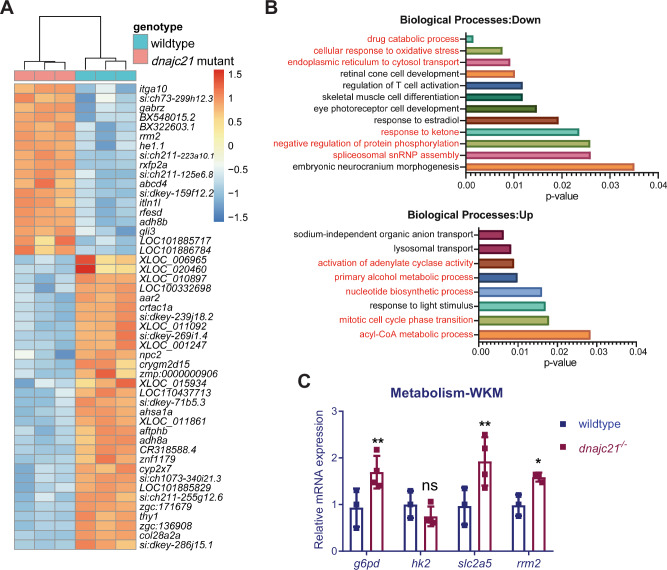
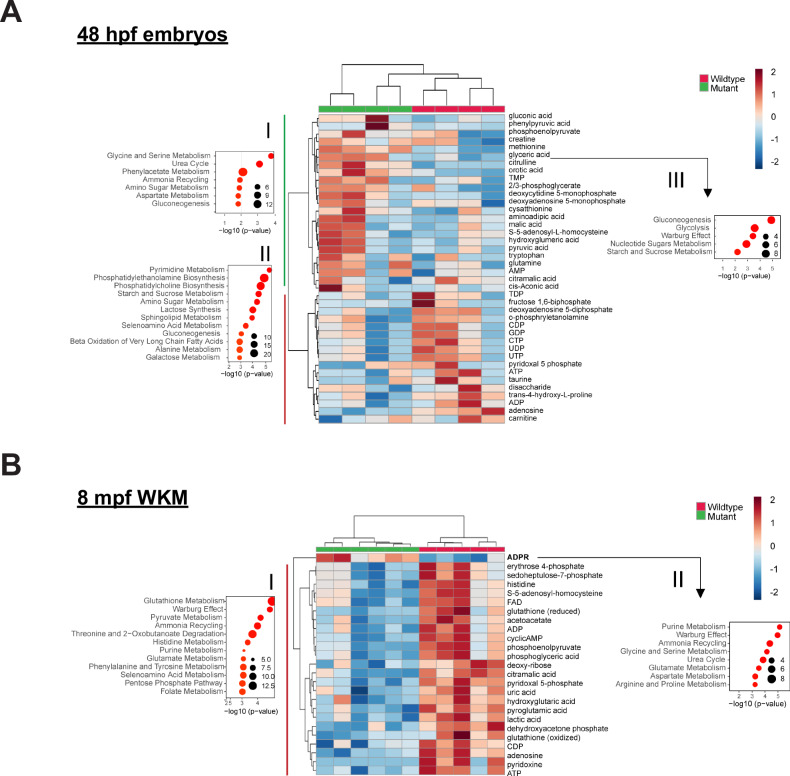
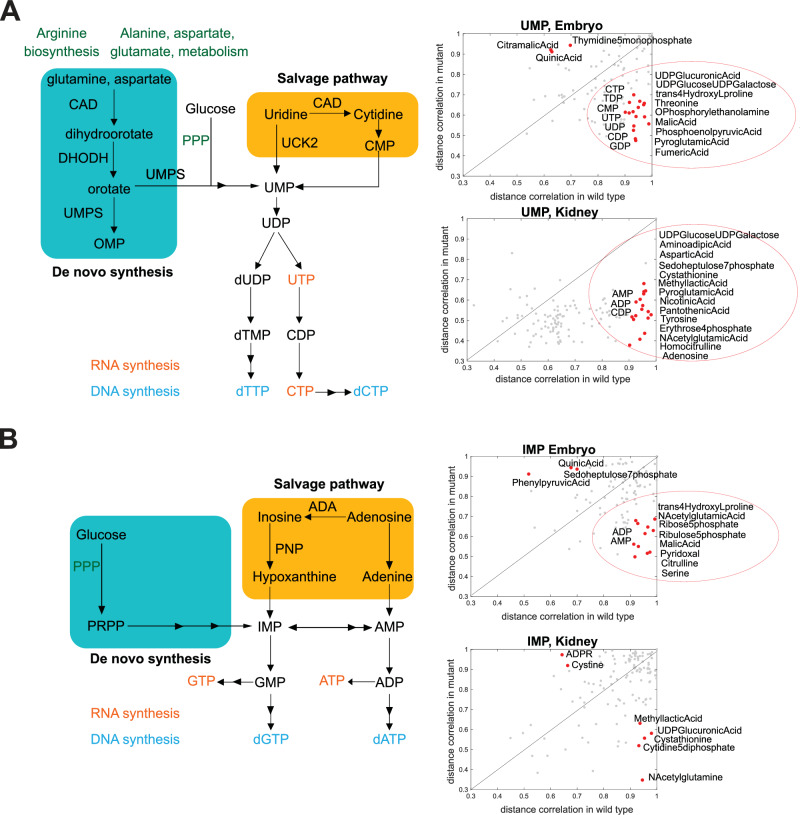
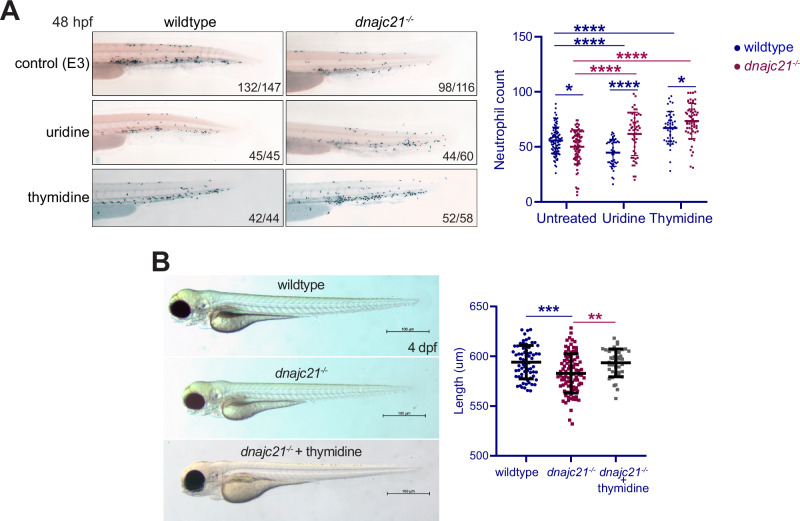
Mutations in the DNAJC21 gene were recently described in Shwachman-Diamond syndrome (SDS), a bone marrow failure syndrome with high predisposition for myeloid malignancies. To study the underlying biology in hematopoiesis regulation and disease, we generated the first in vivo model of Dnajc21 deficiency using the zebrafish. Zebrafish dnajc21 mutants phenocopy key SDS patient phenotypes such as cytopenia, reduced growth, and defective protein synthesis. We show that cytopenia results from impaired hematopoietic differentiation, accumulation of DNA damage, and reduced cell proliferation. The introduction of a biallelic tp53 mutation in the dnajc21 mutants leads to the development of myelodysplastic neoplasia-like features defined by abnormal erythroid morphology and expansion of hematopoietic progenitors. Using transcriptomic and metabolomic analyses, we uncover a novel role for Dnajc21 in nucleotide metabolism. Exogenous nucleoside supplementation restores neutrophil counts, revealing an association between nucleotide imbalance and neutrophil differentiation, suggesting a novel mechanism in dnajc21-mutant SDS biology.


Conflict of interest statement

JNB is on the advisory board of Oxford Immune Algorithmics.

Figures

Fig. 1
Fig. 1. dnajc21-mutant zebrafish exhibit reduced growth and neutropenia.
A Schematic of the zebrafish dnajc21 gene showing locations of the deletion and important functional domains. B qPCR analysis showing downregulation of dnajc21 mRNA in dnajc21−/− mutant embryos compared to wildtype at 48 hpf. Each datapoint represents RNA extracted from a pool of n = 30 larvae. b-actin and eef1a1l1 were used for normalization. C Brightfield lateral view images of dnajc21−/− mutant and wildtype larvae at 4 dpf. Graph shows quantification of larval length. Two biological replicates, each comprising 30–60 embryos per genotype, were analyzed. D Weight measurements of wildtype (n = 34) and dnajc21−/− (n = 36) fish at 8 mpf. E Lateral views of Sudan Black staining in dnajc21−/− mutant and wildtype larvae at 7 dpf. Arrow indicates reduced staining. Two biological replicates, each comprising 20 embryos per genotype, were analyzed. Numbers on the lower right indicate the number of larvae with the same phenotype. The black dotted box marks the region in the trunk used for counting. Number of neutrophils per embryo is quantified in the graph. hpf: hours post-fertilization; dpf: days post-fertilization; mpf: months post-fertilization ***p < 0.0001; ****p < 0.00001.
Fig. 2
Fig. 2. dnajc21 mutants show reduced global translation.
A Representative polysome profiles of wildtype and dnajc21−/− mutant embryos at 48 hpf. B Immunoblotting following puromycin incorporation into nascent proteins in wildtype and dnajc21−/− mutant embryos at 48 hpf. GAPDH was used as loading control. Intensity of puromycin signal relative to GAPDH was measured. hpf: hours post-fertilization. *p < 0.01.
Fig. 3
Fig. 3. Dnajc21 loss impairs myeloid and erythroid differentiation.
Brightfield images of whole mount in situ hybridization for (A) myb+ hematopoietic stem and progenitor cells at 36 hpf; the ventral wall of the dorsal aorta is outlined and shown at higher magnification. B lcp1+ total leukocytes and mpx+ neutrophils during definitive myelopoiesis at 48 hpf; and C hbbe3+ mature erythrocytes during definitive erythropoiesis at 48 hpf. Lateral views are shown with anterior to the left. Numbers on the lower right indicate the number of embryos with the same phenotype. Experiments were done in 2–4 biological replicates, each comprising at least 20 embryos per genotype. The black dotted box marks the region in the trunk used for counting mpx+ neutrophils. Graphs show quantification of cell counts or staining pattern per embryo. hpf: hours post-fertilization. ****p < 0.00001.
Fig. 4
Fig. 4. A gain-of-function tp53 mutation partially rescues neutropenia but leads to an expansion of immature progenitors.
A Levels of tp53, tp53 Δ113 isoform, and atm mRNA measured by qPCR in kidney marrows of wildtype and dnajc21−/− fish at 8 mpf. b-actin and eef1a1l1 were used for normalization. B dnajc21−/− mutants were crossed with tp53R217H/R217H to generate compound mutant dnajc21−/−/tp53R217H/R217H fish. Lateral views of pH3 immunofluorescence in wildtype, dnajc21−/−, dnajc21−/−/tp53R217H/+ and dnajc21−/−/tp53R217H/R217H mutant embryos at 21 hpf. Experiments were done in 2 biological replicates. Numbers on the lower right indicate the number of larvae with the same phenotype. The white dotted box marks the region used for counting. The number of pH3+ cells per embryo is quantified in the graph. C Flow cytometry of kidney marrows from wildtype (n = 5), dnajc21−/− (n = 5) and dnajc21−/−/tp53R217H/R217H (n = 3) fish at 4 mpf. Hematopoietic lineages were detected based on the forward and side scatter profiles. D Representative images from Giemsa staining of kidney marrow touch preparations from wildtype (n = 3), dnajc21−/− (n = 5), and dnajc21−/−/tp53R217H/R217H (n = 4) fish at 4 mpf. Arrows indicate mature erythrocytes (red), lymphocytes (blue), myelocytes (yellow), and mature neutrophils (orange). Red asterisks mark dysplastic erythrocytes. hpf: hours post-fertilization; mpf: months post-fertilization *p < 0.01; **p < 0.001; ***p < 0.0001.
Fig. 5
Fig. 5. RNA sequencing identifies various dysregulated metabolic pathways in dnajc21 mutants.
A Heatmap shows hierarchical clustering of the top 50 differentially expressed genes in dnajc21−/− mutant vs. wildtype embryos. RNA sequencing was performed on pools of 30 embryos at 48 hours post-fertilization. B Gene ontology enrichment analysis showing top downregulated and upregulated biological processes. Processes related to metabolism, protein homeostasis, and cell proliferation are highlighted in red font. C Validation of altered glucose and nucleotide metabolism genes by quantitative PCR in wildtype and dnajc21−/− whole kidney marrows (WKMs) at 8 months post-fertilization. b-actin and eef1a1l1 were used for normalization. *p < 0.01; **p < 0.001.
Fig. 6
Fig. 6. Nucleotide metabolism is altered in dnajc21 mutants.
Heatmaps show hierarchical clustering of selected set of altered metabolites in dnajc21−/− mutant vs. wildtype (A) embryos at 48 hpf and (B) whole kidney marrows (WKMs) at 8 mpf. Metabolites are selected based on t-test comparison. Pathway enrichment analysis is performed for subsets of metabolites showing higher concentration in (A.I) mutant embryos, (A.II) wildtype embryos, and (B.I) kidney samples. Analysis of pathway enrichment for correlation partners of the most significantly differentially concentrated metabolites in mutant and wildtype samples is shown in (A.III) for citrulline and orotic acid in mutant embryos and (B.II) ADPR for mutant kidney. Enrichment graphs show p-values on the x-axis and size of the bubble indicates the number of significantly altered metabolites for each pathway. FAD—flavin adenine dinucleotide; ADP—adenosine 5-diphosphate; cyclicAMP—adenosine 3-5-cyclic monophosphate; CDP—cytidine 5-diphosphate; CTP—cytidine 5-triphosphate; ATP—adenosine 5-triphosphate; AMP—adenosine 5-monophosphate; TMP—thimidine 5-monophosphate; DMP—deoxycytidine 5-monophosphate; ADPR—ADP-ribose. hpf: hours post-fertilization; mpf: months post-fertilization.
Fig. 7
Fig. 7. Distance correlation analysis shows major changes in pyrimidine and purine metabolism.
Schematic representations of de novo and salvage nucleotide biosynthesis are shown. Scatter plot graphs show distance correlations between (A) UMP or (B) IMP and all other metabolites measured. Correlation is calculated separately for wildtype and mutant fish. Separate analysis is done for embryo and kidney samples. Each point in the graph shows value in two groups of samples for a metabolite pair. Indicated in red and with metabolite names are correlations that show differences in wildtype and mutant animals (correlations that are very high, over 0.9 in one group of animals, and low, under 0.7 in the other group).
Fig. 8
Fig. 8. Exogenous nucleoside supplementation restores neutropenia in dnajc21 mutants.
A Lateral views of Sudan Black staining in wildtype and dnajc21−/− mutant embryos at 48 hpf following treatment with 100 mM uridine or 100 mM thymidine from 3 to 48 hpf. Experiments were done in two biological replicates, each comprising at least 20–30 embryos per condition. Numbers on the lower right indicate the number of larvae with the same phenotype. Number of neutrophils per embryo is quantified in the graph. B Brightfield lateral view images of wildtype and dnajc21−/− mutant larvae untreated or treated with 100 mM thymidine from 3 hpf to 4 dpf. Graph shows quantification of larval length. Two biological replicates, each comprising at least 20 embryos per genotype, were analyzed. hpf: hours post-fertilization; dpf: days post-fertilization. *p < 0.01; ***p < 0.0001; ****p < 0.00001.

Similar articles

References

    1. Farooqui SM, Ward R, Aziz M Shwachman–Diamond Syndrome. In: StatPearls. Treasure Island (FL): StatPearls Publishing; 2021. Available from: http://www.ncbi.nlm.nih.gov/books/NBK507866/. - PubMed
    1. Donadieu J, Leblanc T, Bader Meunier B, Barkaoui M, Fenneteau O, Bertrand Y, et al. Analysis of risk factors for myelodysplasias, leukemias and death from infection among patients with congenital neutropenia. Experience of the French Severe Chronic Neutropenia Study Group. Haematologica 2005;90:45–53. - PubMed
    1. Deschler B, Lübbert M. Acute myeloid leukemia: epidemiology and etiology. Acute Leukemias. 2008:47–56. - PubMed
    1. Cesaro S, Pillon M, Sauer M, Smiers F, Faraci M, de Heredia CD, et al. Long-term outcome after allogeneic hematopoietic stem cell transplantation for Shwachman–Diamond syndrome: a retrospective analysis and a review of the literature by the Severe Aplastic Anemia Working Party of the European Society for Blood and Marrow Transplantation (SAAWP-EBMT). Bone Marrow Transpl. 2020;55:1796–809. - PubMed
    1. Myers KC, Furutani E, Weller E, Siegele B, Galvin A, Arsenault V, et al. Clinical features and outcomes of patients with Shwachman–Diamond syndrome and myelodysplastic syndrome or acute myeloid leukaemia: a multicentre, retrospective, cohort study. Lancet Haematol. 2020;7:e238–46. - PMC - PubMed