

Review
doi: 10.1038/s41698-024-00671-1.
The current landscape of spatial biomarkers for prediction of response to immune checkpoint inhibition
Affiliations
- PMID: 39138341
- PMCID: PMC11322473
- DOI: 10.1038/s41698-024-00671-1
Item in Clipboard
Review
The current landscape of spatial biomarkers for prediction of response to immune checkpoint inhibition
NPJ Precis Oncol.
.
Abstract
Enabling the examination of cell-cell relationships in tissue, spatially resolved omics technologies have revolutionised our perspectives on cancer biology. Clinically, the development of immune checkpoint inhibitors (ICI) has advanced cancer therapeutics. However, a major challenge of effective implementation is the identification of predictive biomarkers of response. In this review we examine the potential added predictive value of spatial biomarkers of response to ICI beyond current clinical benchmarks.
© 2024. The Author(s).
Conflict of interest statement
The authors declare no competing interests.
Figures

a Co-detection by imaging (CODEX/formerly Phenocycler) (Image-based, IB). Following labelling using an antibody cocktail conjugated with unique DNA barcodes a cyclical process of tissue imaging and reporter probe removal. Image co-registration of cycles enables downstream image analysis. b
Immunofluorescence (Cyclic (CycIF), multiple iterative labelling by antibody neodeposition (MILAN) (IB): Iterative cycles of antibody incubation, CycIF: groups of 3 antibodies labelled with different fluorescent dyes for antibody incubation. MILAN: unconjugated primary antibodies followed by fluorescent labelled secondary antibodies, target imaging and removal. Images from each visualisation cycle are co-registered, and downstream image analysis is applied. c
Multiplex immunofluorescence (mIF) (IB): Iterative process of single antibody incubation, fluorescent visualisation with tyramide signal amplification and antibody removal. One imaging step acquires all fluorescent channels to visualise antibodies in the one tissue section to which downstream image analysis is applied. d
Immunohistochemistry (IHC) (IB): Visualisation of a single protein target, can also be performed for the co-visualisation of multiple targets. Primary antibody binding, secondary antibody conjugated to a chromogenic detection molecule, e.g., horseradish peroxidase (HRP) and visualisation through conversion of a chromogenic substrate, e.g., 3, 3’-diaminobenzidine (DAB) by HRP into a coloured signal to be visualised under a light microscope or brightfield scanner. e
Imaging mass cytometry (IMC) (IB): Following labelling with a cocktail of metal-tagged antibodies, labelled tissue undergoes laser ablation which vaporises the tissue (with bound metal-tagged antibodies) in sequential small spots. The ionised tissue is put through a mass cytometer, which detects and quantifies the metal isotopes and correlates them to specific antibodies. The intensity of each ablated spot is collated for each metal isotope and the spatial information on each spot is used to reconstruct images for downstream image analysis. f
Digital Spatial Profiler (DSP) (Sequencing-based): Applicable for the detection of RNA or protein molecules. For protein detection: following incubation with a cocktail of barcoded antibodies, fluorescently tagged primary antibodies are applied to aid region of interest (ROI) selection. For each ROI UV cleavage and aspiration of the antibody barcodes will proceed. Each aspirate from a unique ROI will be deposited into a 96-well plate for transcript counting via nCounter or NGS.

a
Target interaction and co-expression: The co-localisation of a target expression can be used to infer target interaction. This is achieved through the generation of masks per target of interest. Images with the corresponding masks are co-registered and regions of mask overlap are determined as interaction of targets. A similar approach can be utilised to assess target co-expression. For this, normally, cells are segmented from digital images and assessed for the co-expression of the target of interest. Once identified, the frequency or spatial organisation of co-expressing or interacting cells/targets can be further quantified. b
Cell–cell distance calculation: The calculation of cell-cell distances involves the assignment of a reference cell phenotype (cell A) upon which distances are calculated to a second cell phenotype (Cell B). This is performed for each individual cell of the reference phenotype, and distance calculations are averaged to provide a reflection of the overall spatial distribution of cell B to cell A. c
Nearest neighbour distances: This approach quantifies the distance between a reference Cell A and its nearest neighbouring cell. This calculation can be performed iteratively for each cell of interest, and distances averaged to provide a global overview of the proximity of neighbouring cells to a specific reference cell of interest. d
Radius-based cell quantitation: For radius-based cell quantitation a reference cell A is defined upon which cell numbers and cell phenotypes within a radius of varying size are quantified.

a Toki et al.: High PD-L1 and CD8 counts in macrophage compartment associated with CR/PR, prolonged PFS and OS. b Lu et al.: High protein counts of B2M, CD19 and CD8A, and higher immune neighbour number associated with response. High protein counts of beta-catenin are associated with no response. c Antoranz et al.: High density of PD-L1+ macrophages close to tumour edge (within 30 µm) and close to cytotoxic T-cells (within 10 µm) associated with improved response. d Kim et al.: High density of PD-L1+ macrophages, M1 and activated M1 macrophages close to tumour cells (within 15 µm) associated with response. e Attrill et al.: Shorter distance of CD39+ memory T-cells to tumour cells in recurrence-free patients. f Johnson et al.: High PD-L1/PD-1 interaction score and/or high IDO1/HLADR+ co-expressing cells associated with highest likelihood of response. g Martinez-Morilla et al.: High B2M protein expression associated with better overall survival.
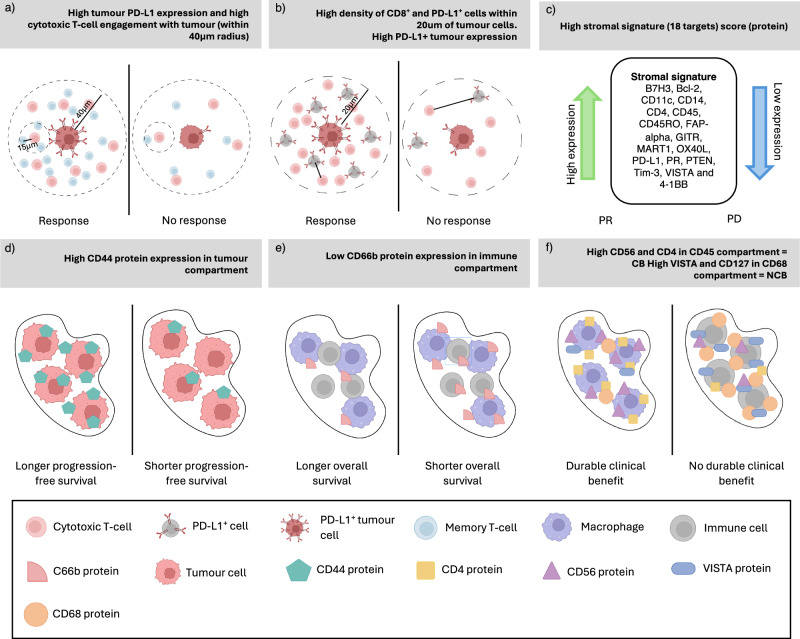
a Ghiringhelli et al.: High Immunoscore-IC score (CD8+ free of PD-L1+ cells, CD8 clusters, CD8 density and proximity of CD8 and PD-L1+ cells) associated with response. b Qin et al.: A higher percentage of helper T-cells engaged with cytotoxic T-cells (within 15 µm) and more engagement of cytotoxic T-cells with tumour cells (within 40 µm) in responders. c Song et al.: High stromal signature comprised of 18 proteins including PD-L1 associated with response, longer median OS. d Moutafi et al.: High CD44 expression in tumour compartment associated with longer PFS. e Moutafi et al.: Low CD66b expression in immune stroma compartment associated with longer OS. f Zugazogoitia et al.: High CD56 and CD4 in CD45 compartment associated with durable clinical benefit. High VISTA and CD127 in the CD68 compartment are associated with no durable clinical benefit.
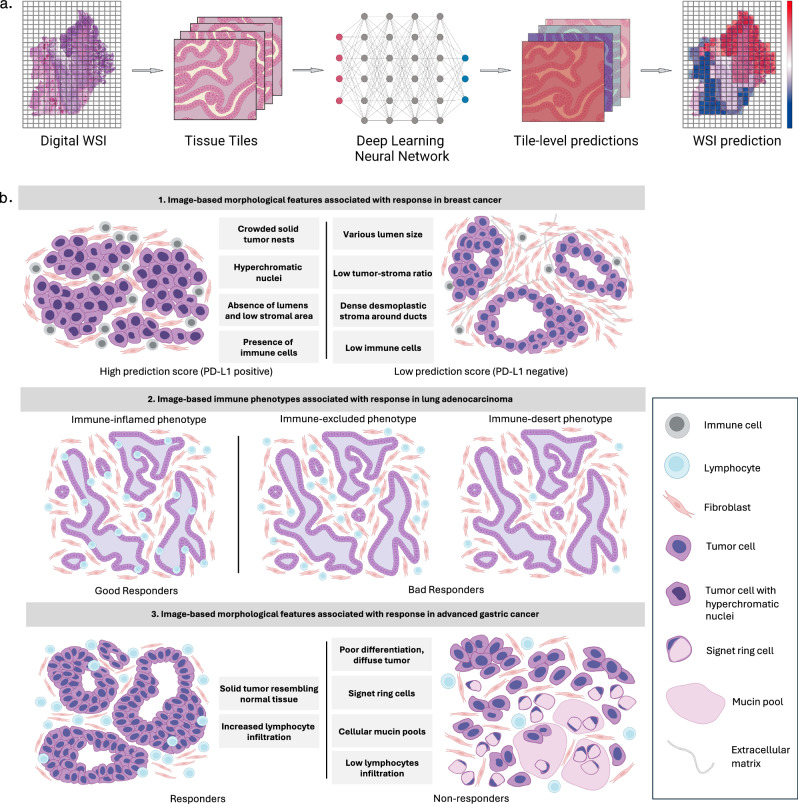
a Workflow of deep learning predictions applied to histopathology whole slide images (WSIs). Tiles of predefined size are extracted from the digital WSI and fed into the pretrained deep learning model, resulting in tile-level predictions. Tiles are stitched back together to reconstruct the WSI and tile-level predictions are aggregated to generate a WSI-level prediction. Results can be visualised by overlaying a tile-based heatmap over the WSI. b Image-based derived morphological features associated with response to immune checkpoint inhibitors (ICI). Three studies used heatmaps to identify morphological features associated with response to ICI. 1. In breast cancer (Shamai et al.), crowded solid tumour nests, hyperchromatic nuclei, absence of lumen, low stromal area and presence of immune cells were found in predicted PD-L1 positive patients, while negative patients were associated with the presence of various lumen size, low tumour to stroma ration, dense desmoplastic stroma around ducts and low immune cells presence. 2. In lung adenocarcinomas (Park et al.), the presence of intra-epithelial lymphocytes (immune-inflamed) was found in responders, while non-responders were found to have various number of lymphocytes in the stroma (immune-excluded or immune-desert). 3. Advanced gastric cancer (Liu et al.) responders showed solid tumours resembling normal tissue with increased lymphocyte infiltration whereas non-responders showed diffuse and poorly differentiated tumours with the presence of signet ring cells, cellular mucin pools and low lymphocyte infiltration.
References
Publication types
Grants and funding
LinkOut - more resources
Full Text Sources
