. 2024 Oct;16(10):1592-1604.
doi: 10.1038/s41557-024-01601-1. Epub 2024 Aug 13.

Multi-tiered chemical proteomic maps of tryptoline acrylamide-protein interactions in cancer cells

Affiliations

Multi-tiered chemical proteomic maps of tryptoline acrylamide-protein interactions in cancer cells

Evert Njomen et al. Nat Chem. 2024 Oct.

Abstract

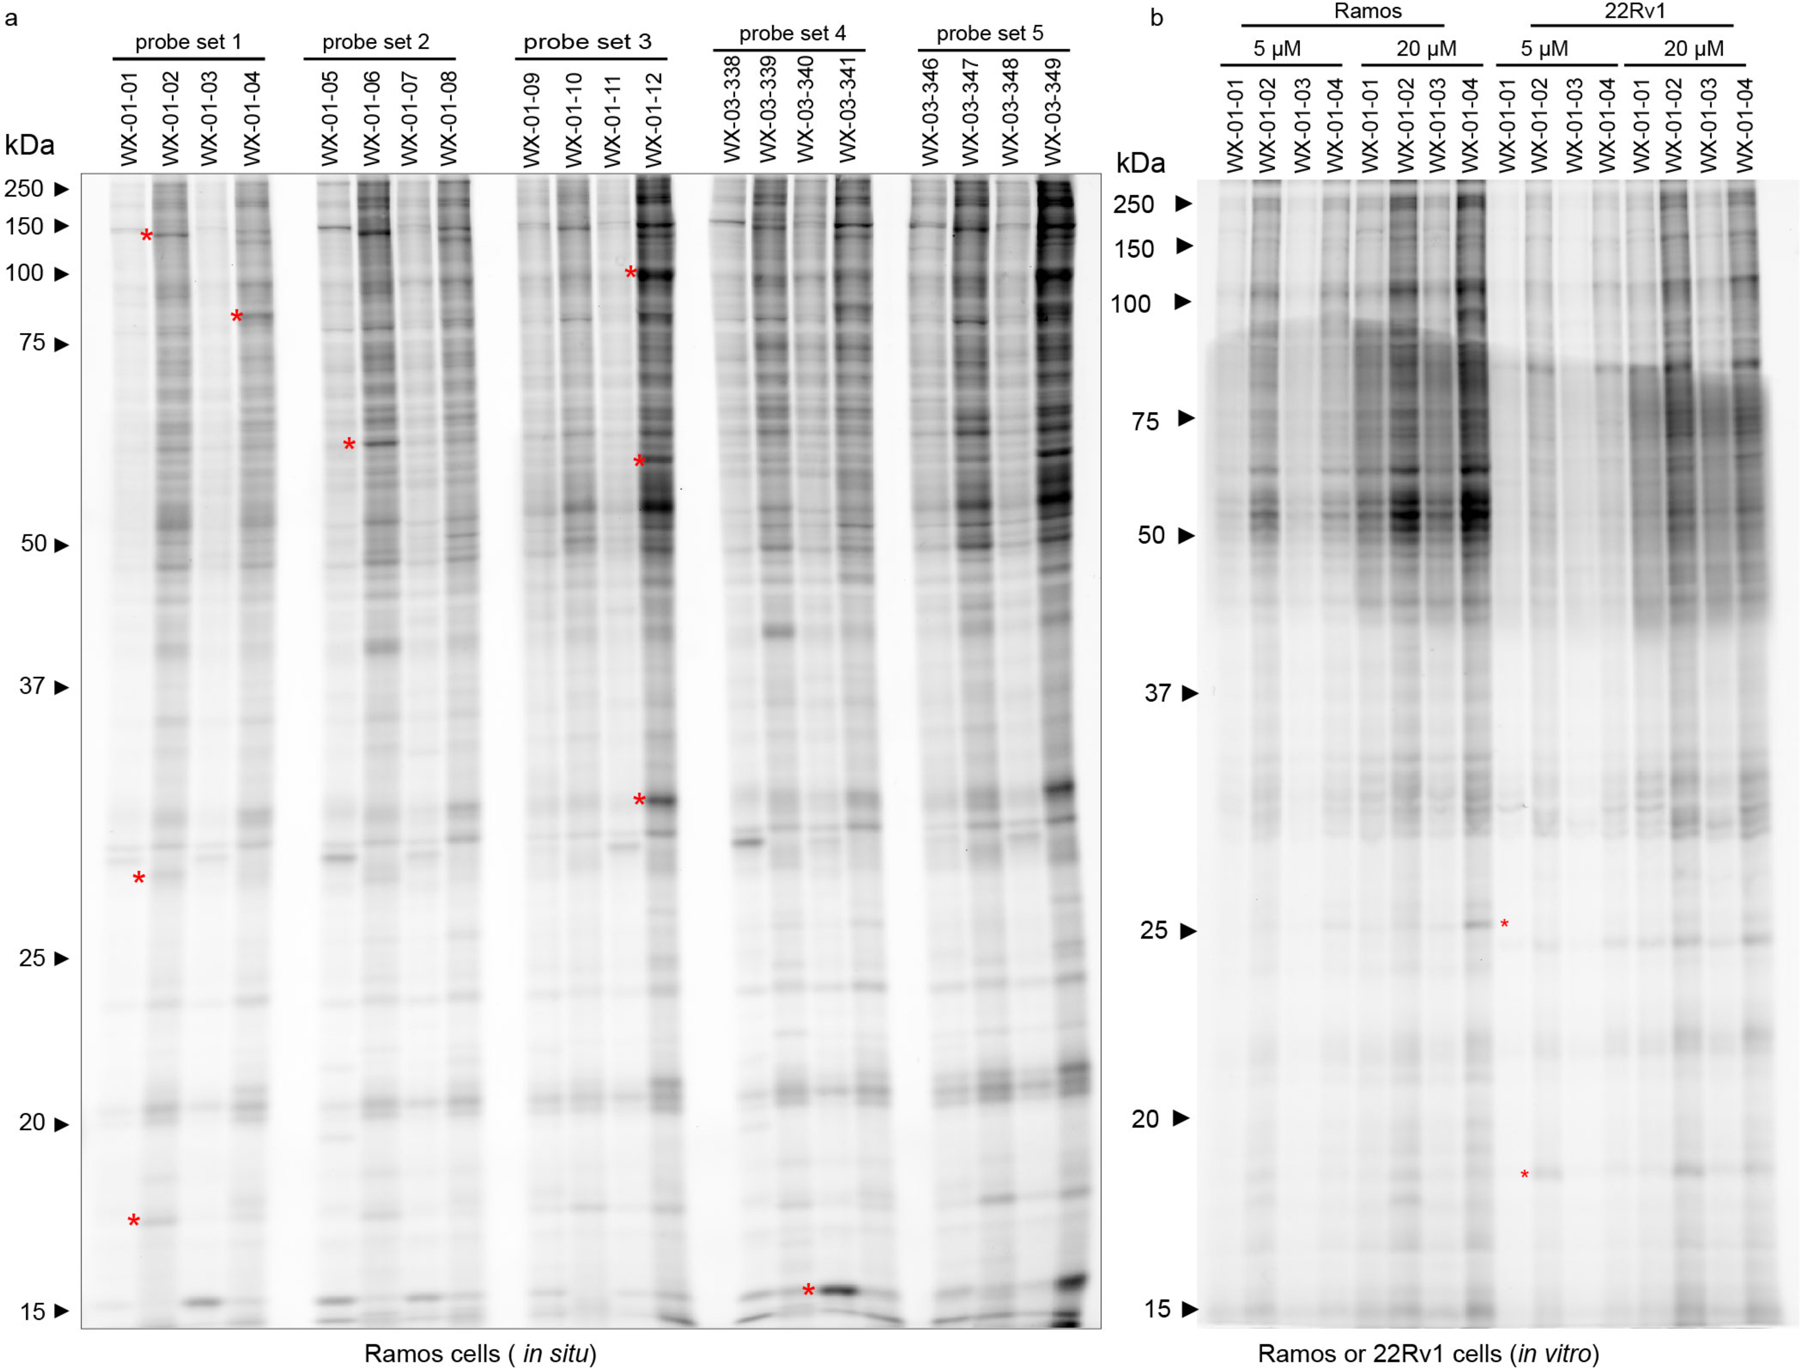
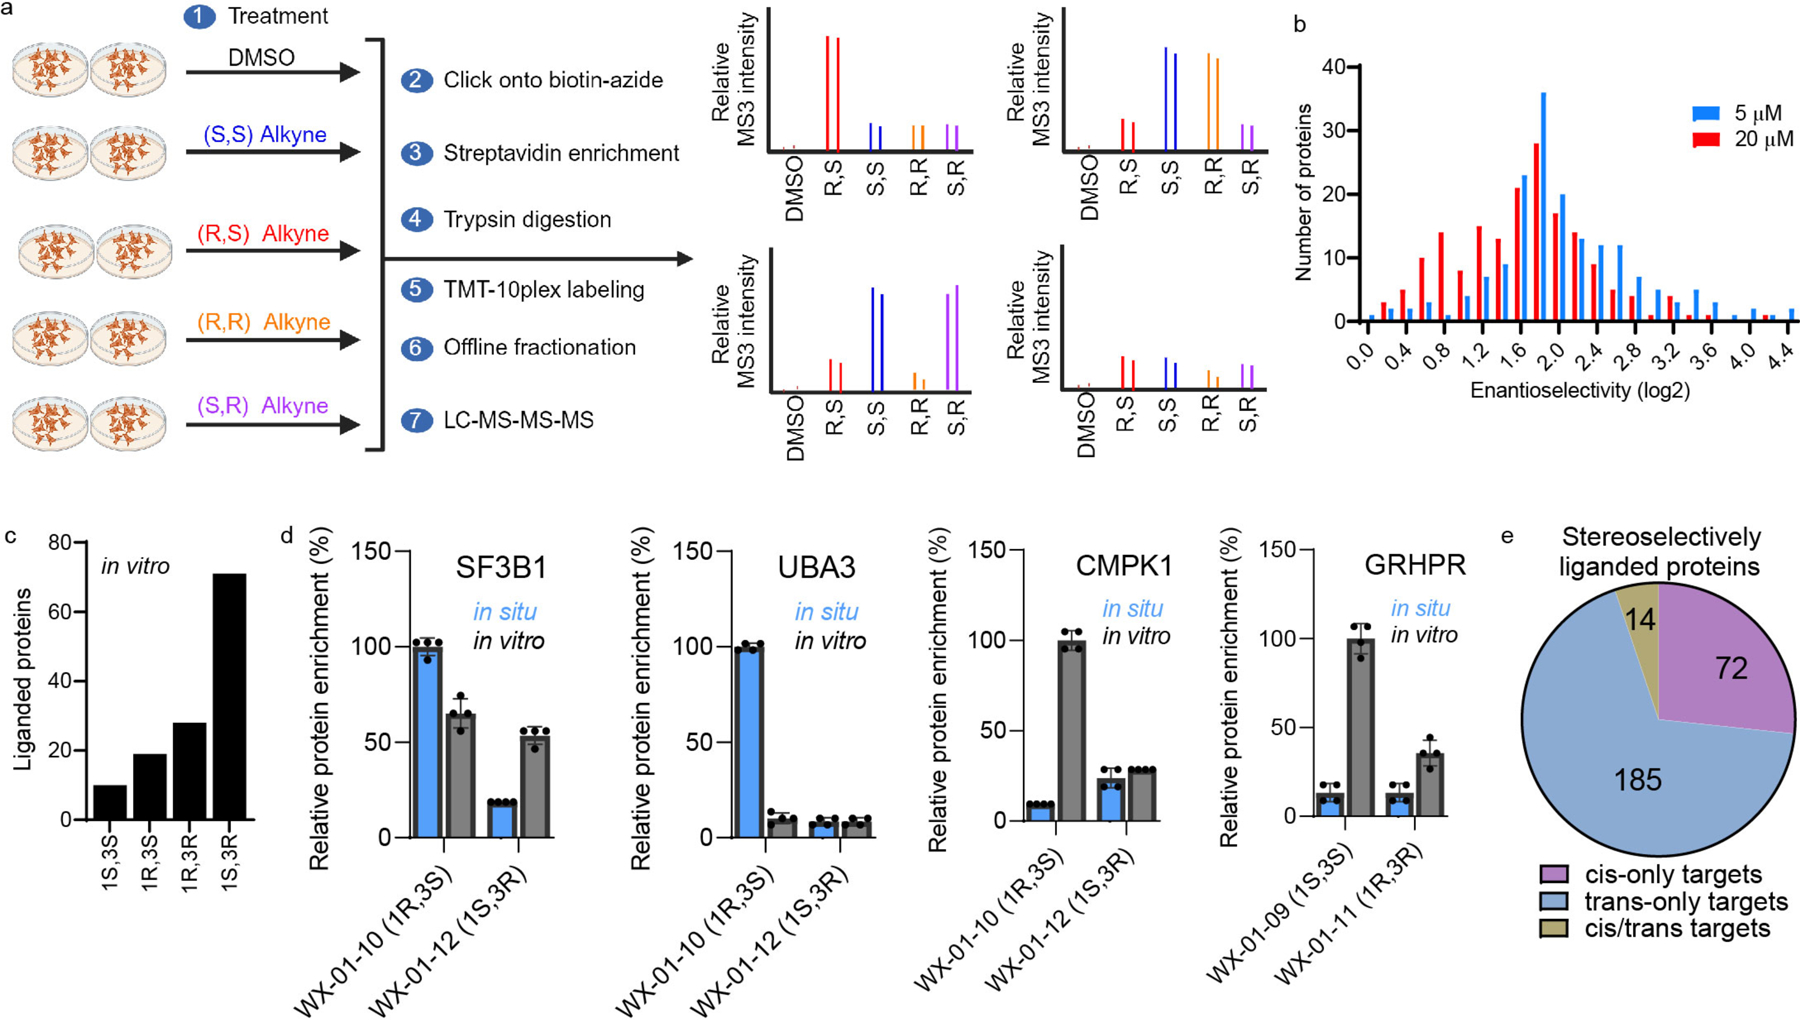
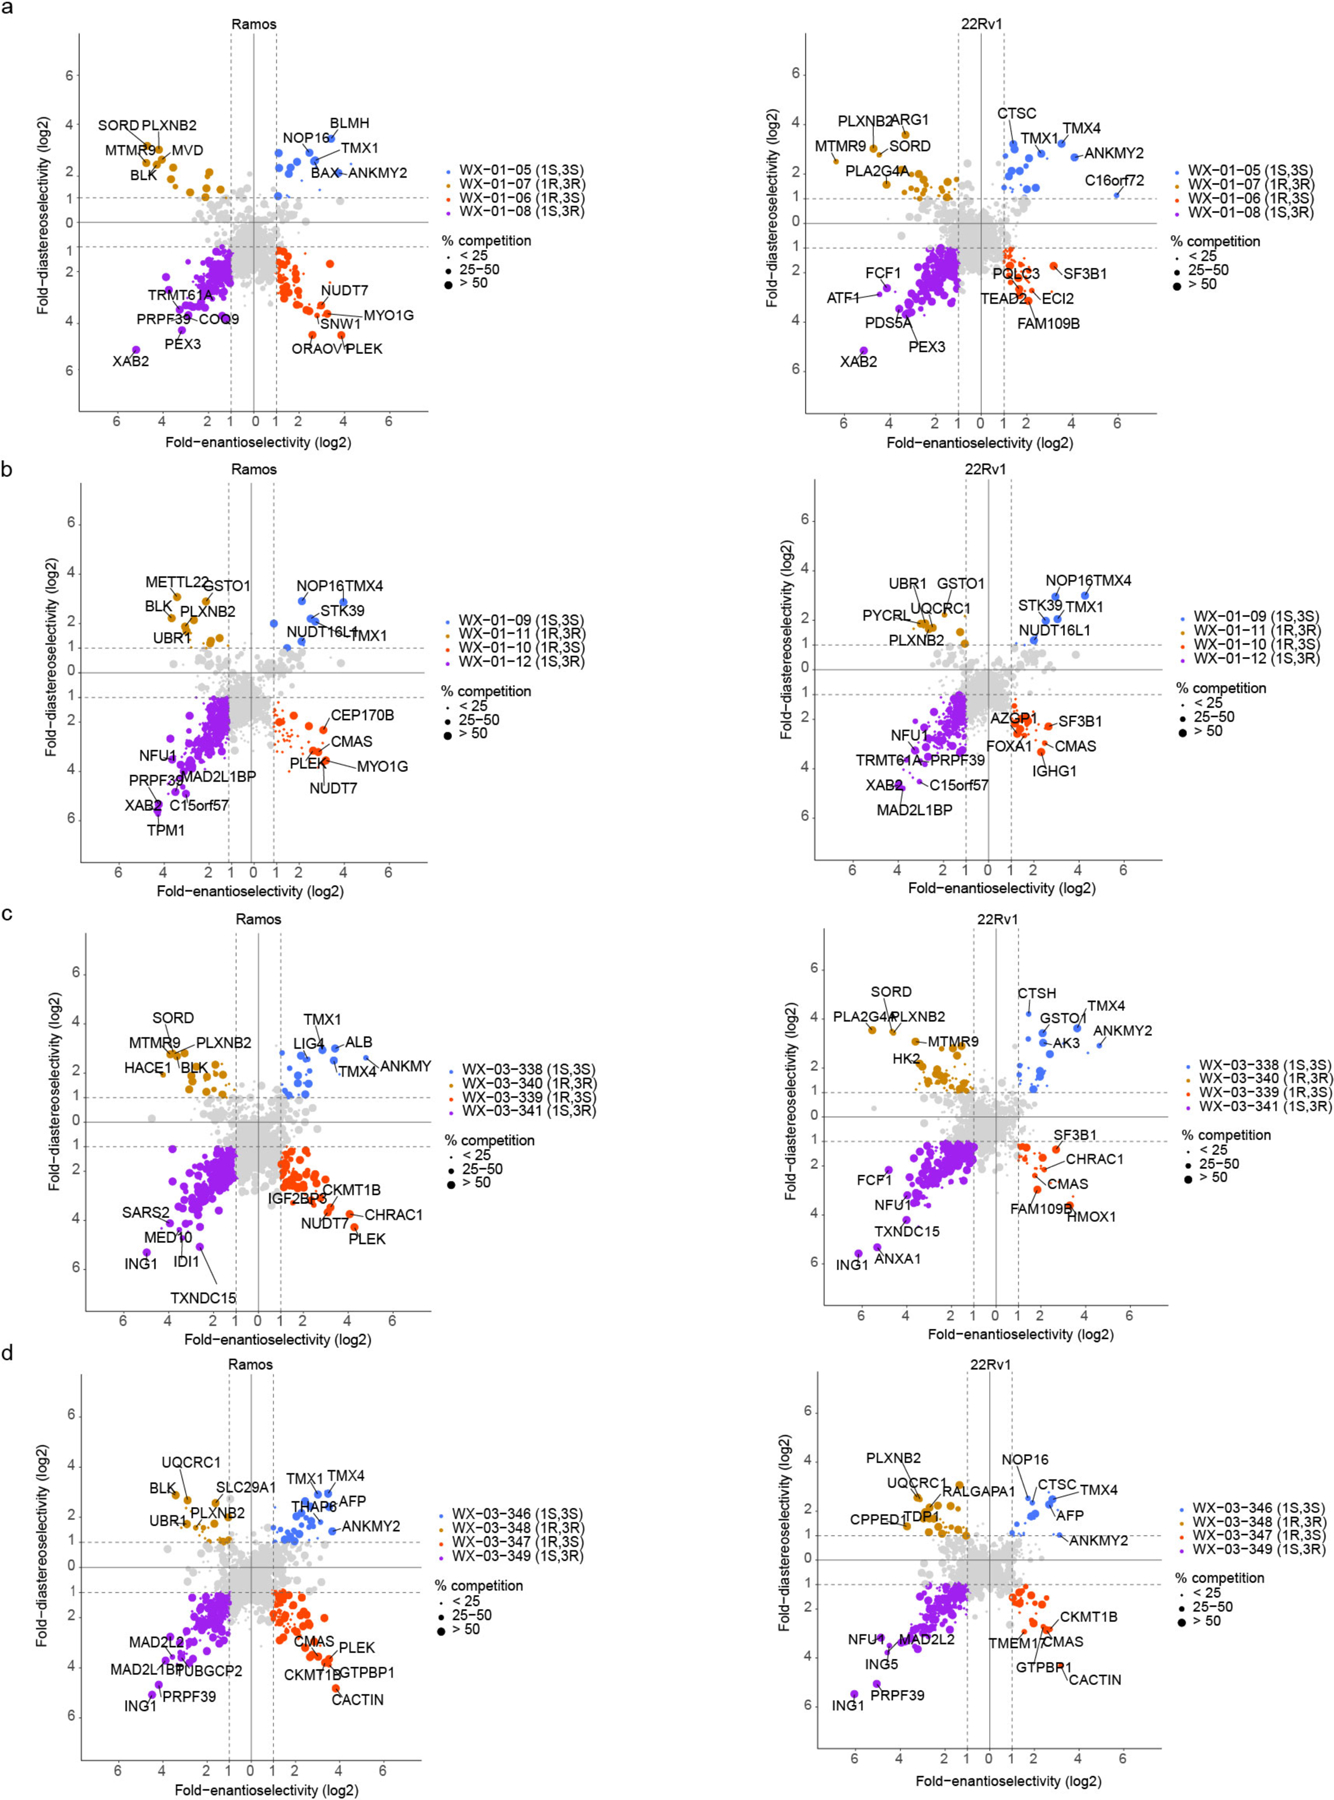
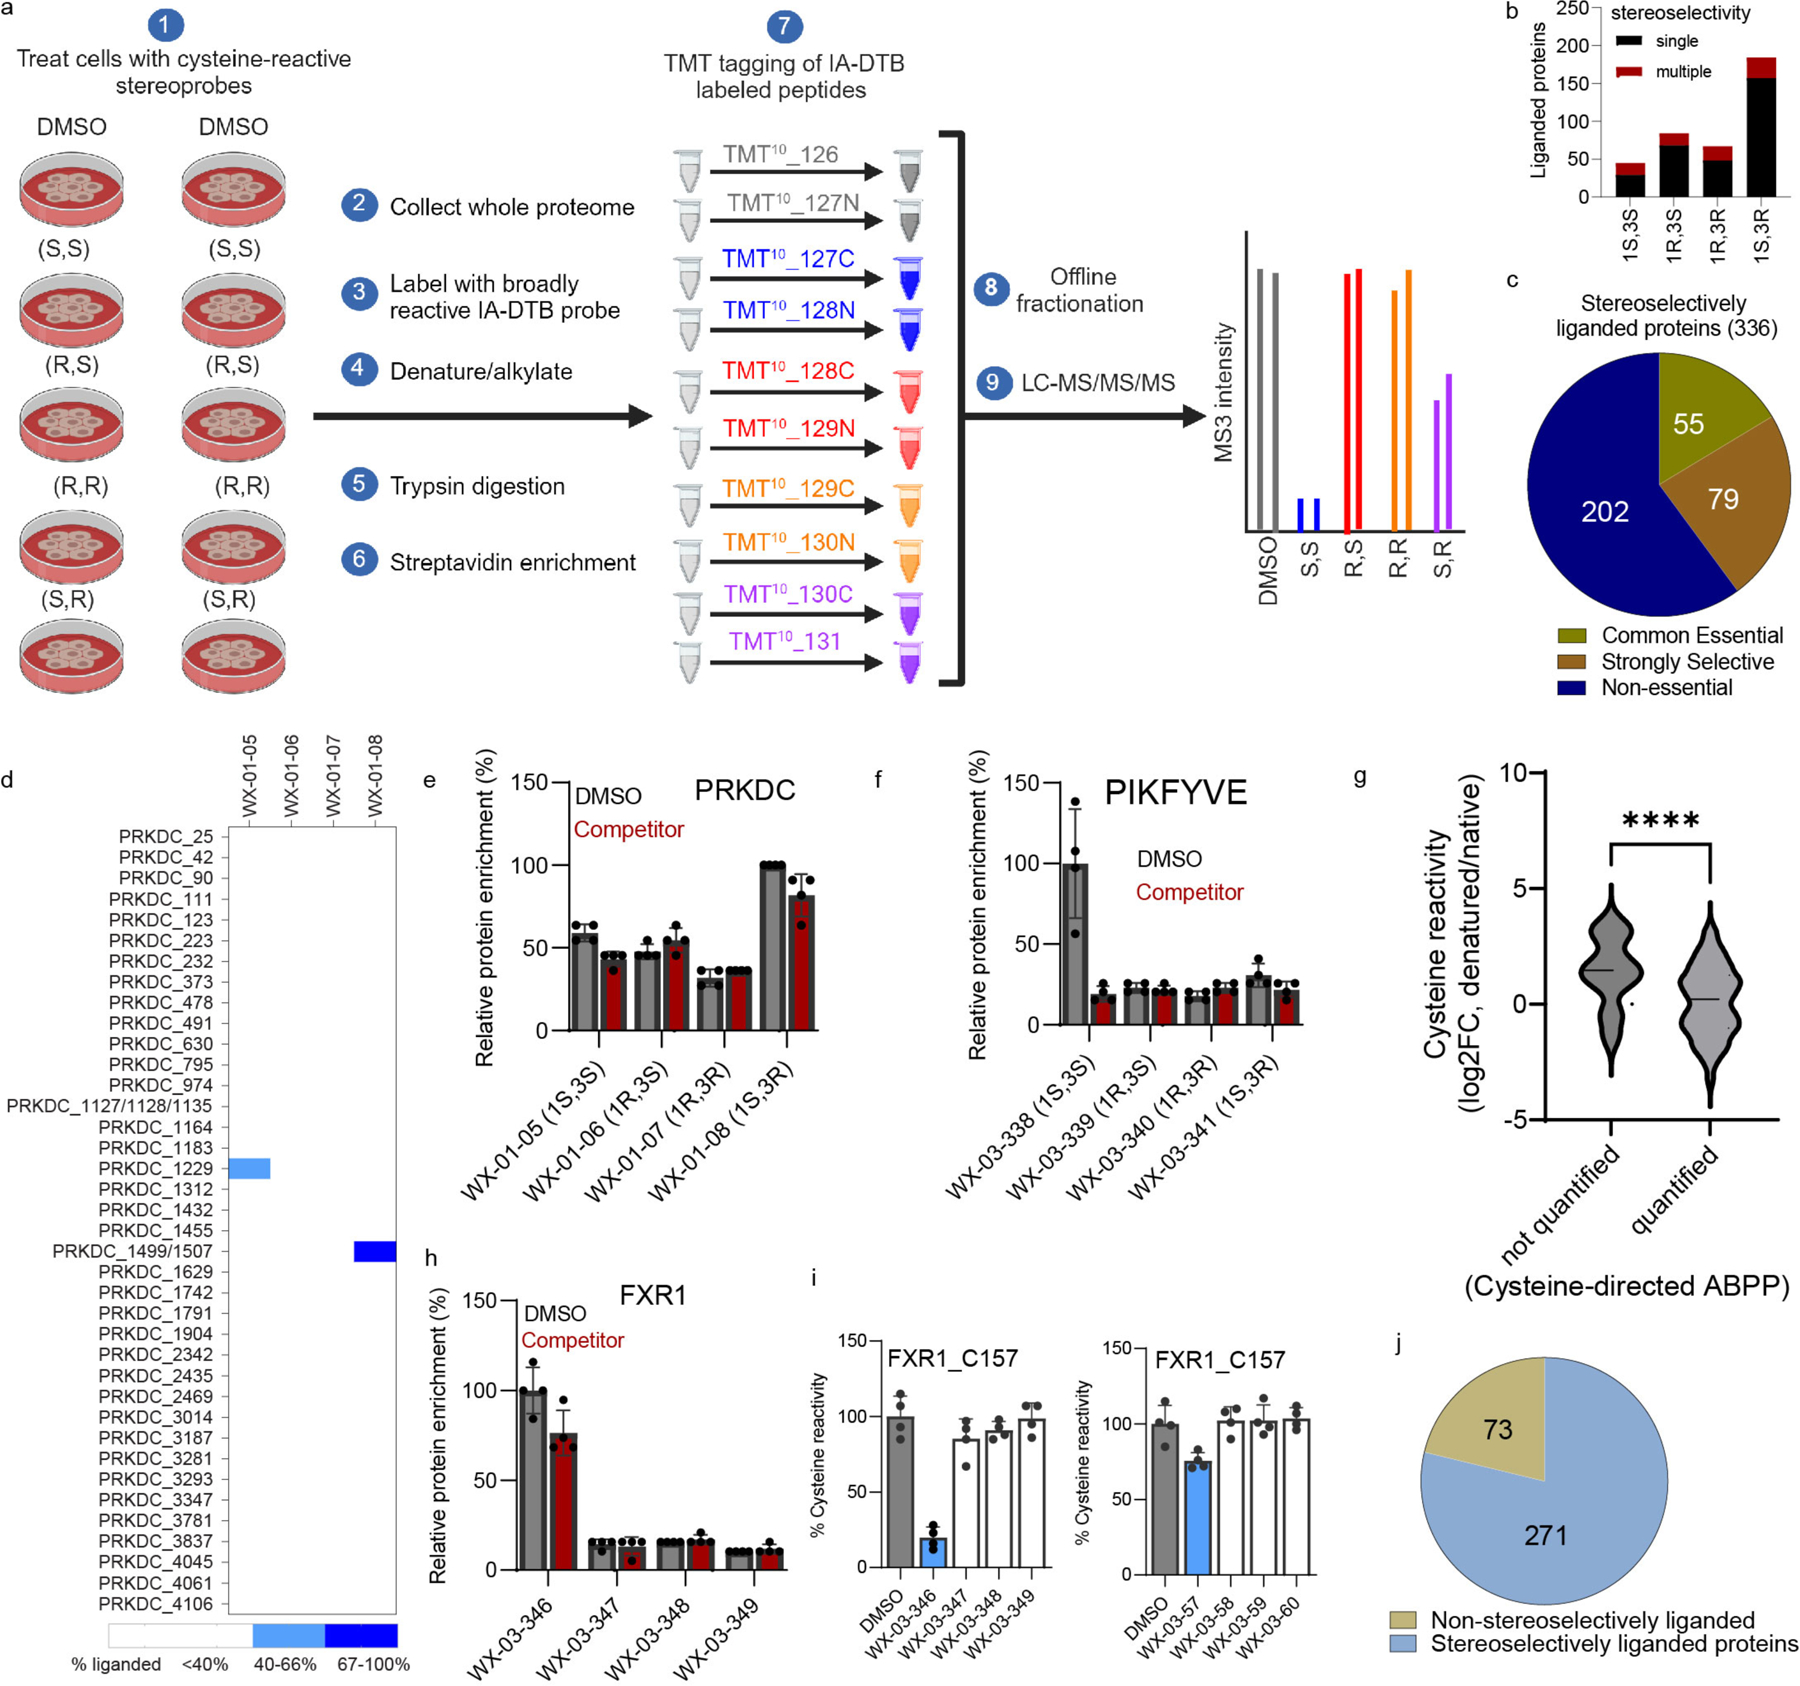
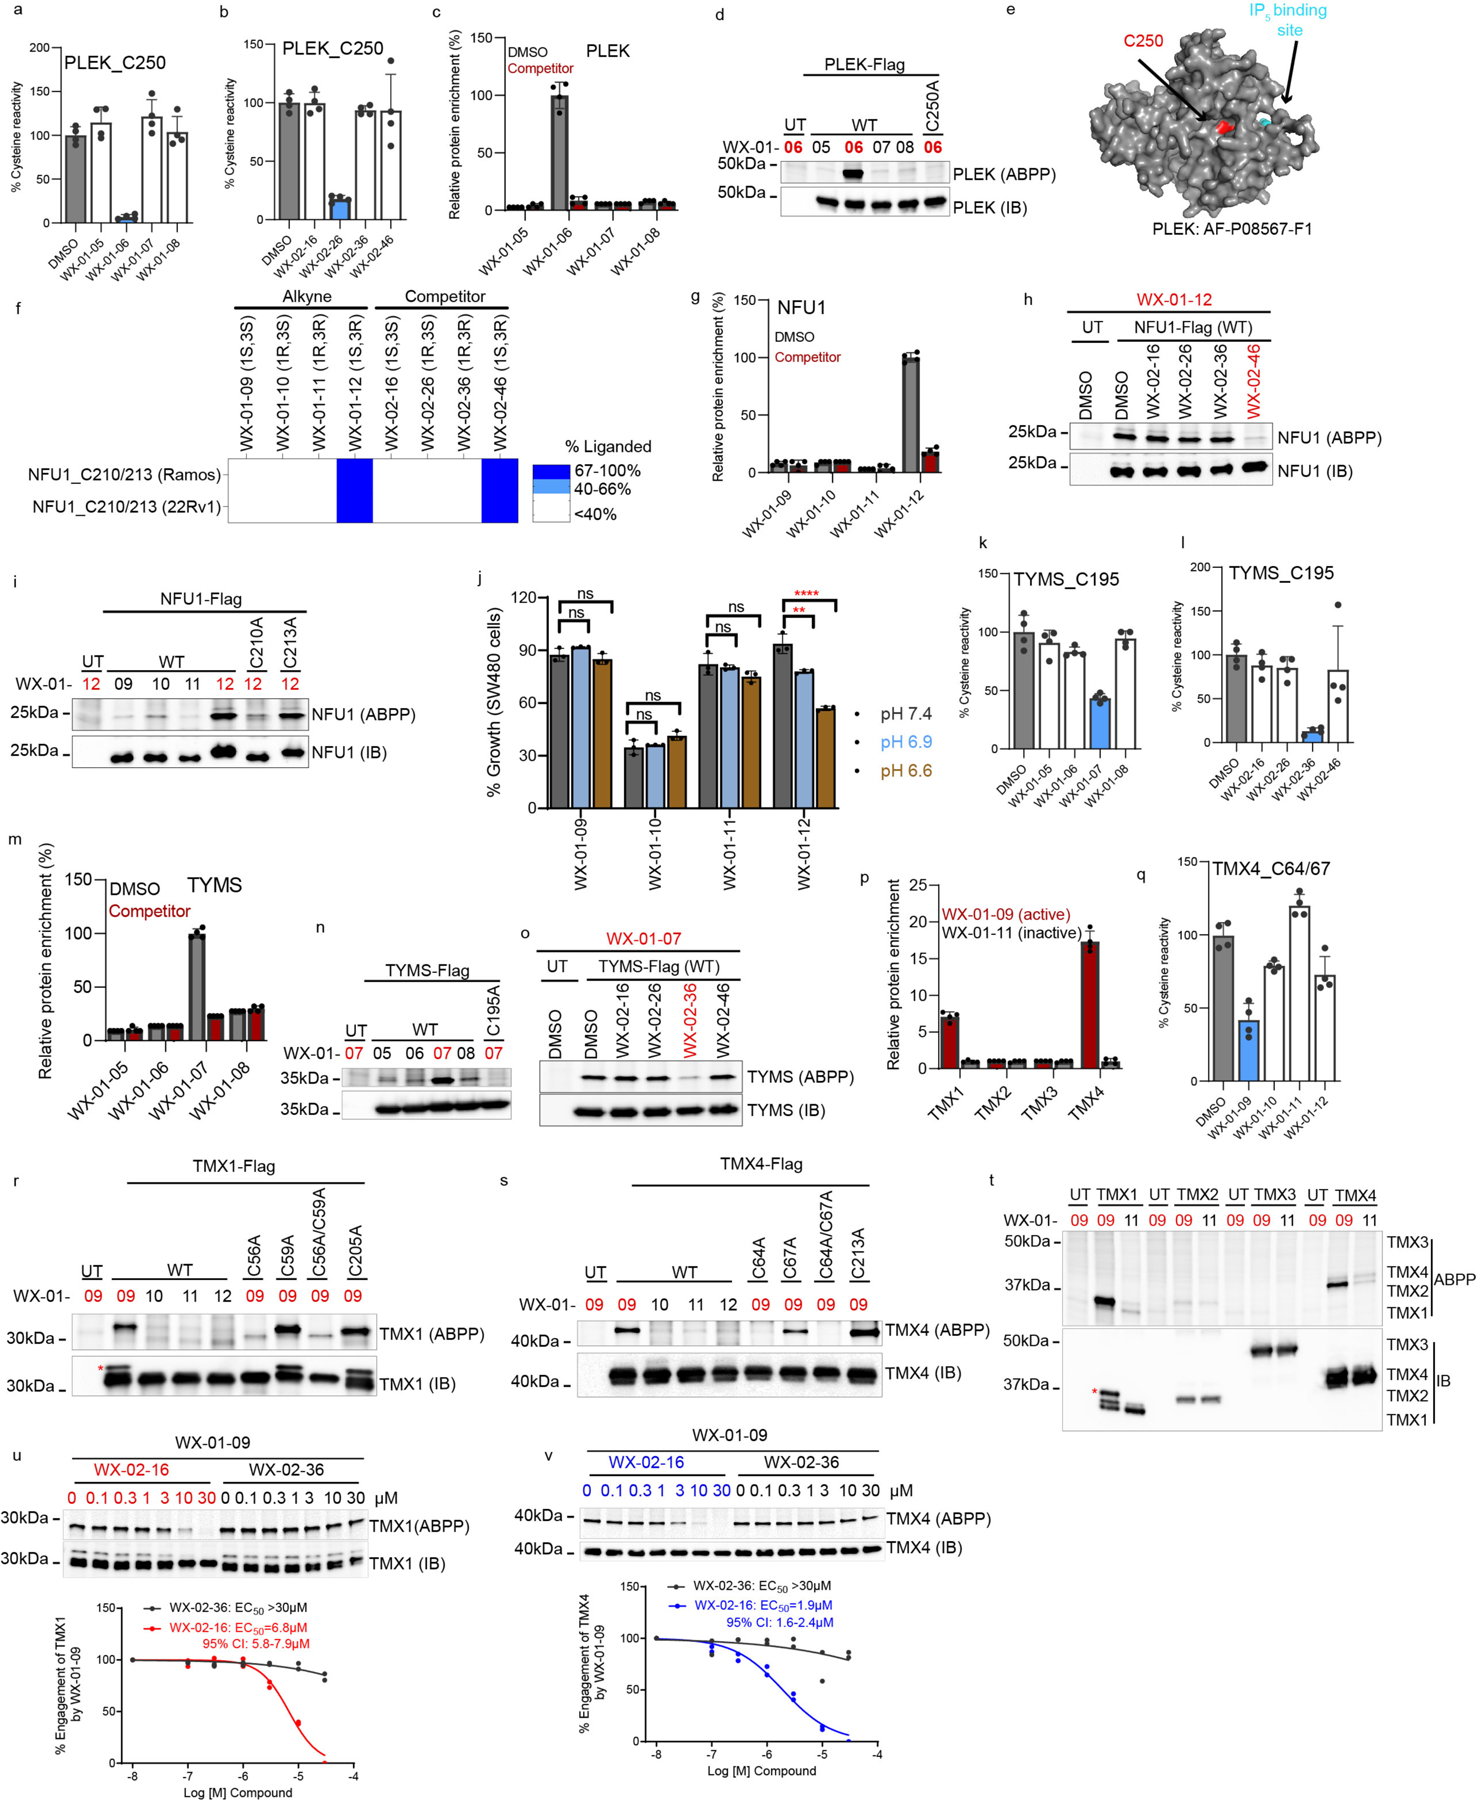
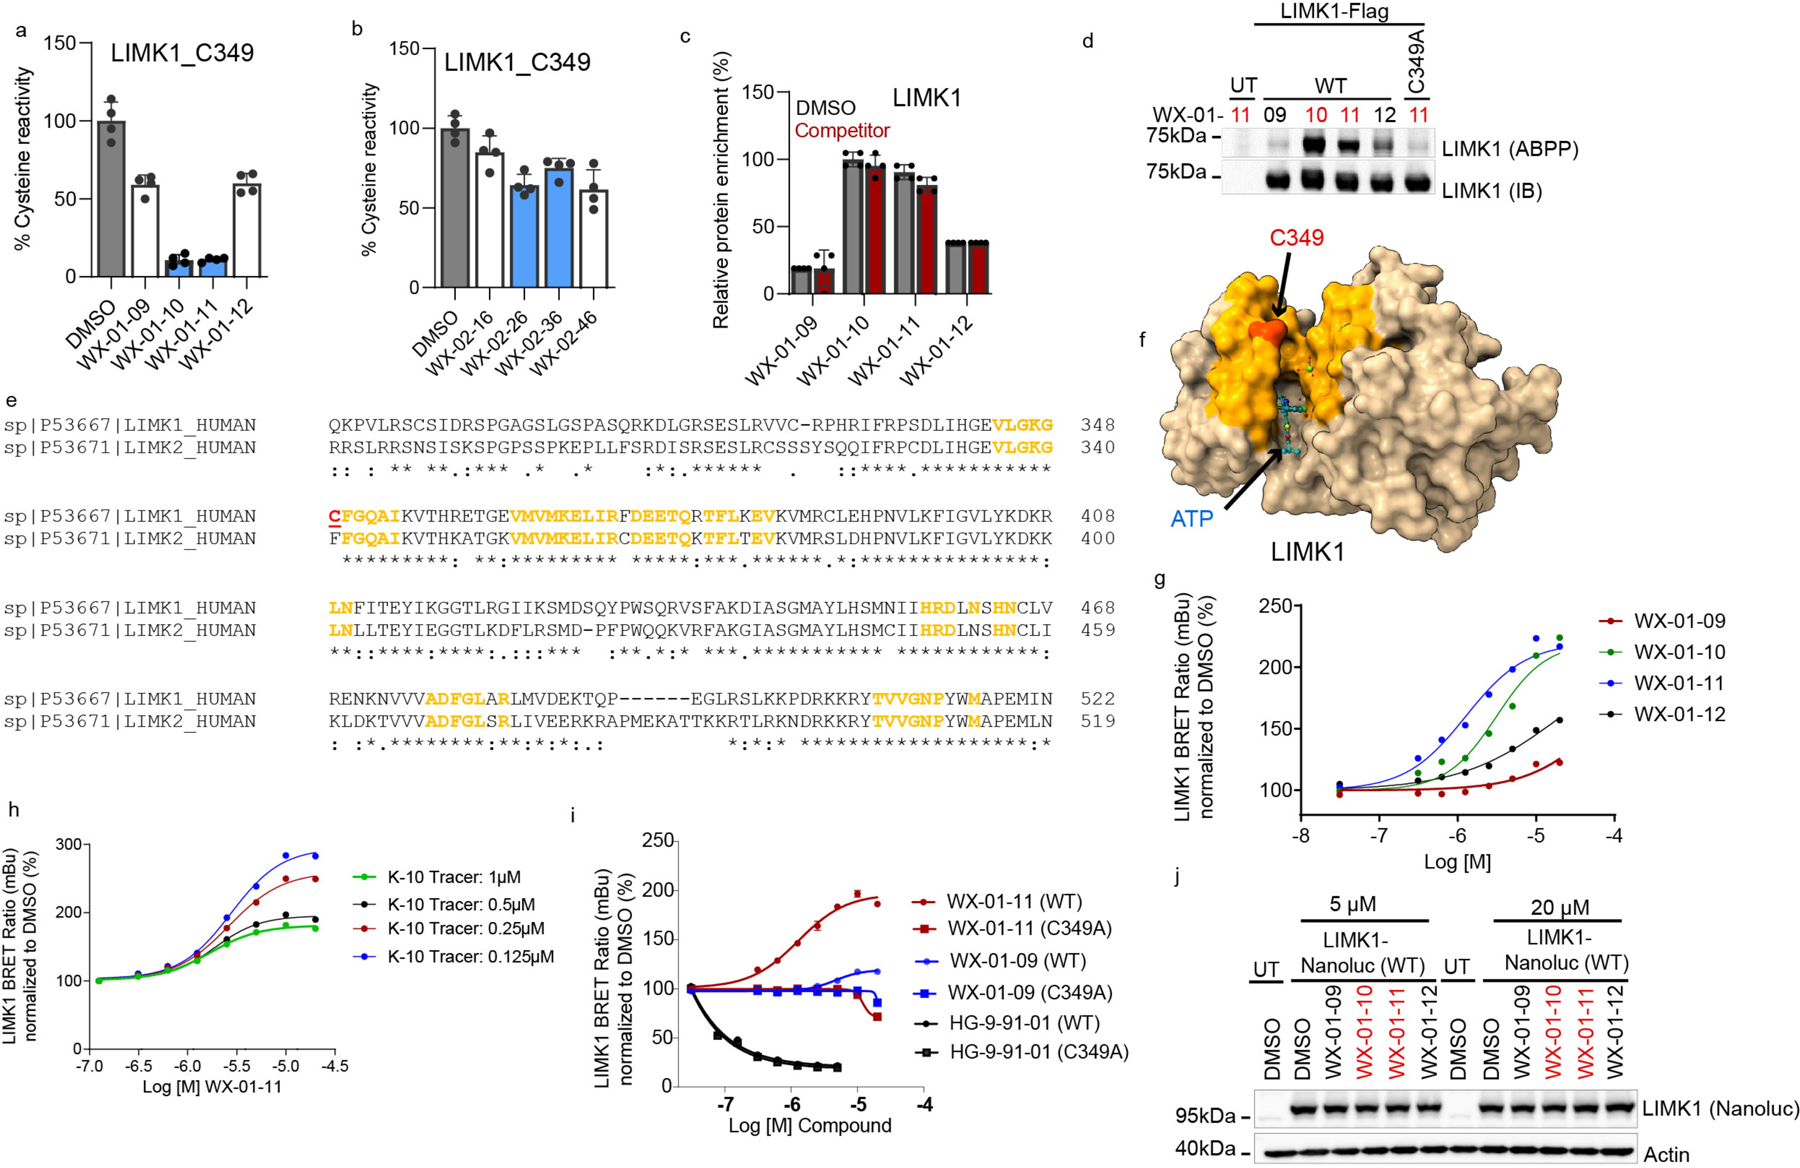
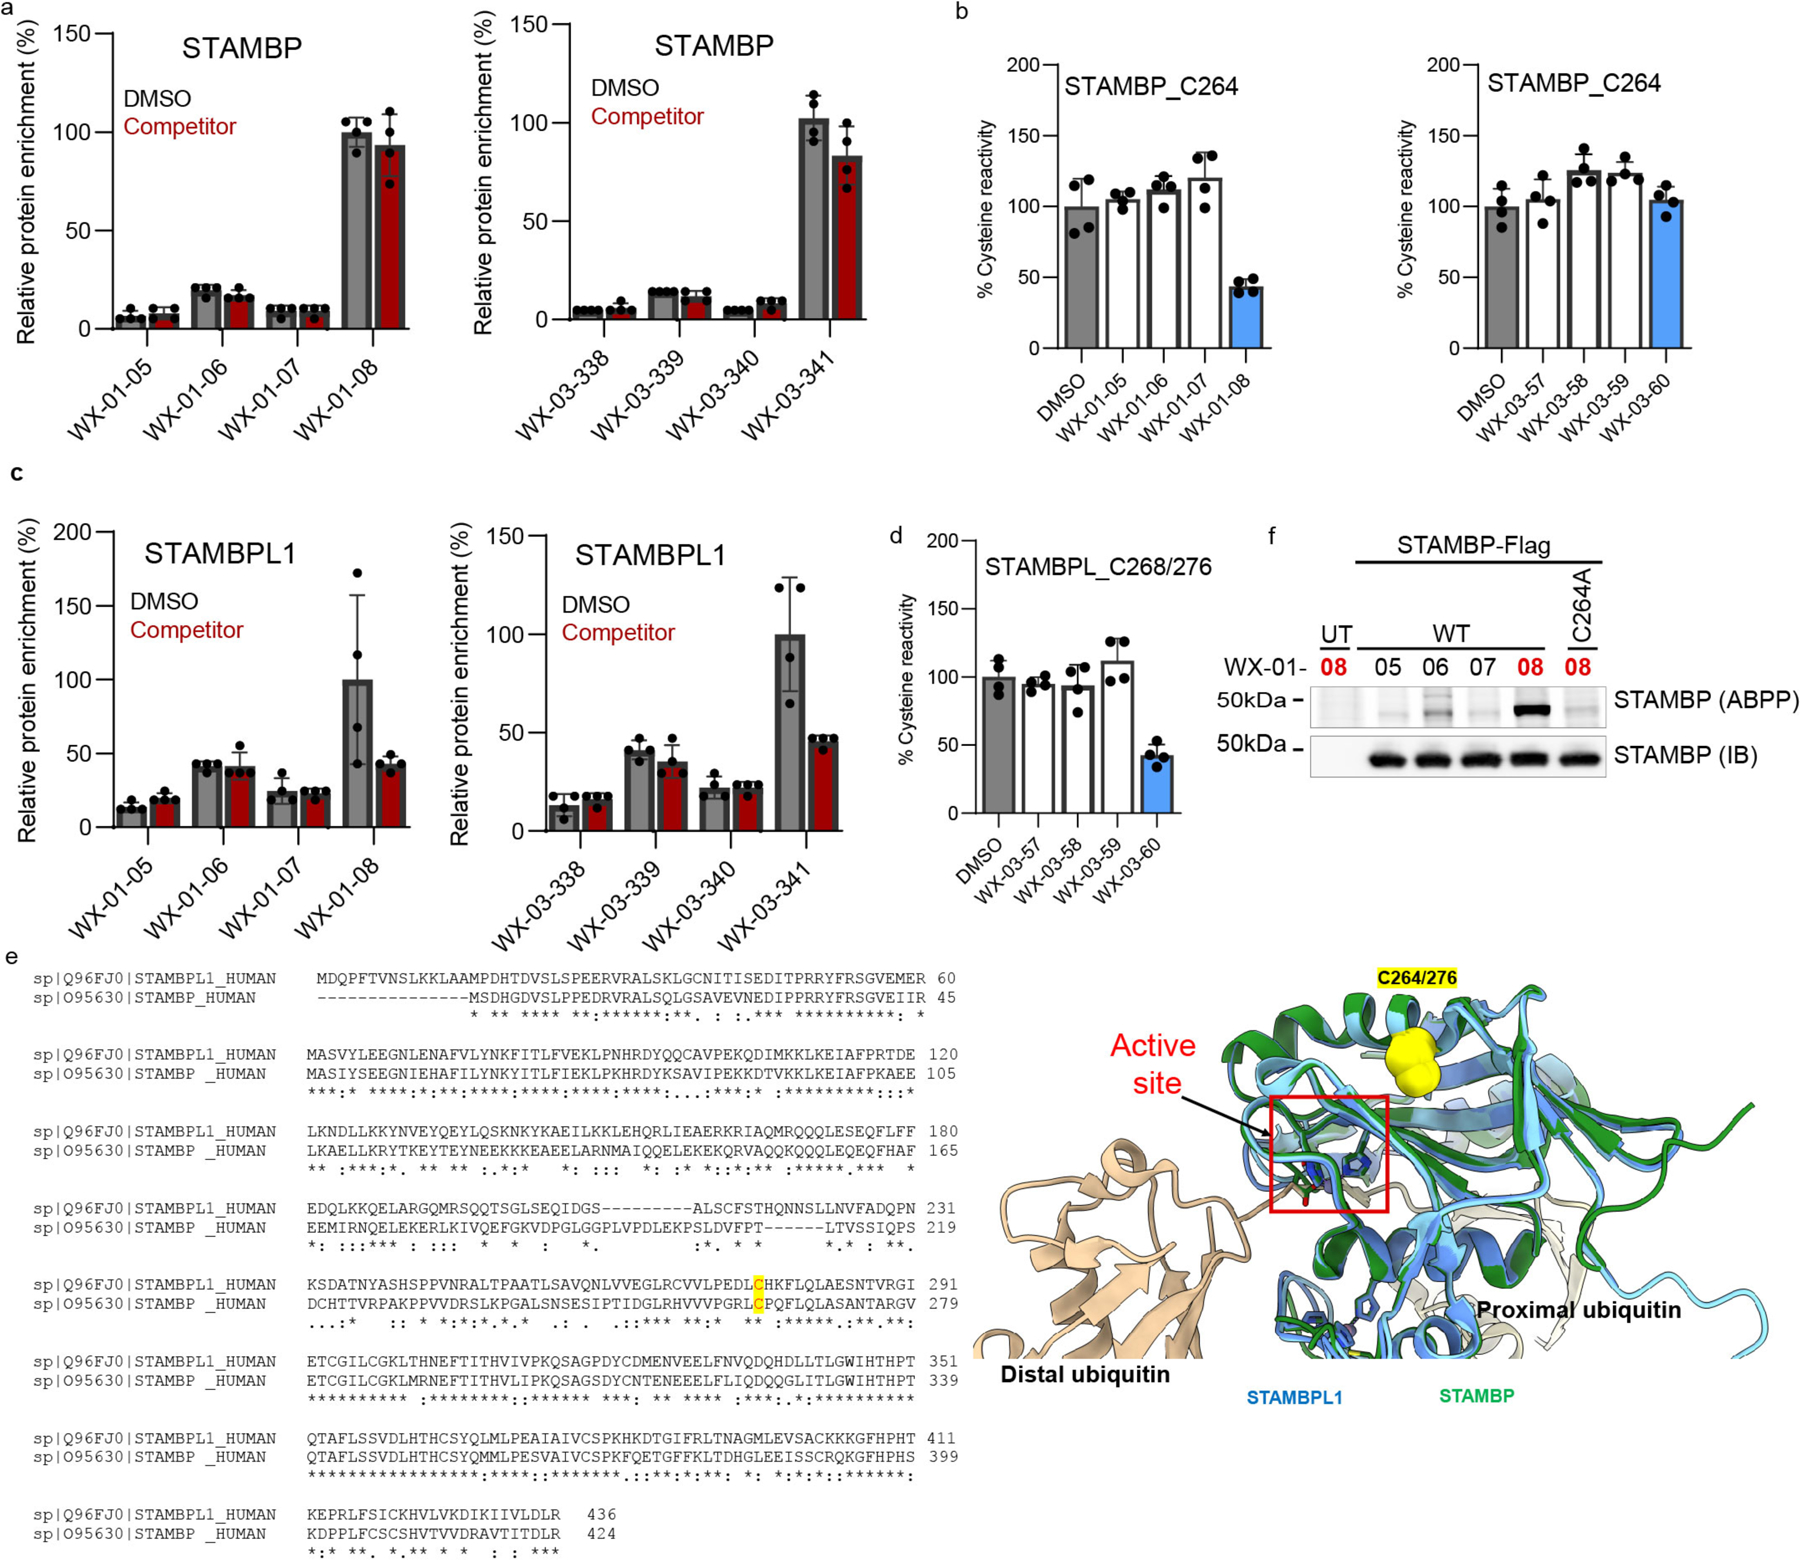
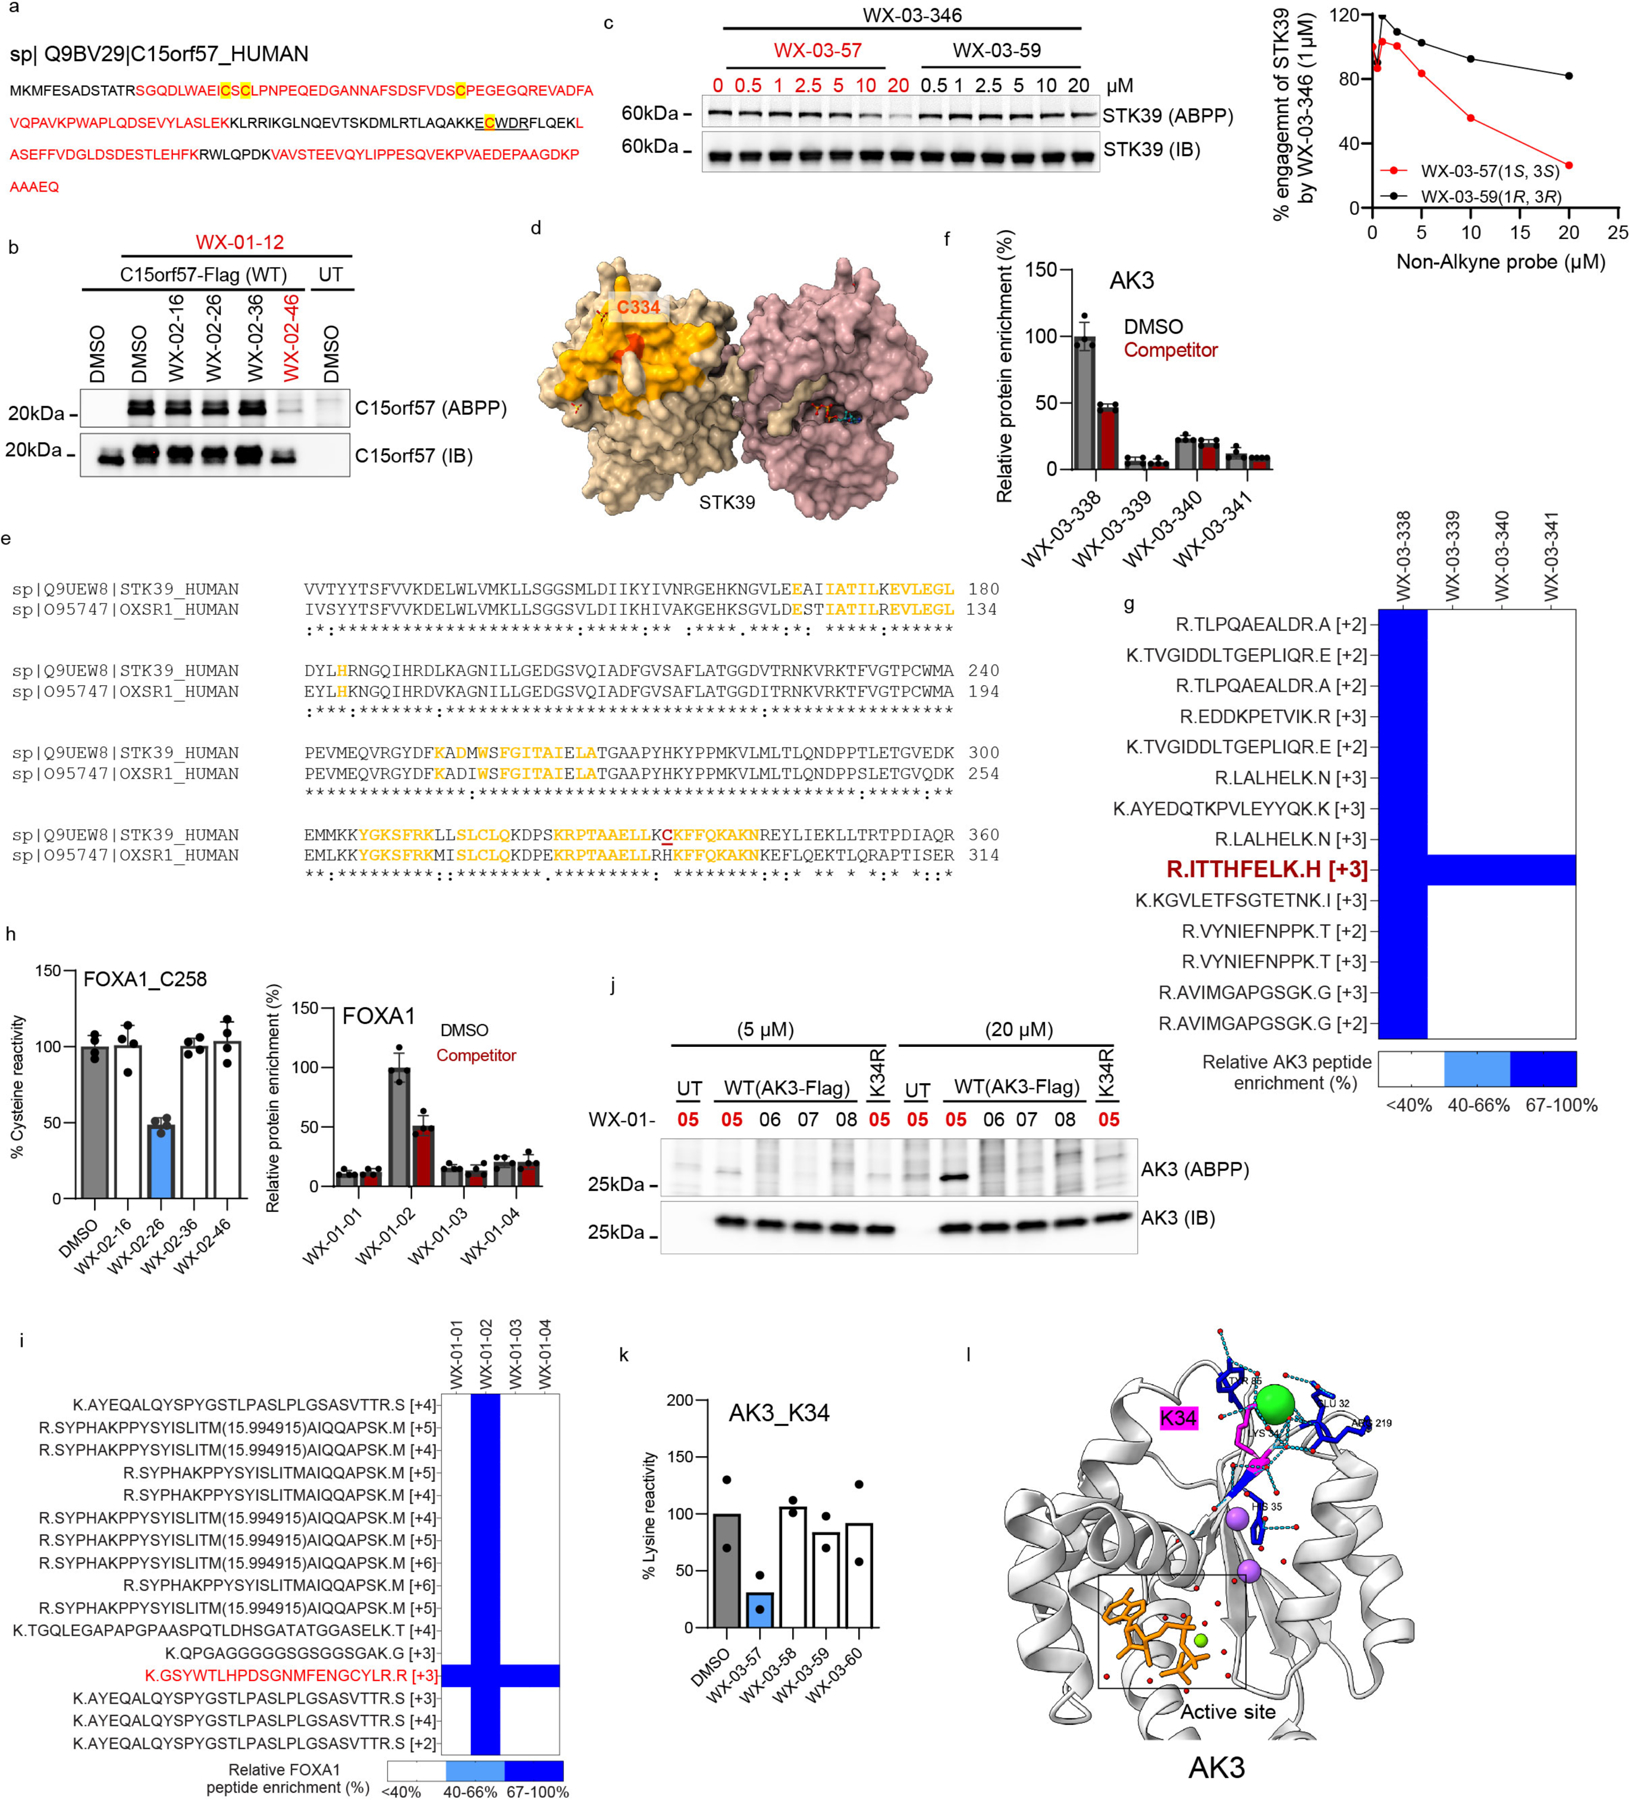
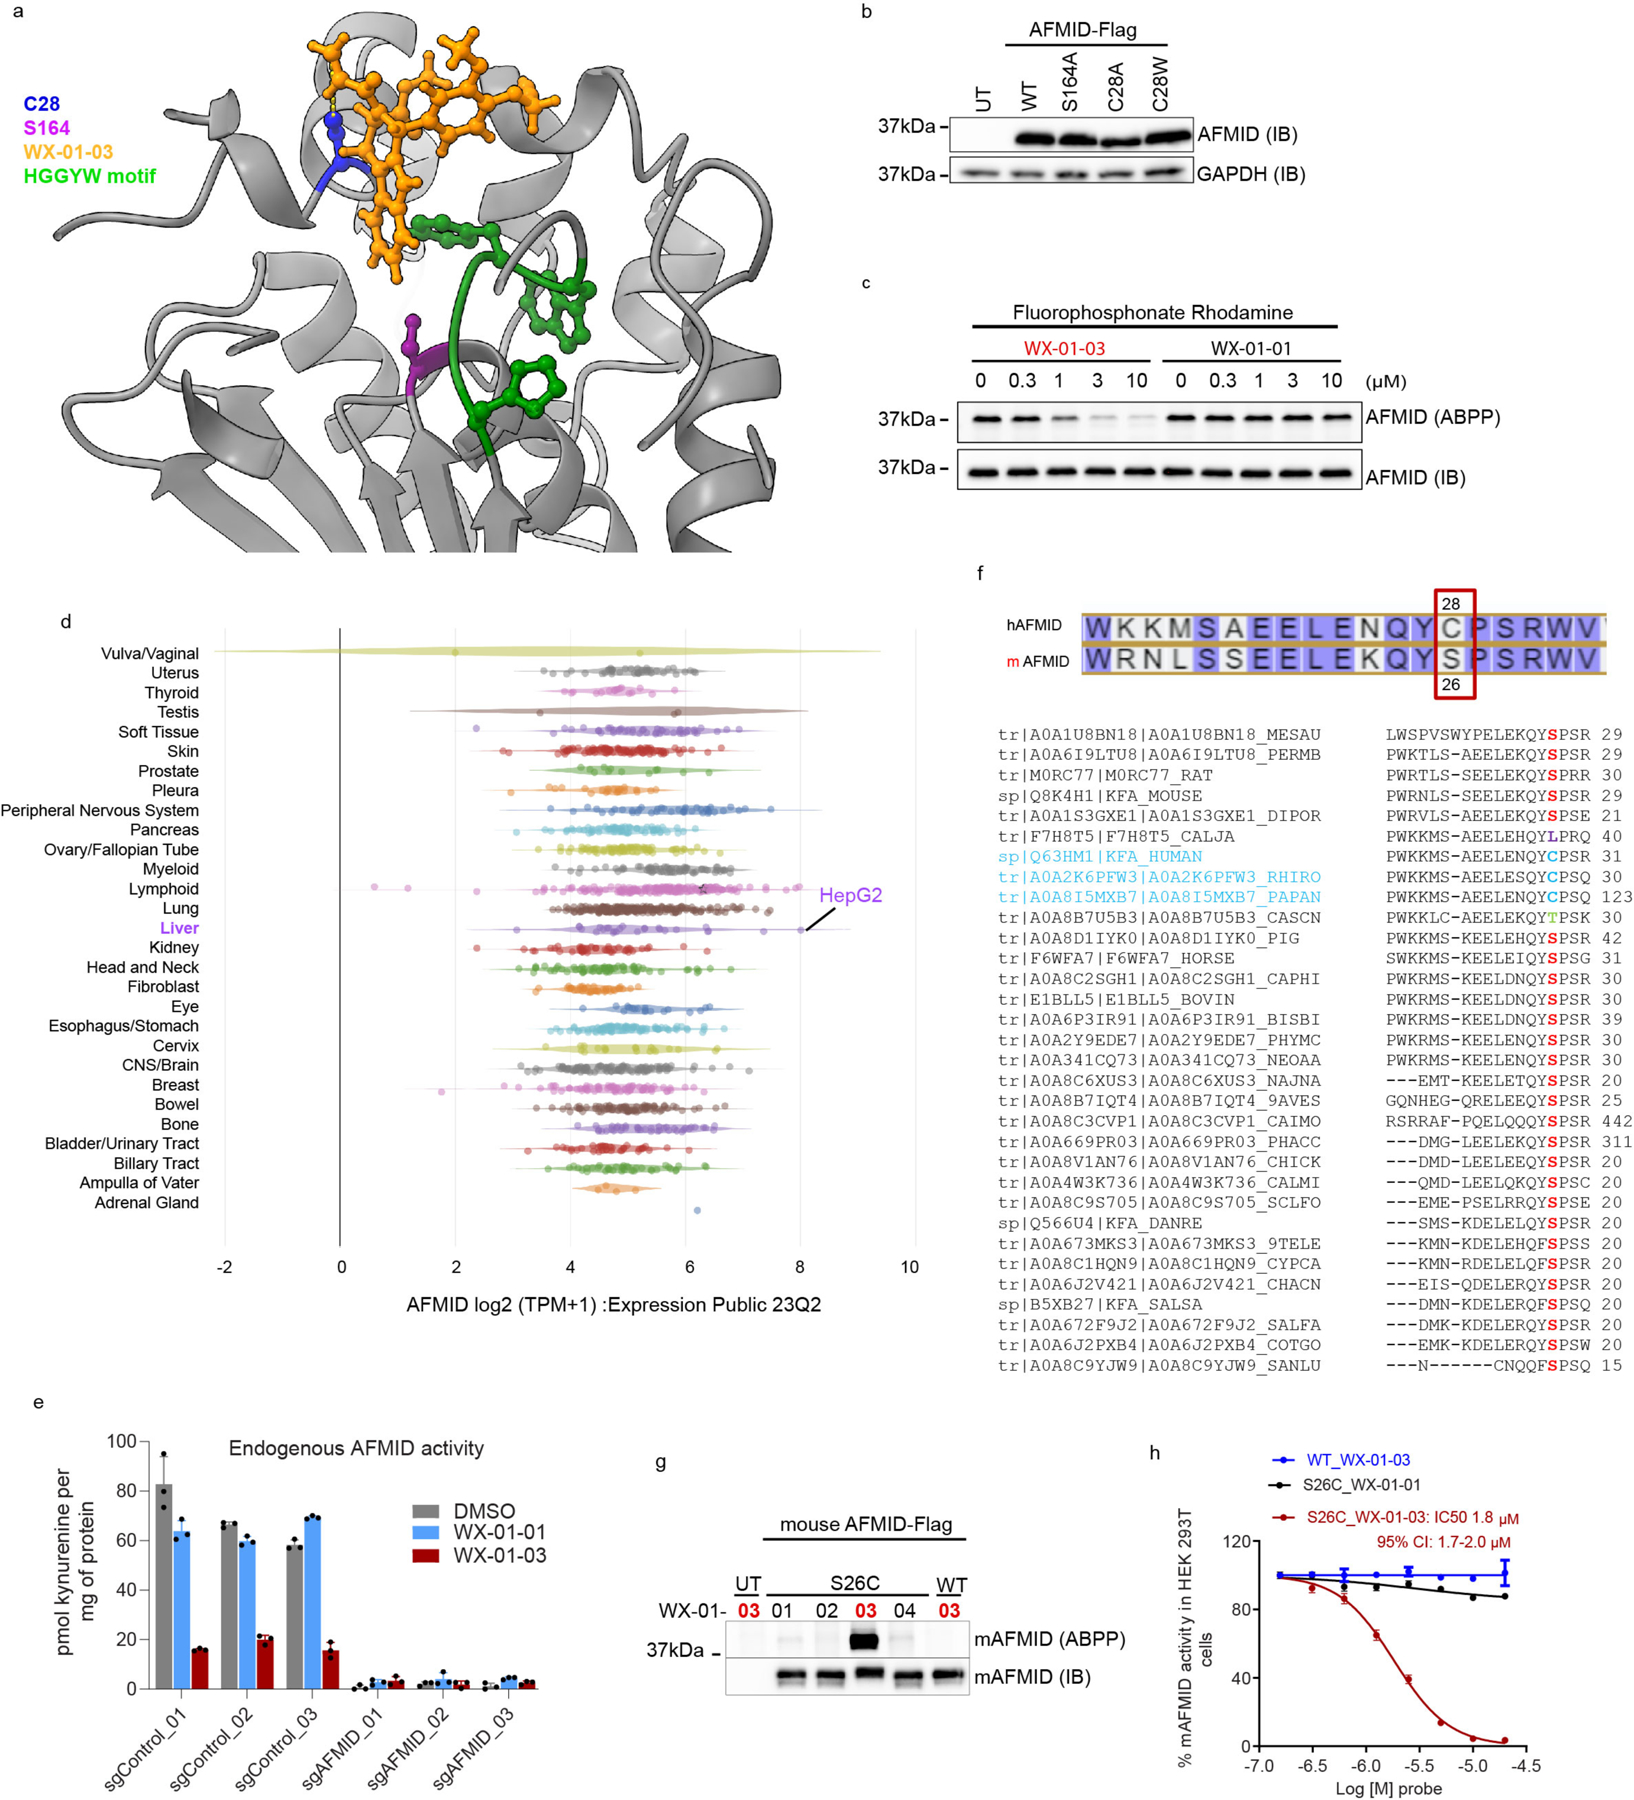
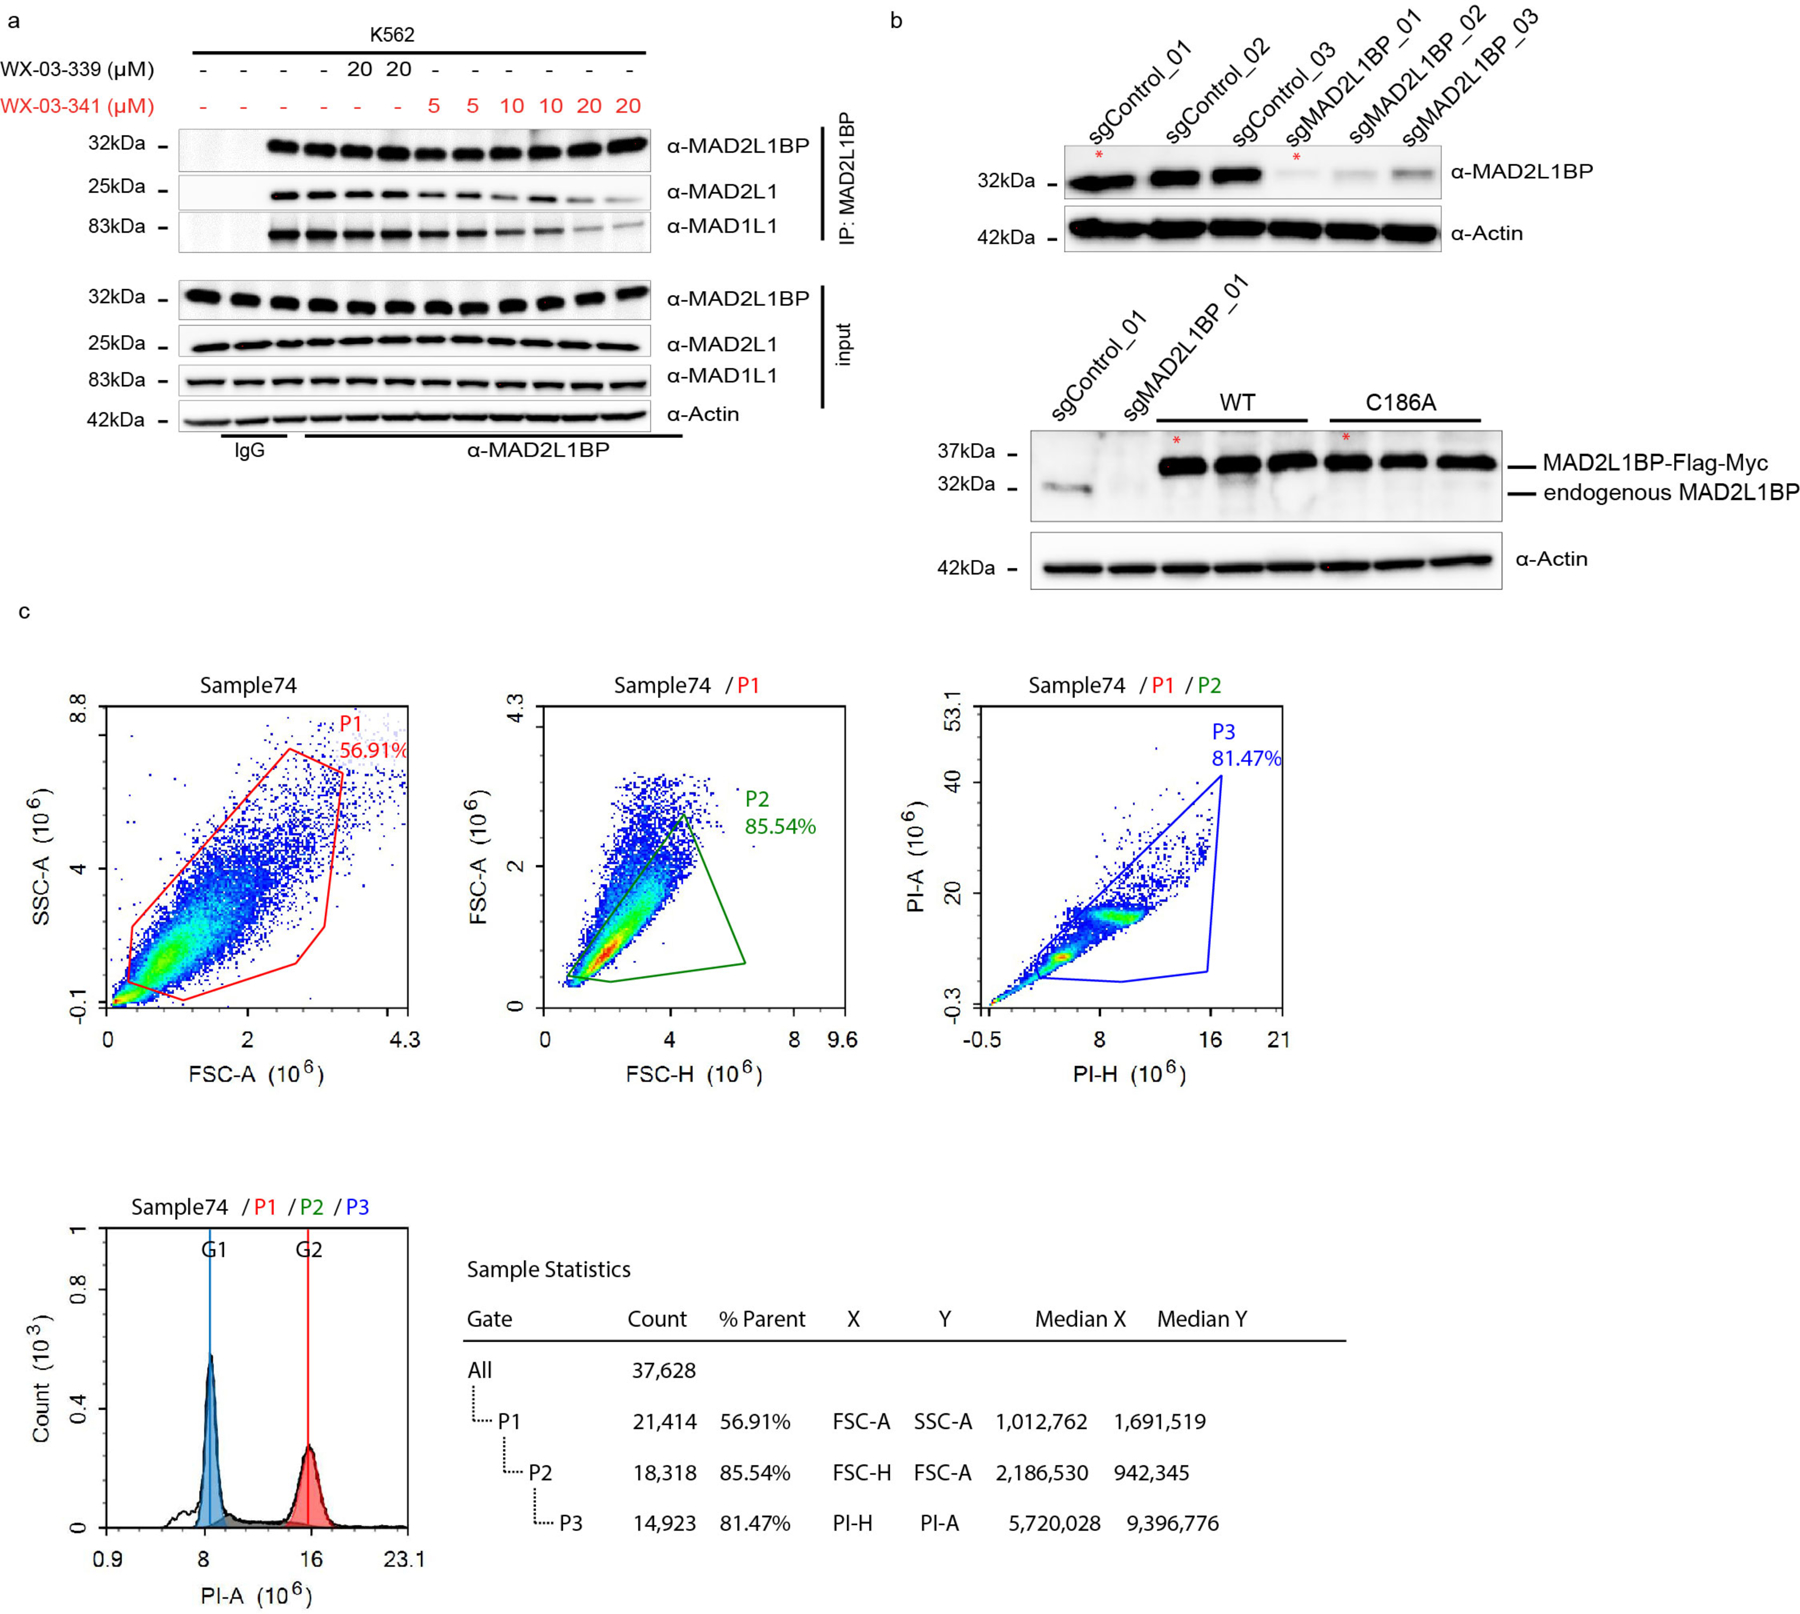
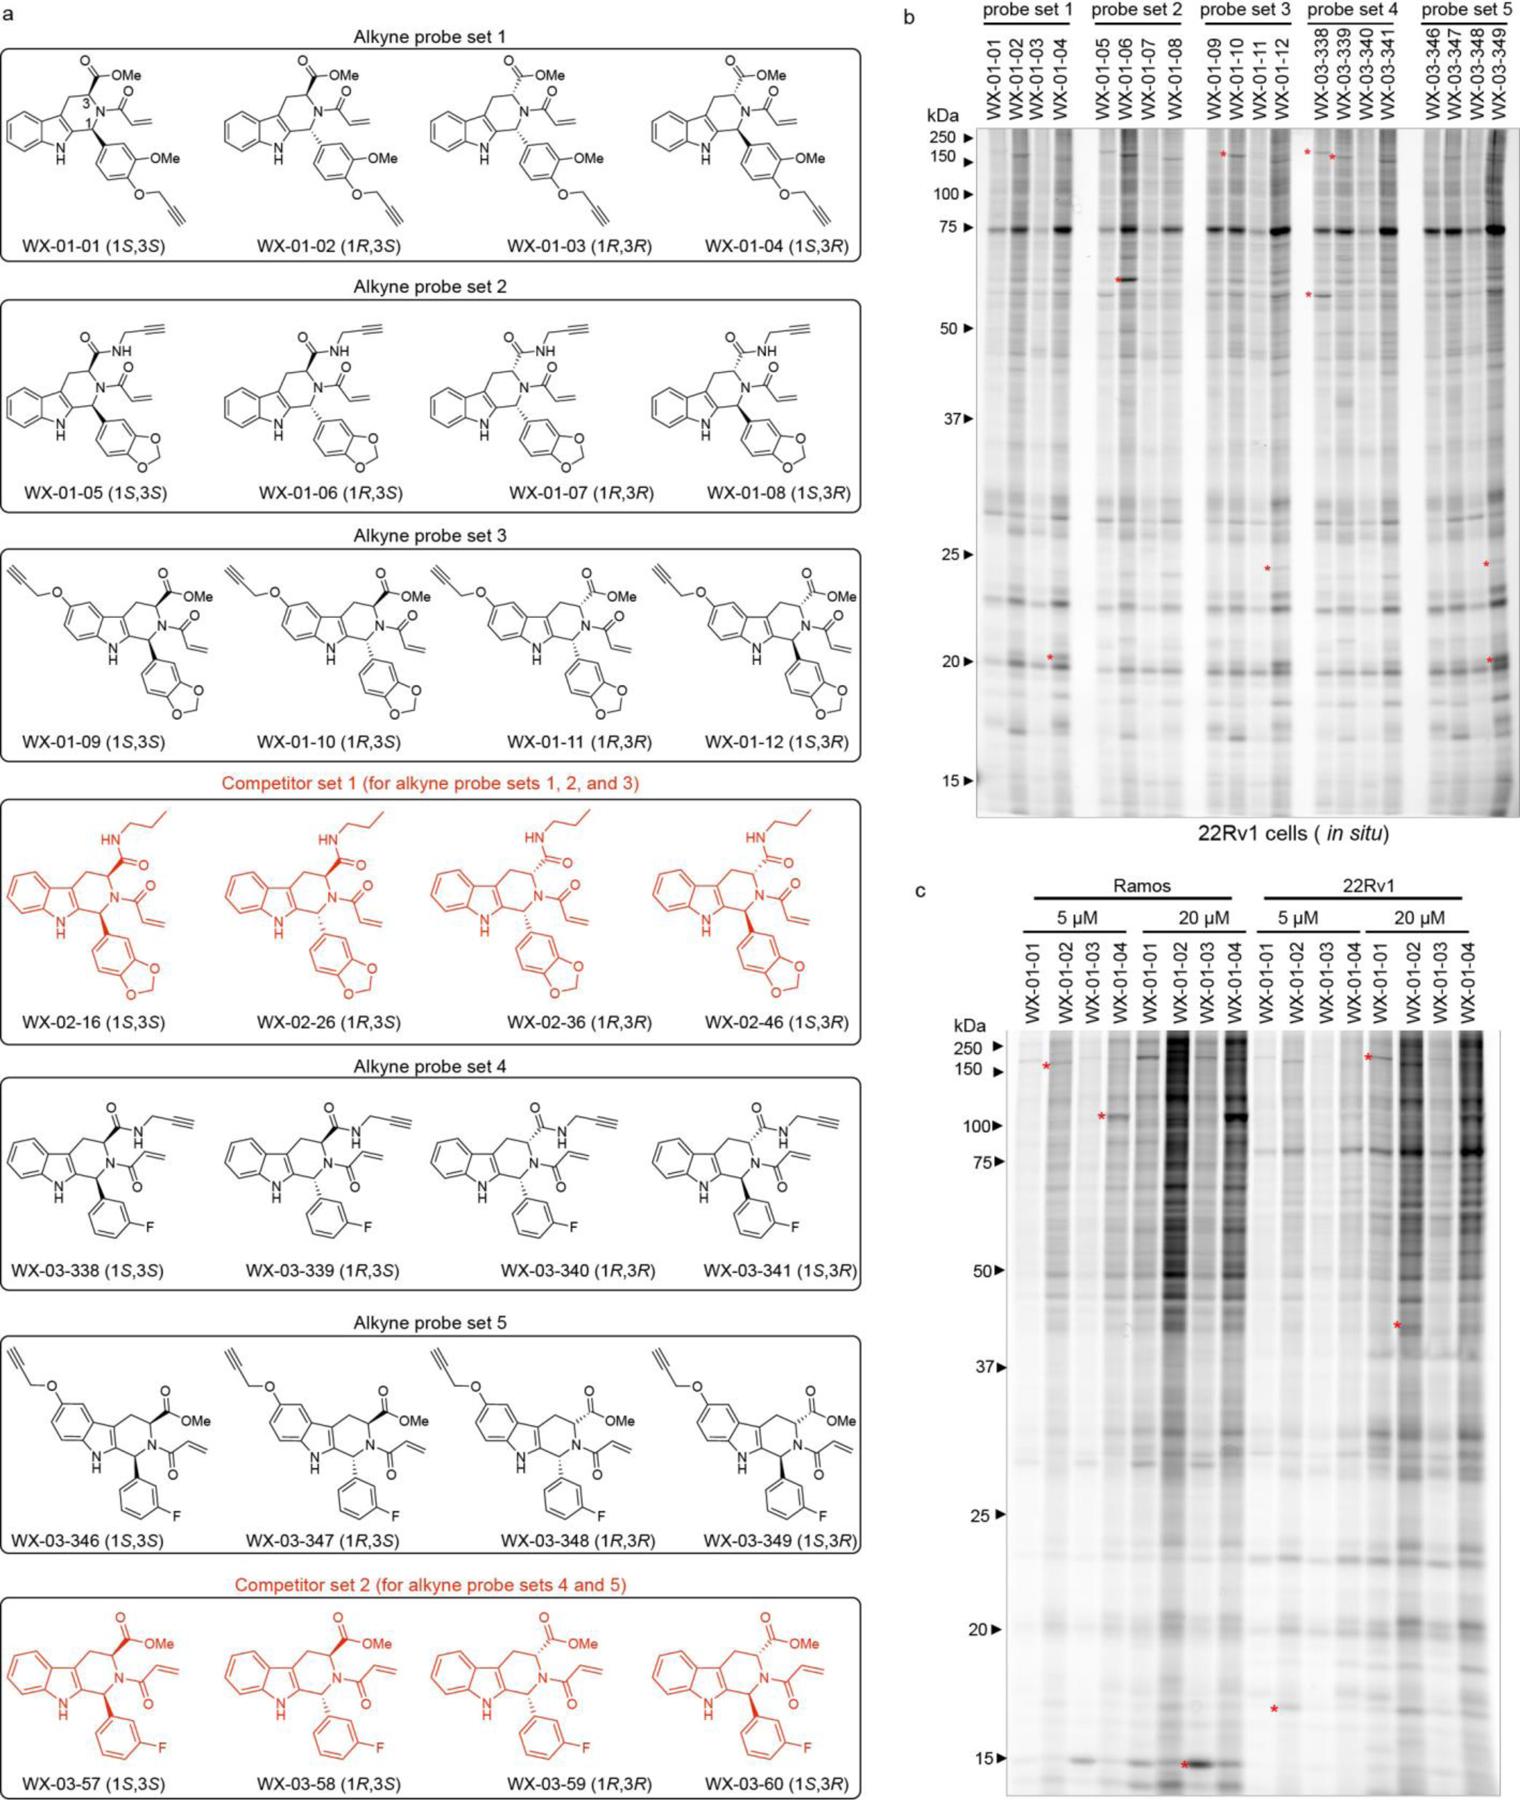
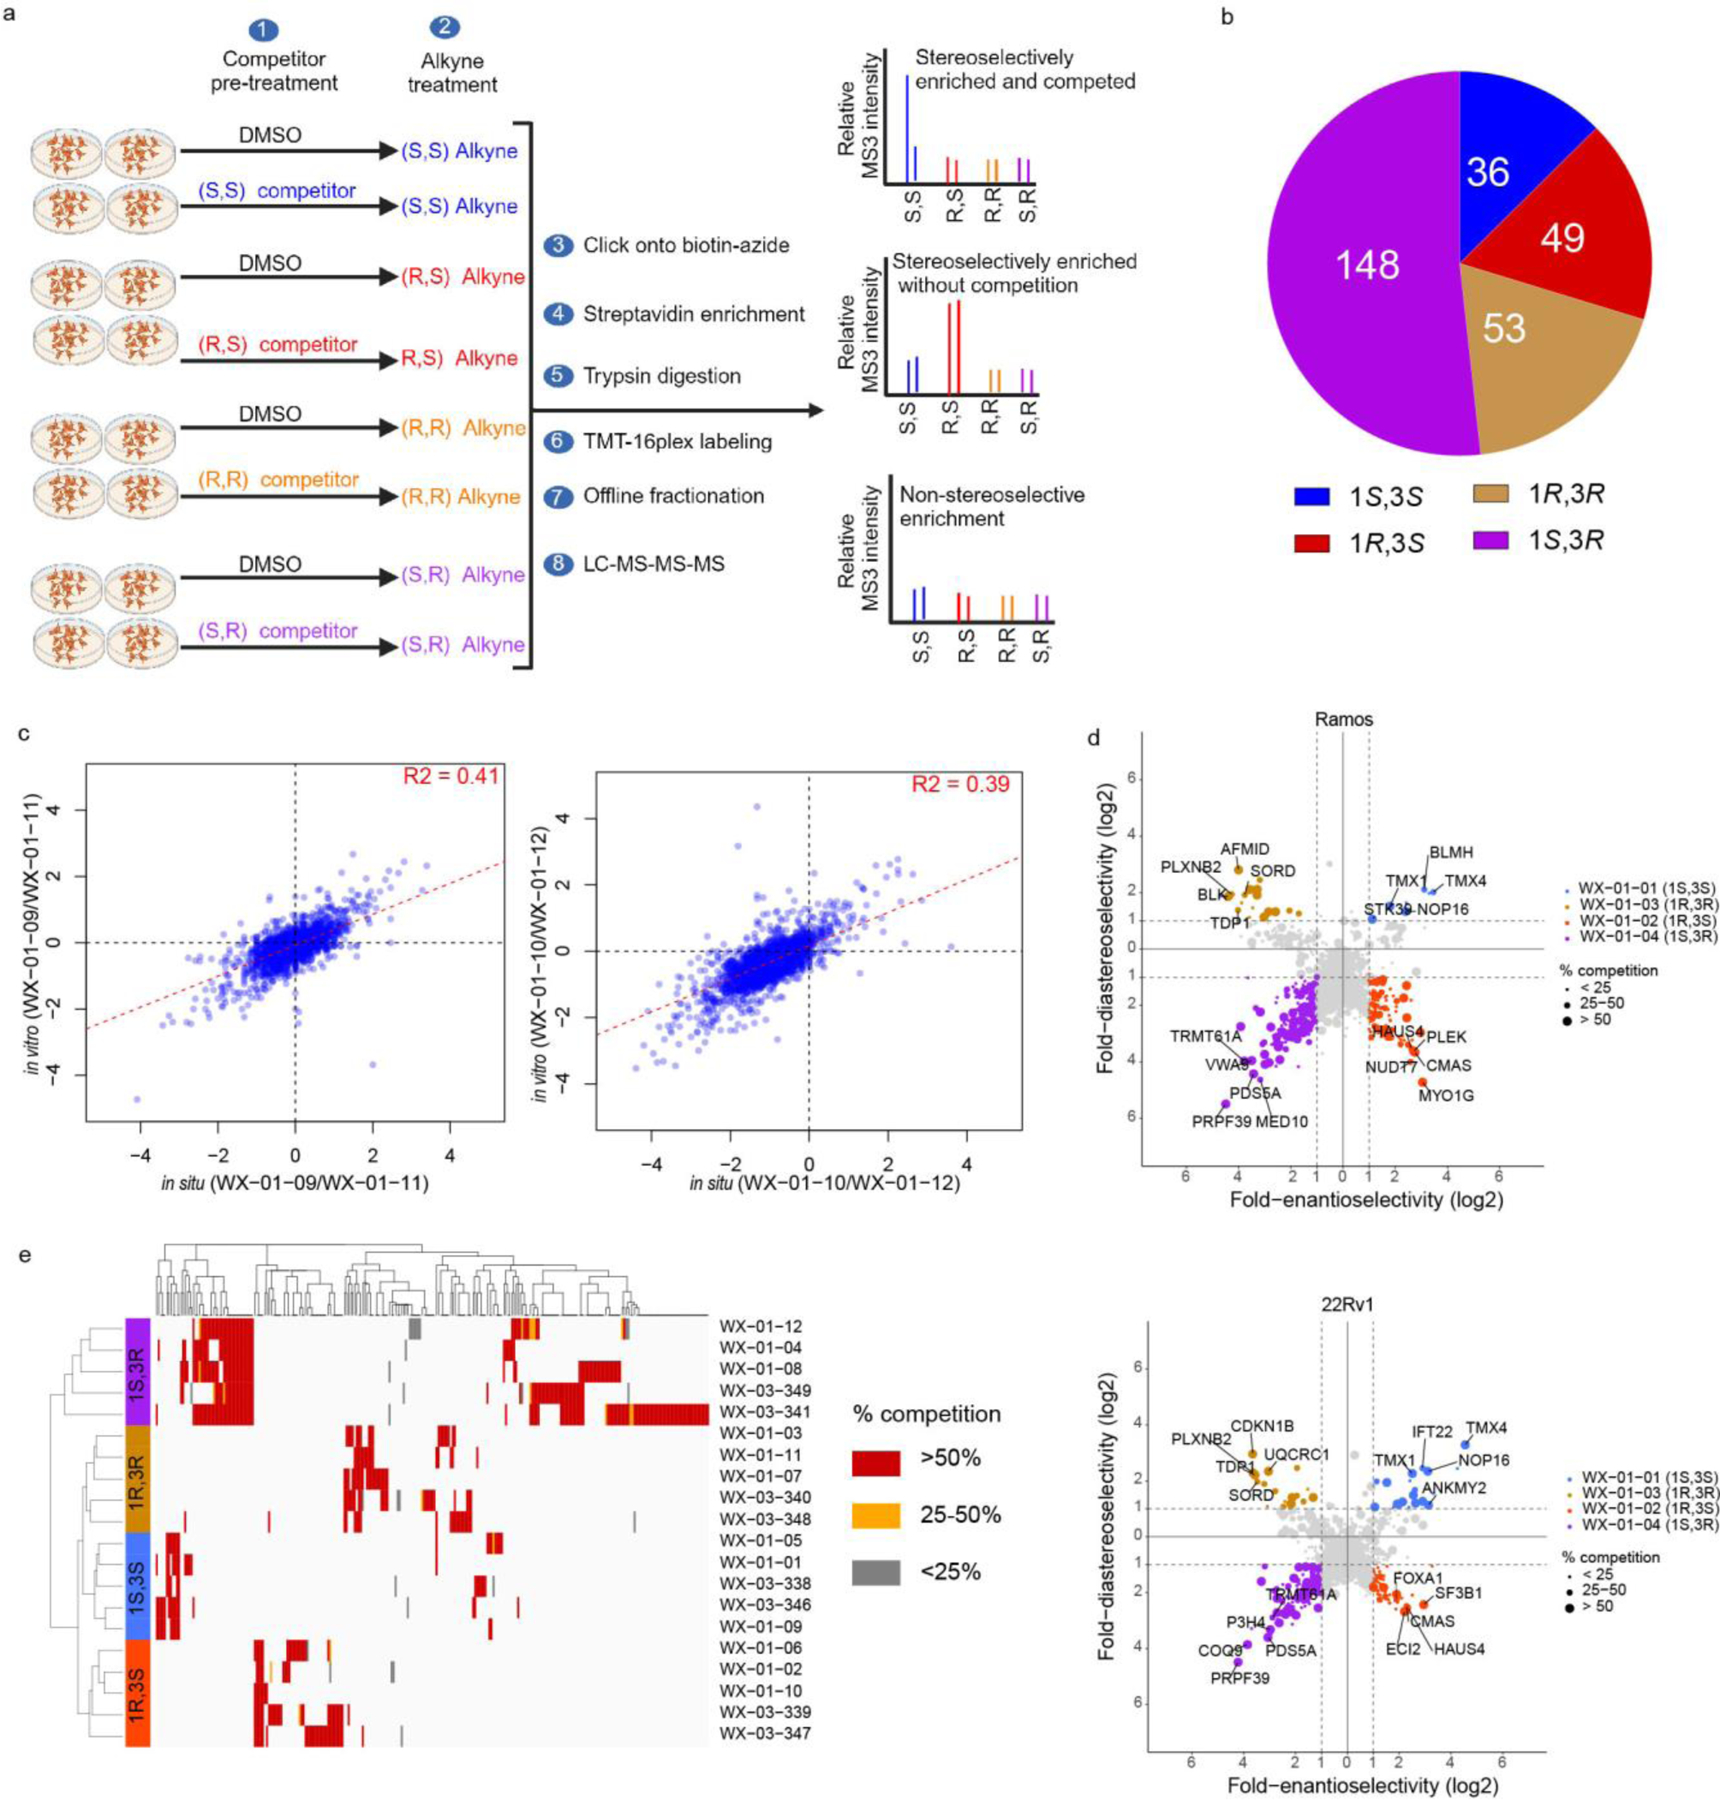
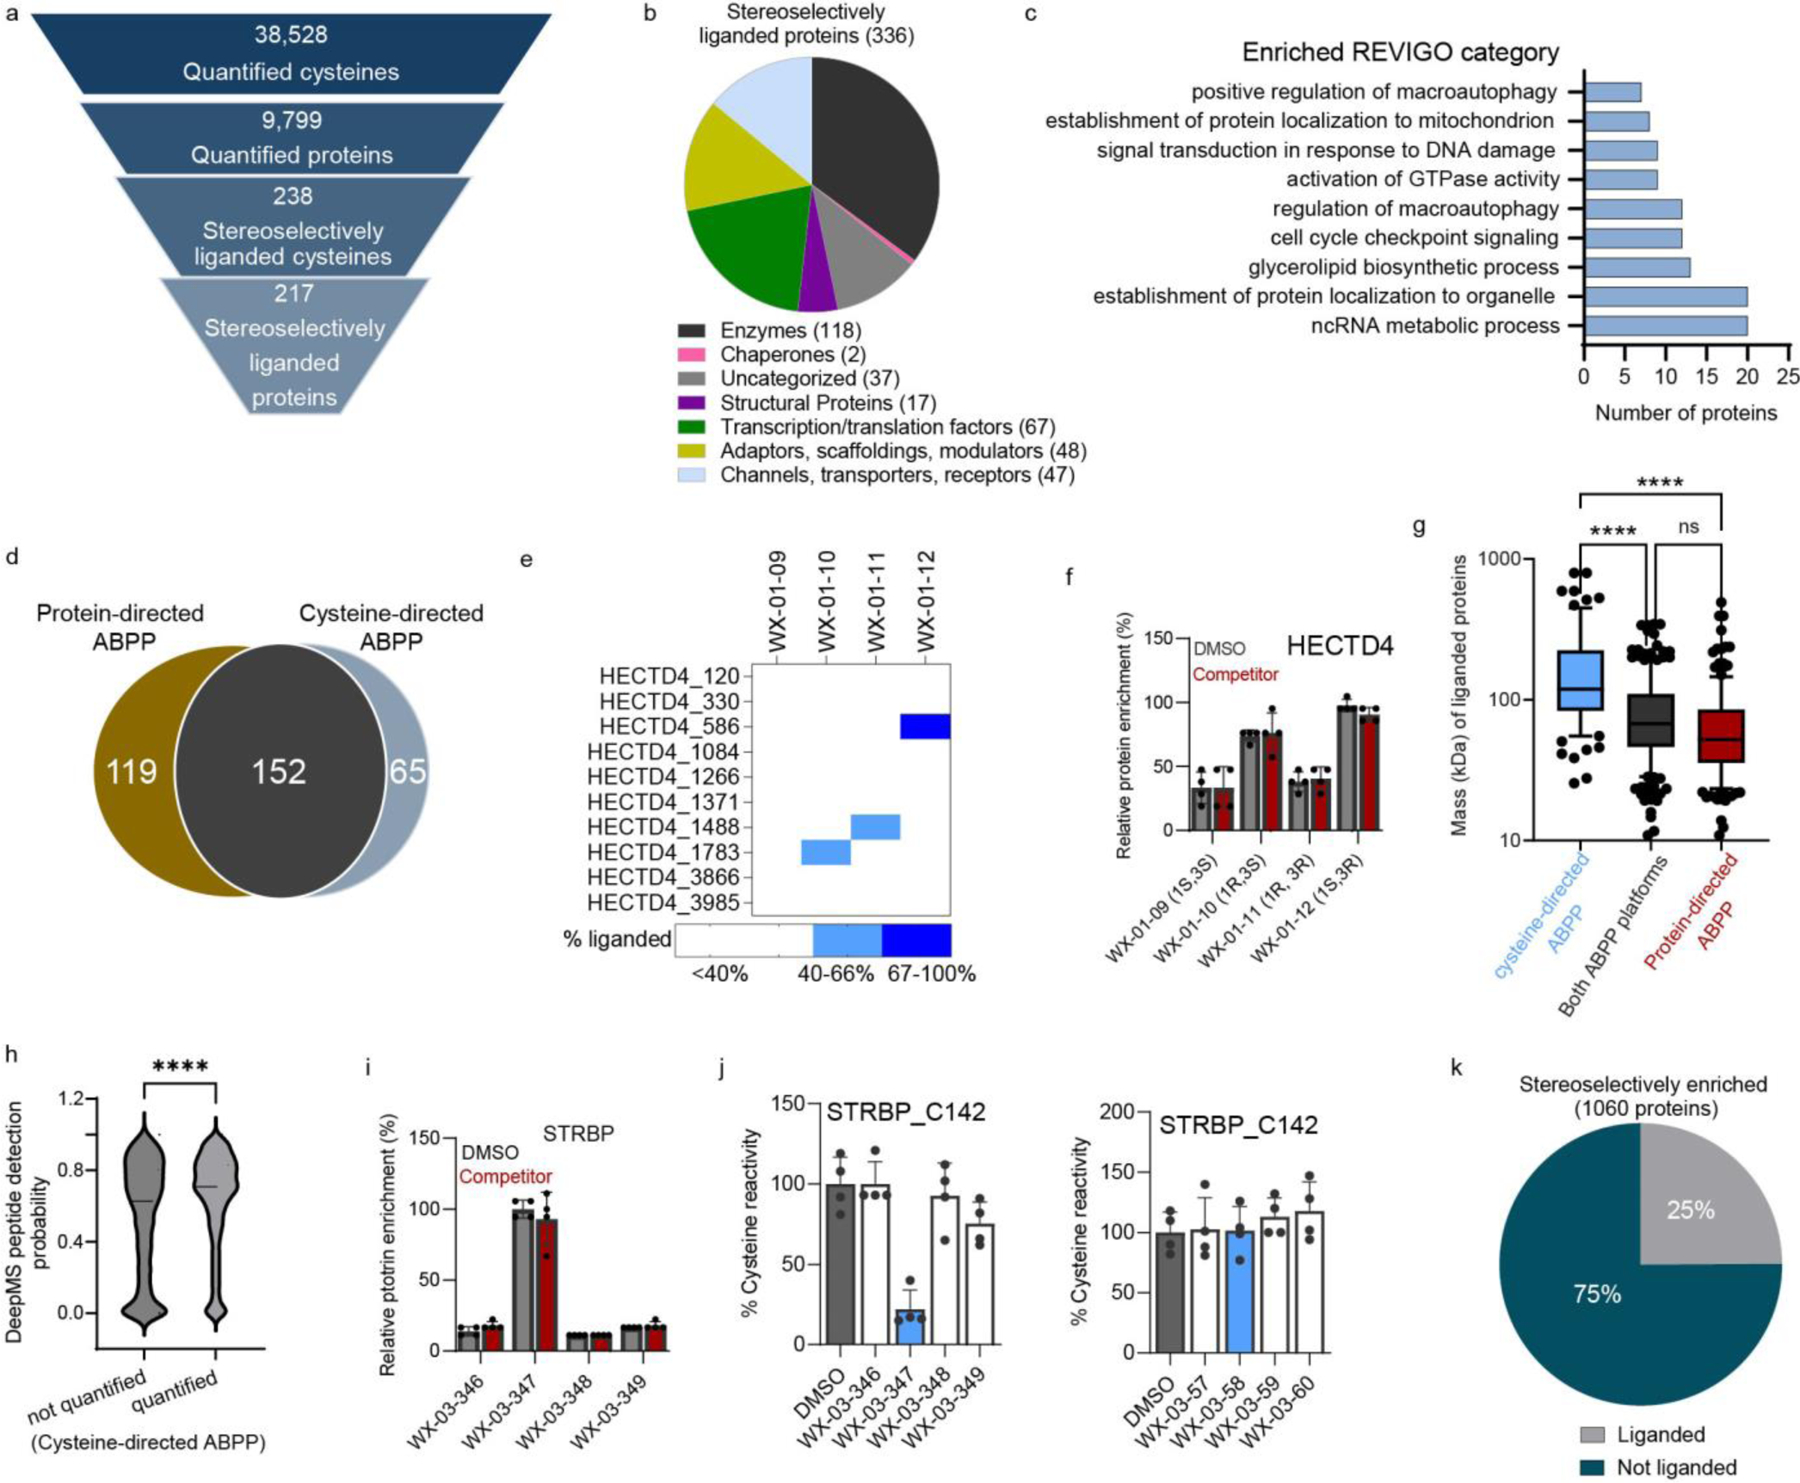
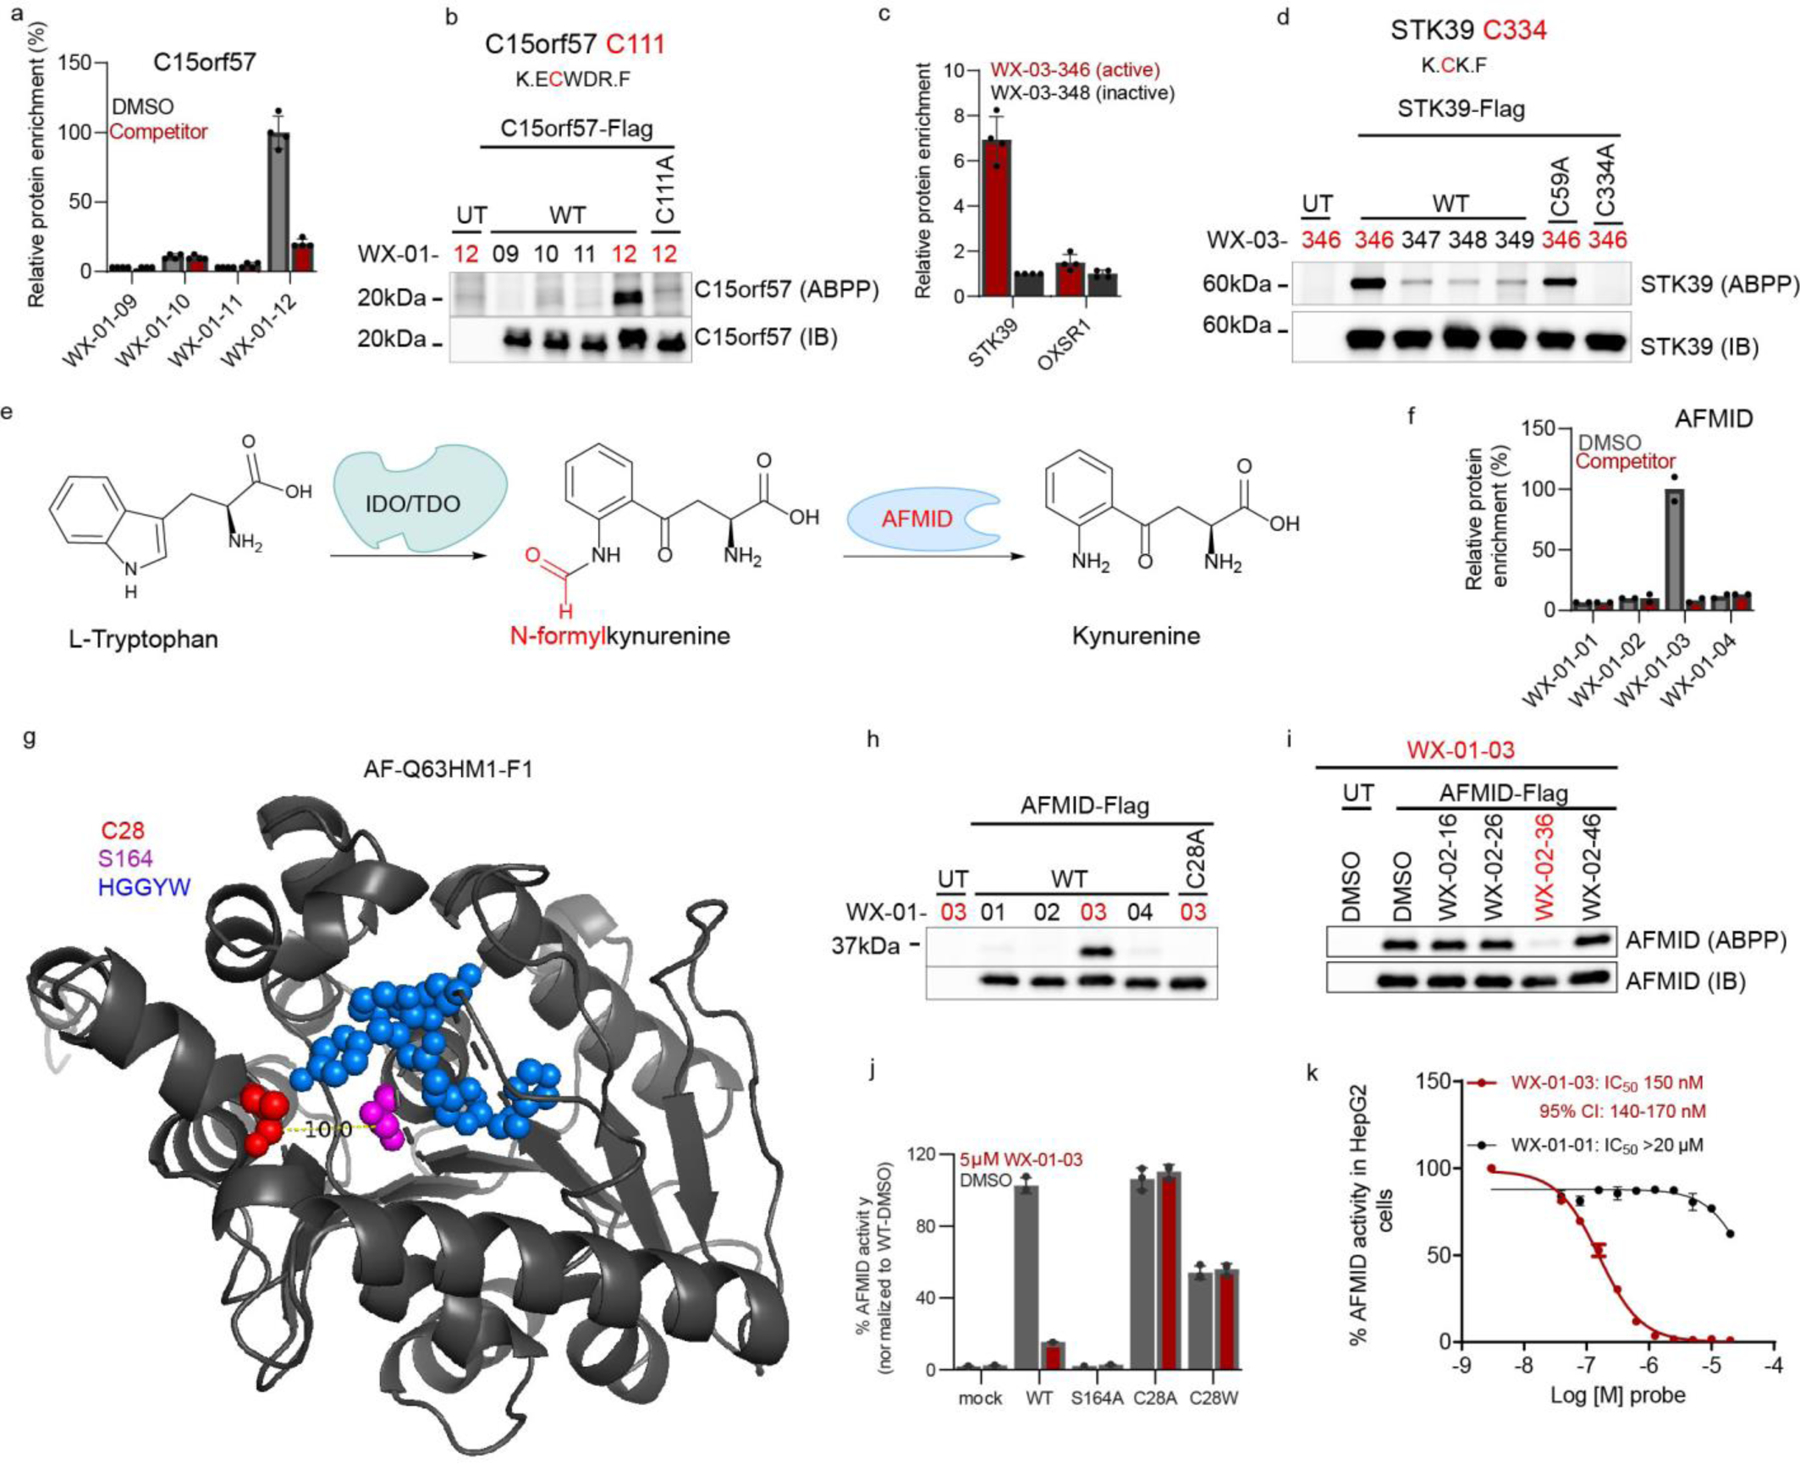
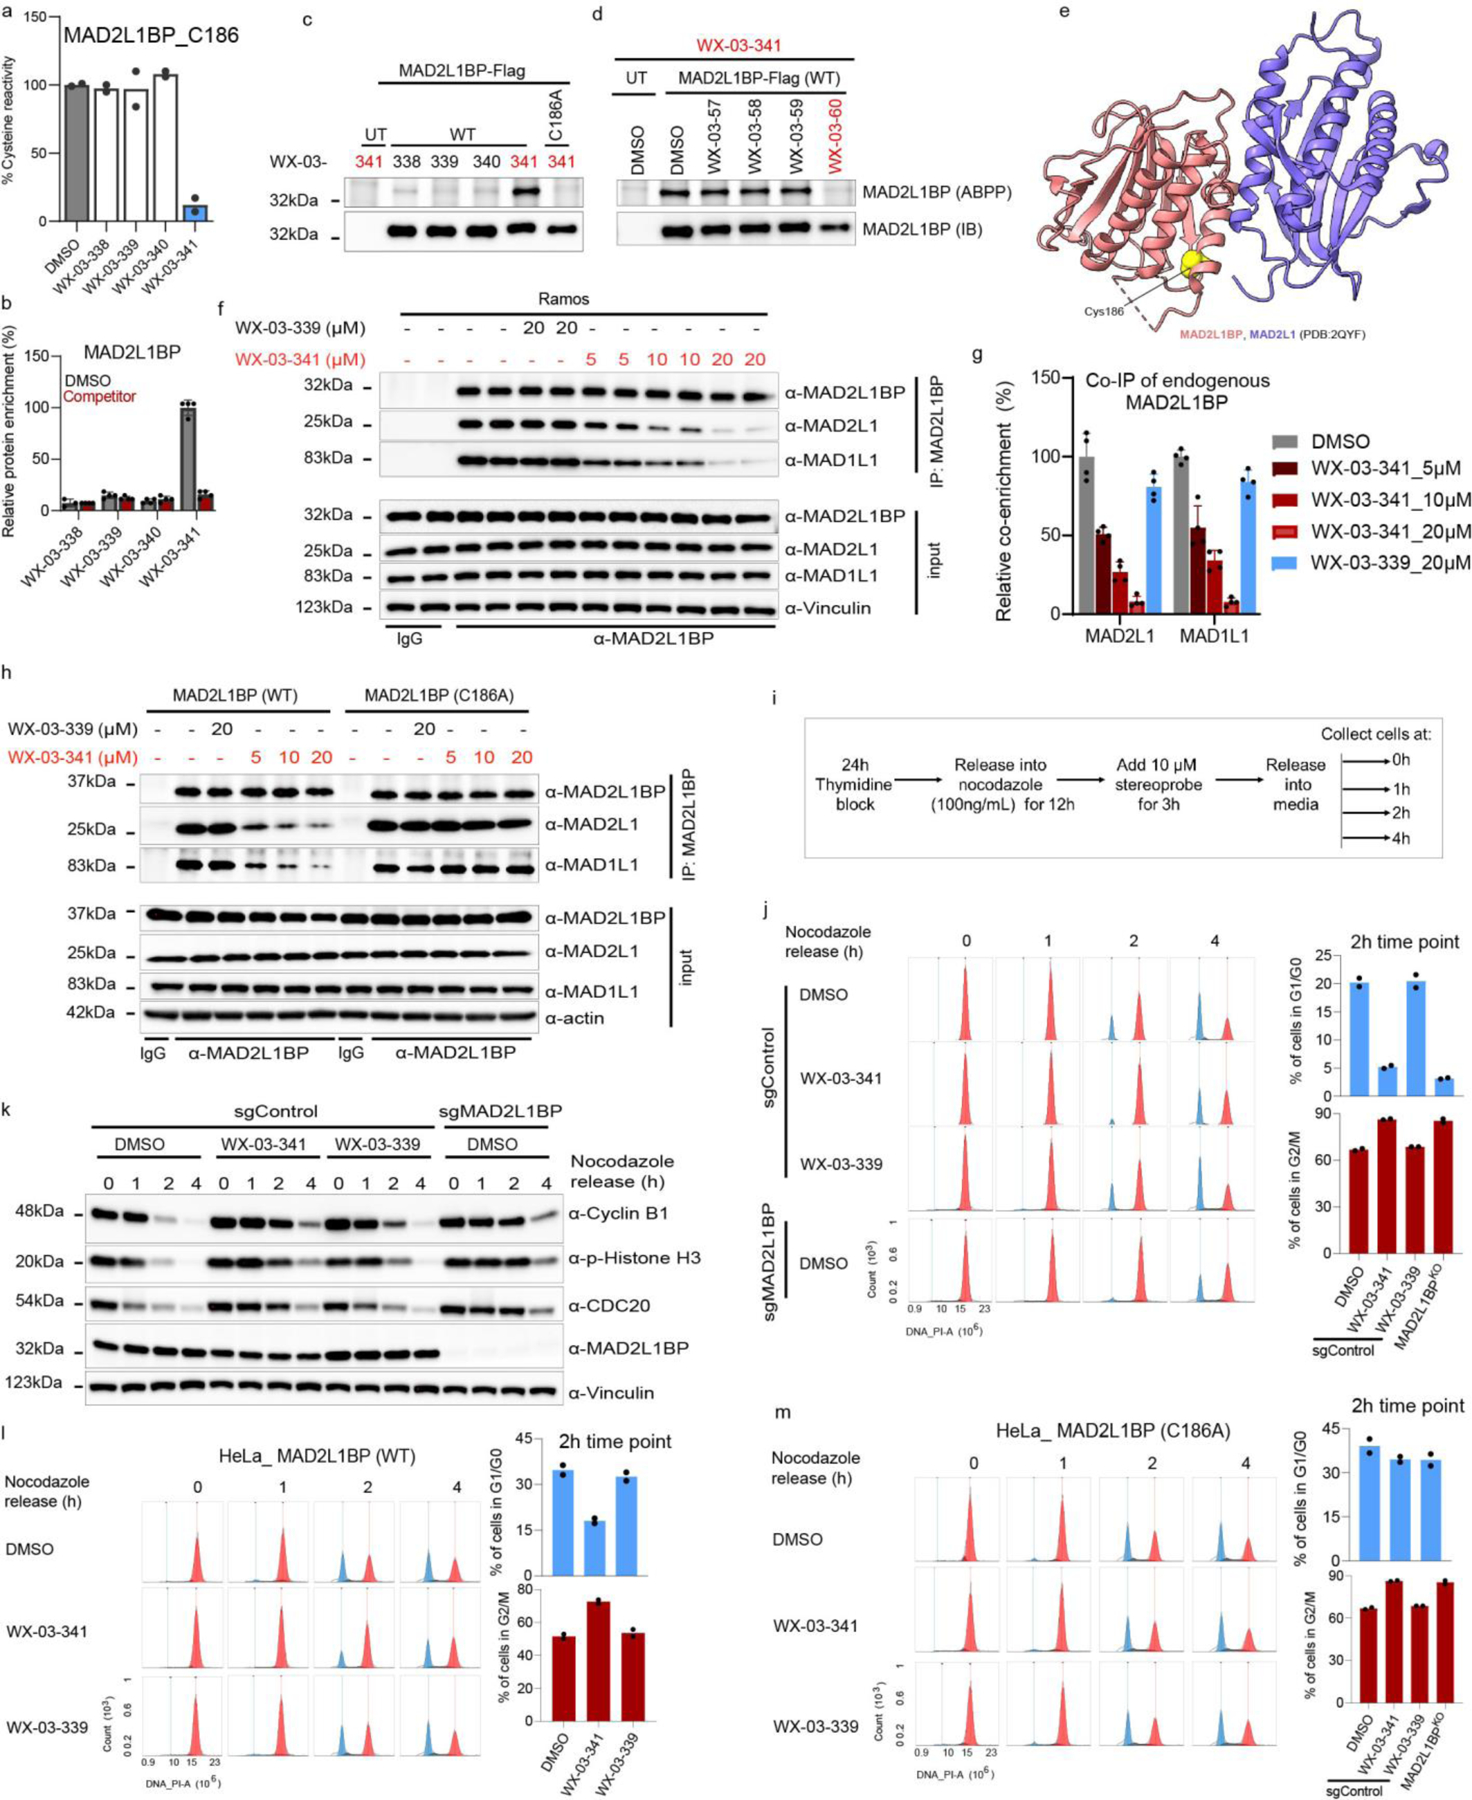
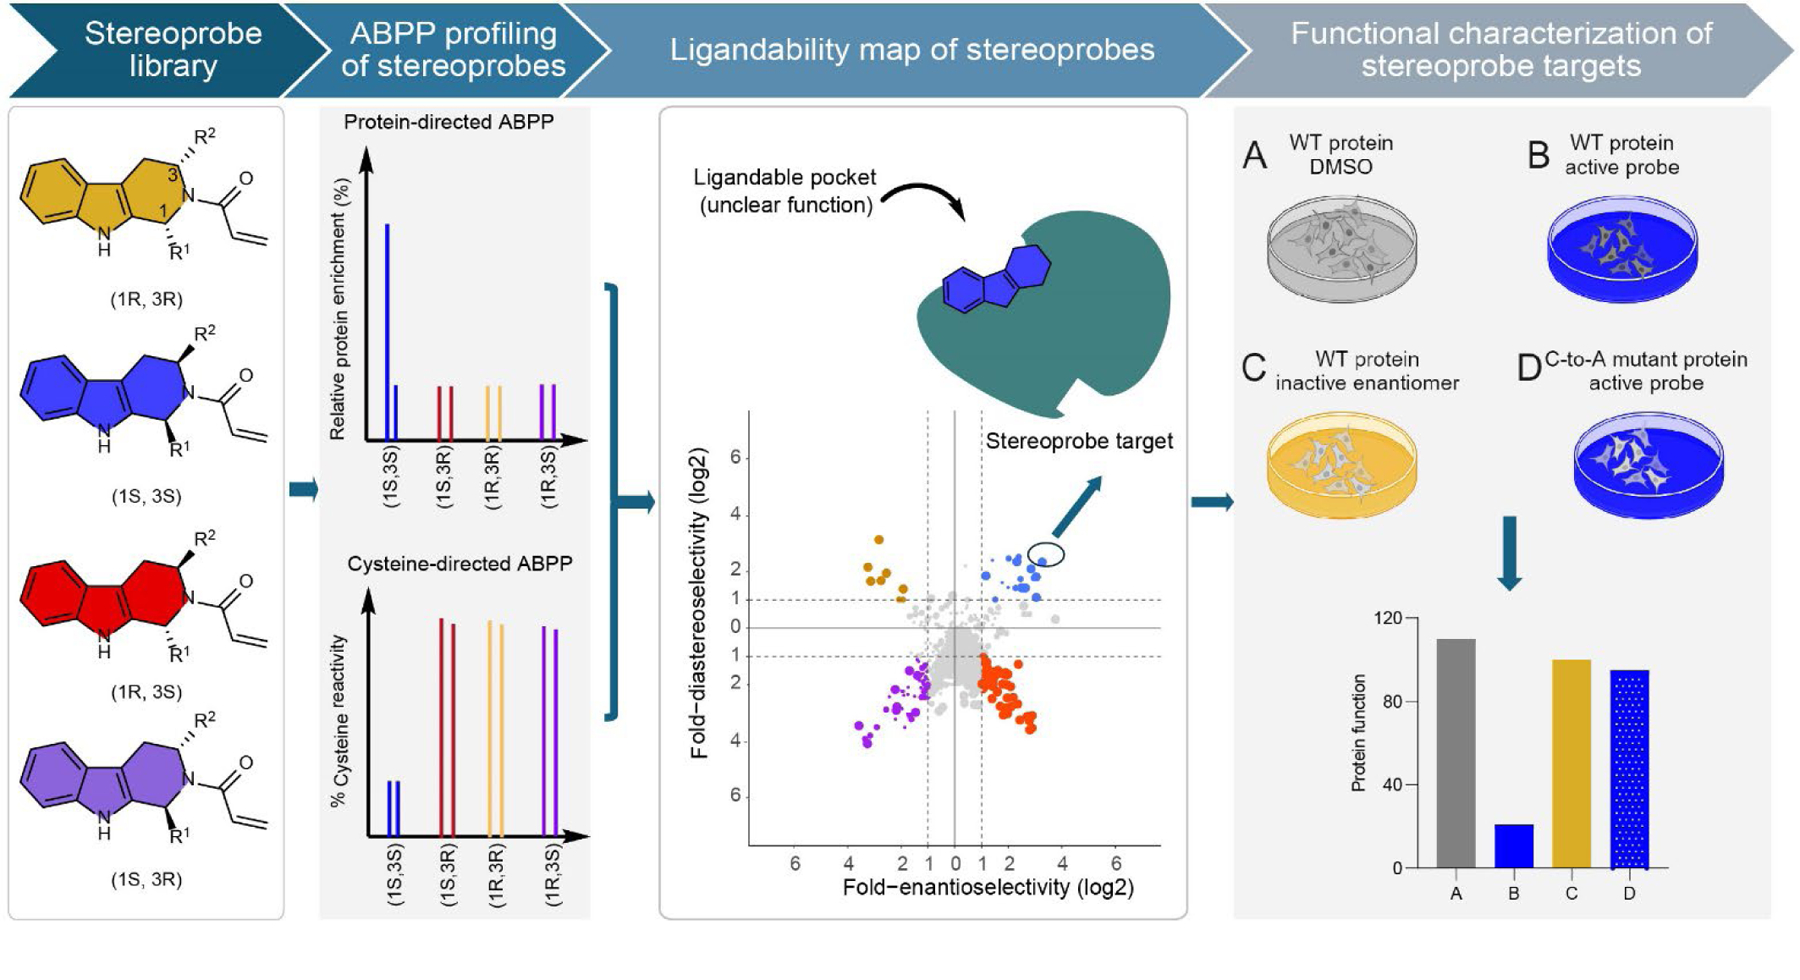
Covalent chemistry is a versatile approach for expanding the ligandability of the human proteome. Activity-based protein profiling (ABPP) can infer the specific residues modified by electrophilic compounds through competition with broadly reactive probes. However, the extent to which such residue-directed platforms fully assess the protein targets of electrophilic compounds in cells remains unclear. Here we evaluate a complementary protein-directed ABPP method that identifies proteins showing stereoselective reactivity with alkynylated, chiral electrophilic compounds-termed stereoprobes. Integration of protein- and cysteine-directed data from cancer cells treated with tryptoline acrylamide stereoprobes revealed generally well-correlated ligandability maps and highlighted features, such as protein size and the proteotypicity of cysteine-containing peptides, that explain gaps in each ABPP platform. In total, we identified stereoprobe binding events for >300 structurally and functionally diverse proteins, including compounds that stereoselectively and site-specifically disrupt MAD2L1BP interactions with the spindle assembly checkpoint complex leading to delayed mitotic exit in cancer cells.


Conflict of interest statement

Competing Interests

G.M.S., T. N., and P.A. are employees of Vividion Therapeutics, and B.F.C. is a founder and member of the Board of Directors of Vividion Therapeutics. The remaining authors declare no competing interests.

Figures

Extended Data Fig. 1
Extended Data Fig. 1. Gel-ABPP of alkyne stereoprobes in human cancer cells
a, In situ reactivity of alkyne stereoprobes (5 μM, 1 h) in Ramos cells as determined by gel-ABPP. b, In vitro reactivity of probe set 1 (5 or 20 μM, 1 h) in Ramos and 22Rv1 cell lysate. Red asterisks mark examples of stereoselective stereoprobe-protein interactions. a, b, data are from a single experiment representative of at least two independent experiments.
Extended Data Fig. 2
Extended Data Fig. 2. Protein-directed ABPP platform for mapping stereoselectively liganded proteins in human cells.
a, Workflow for protein-directed ABPP experiments where the stereoselective enrichment of proteins by alkyne stereoprobes is determined by multiplexed (tandem mass tagging, TMT10plex) MS-based proteomics. Image was created with BioRender.com. b, Comparison of enantioselective enrichment values in protein-directed ABPP experiments in Ramos cells treated with alkyne stereoprobe set 2 (WX-01-05/06/07/08) at 5 vs 20 μM (3 h). Proteins shown are: 1) designated as stereoselective targets in either the 5 or 20 μM data sets (> 3-fold enantioselective enrichment); and 2) quantified in both the 5 and 20 μM data sets. c, Number of proteins stereoselectively liganded by each stereoconfiguration of stereoprobe set 3 (WX-01-09/10/11/12; 10 μM, 1 h) in vitro. d, Examples of proteins showing preferential stereoselective enrichment by stereoprobe set 3 in situ (SF3B1, UBA3) or in vitro (CMPK1, GRHPR). In situ conditions: 5 μM stereoprobe, 1 h; in vitro conditions: 10 μM stereorpobe, 1 h. Data represent mean values ± SD for four independent experiments (n=4). e, Pie chart showing fraction of proteins that were enantioselectively liganded by cis (1R, 3R and 1S, 3S) stereoprobes (cis-only), trans (1R, 3S and 1S, 3R) stereoprobes (trans-only), or both cis and trans stereoprobes (cis/trans).
Extended Data Fig. 3
Extended Data Fig. 3. Stereoprobe-protein interaction maps from protein-directed ABPP experiments in human cancer cells
a-d, Quadrant plots highlighting stereoselectively liganded proteins for each stereoconfiguration of alkyne stereoprobe sets 2–5 in Ramos (left) and 22Rv1(right) cells. Enantioselectivity (x-axis) is the ratio of enrichment for one stereoisomer vs its enantiomer, and diastereoselectivity (y-axis) is the ratio of enrichment of one stereoisomer vs the average of its two diastereomers. Data represent mean values for four independent experiments per stereoprobe, per cell line.
Extended Data Fig. 4
Extended Data Fig. 4. Integrated protein- and cysteine-directed
a, Workflow for cysteine-directed ABPP experiments where stereoprobe reactivity with cysteines is determined by multiplexed (tandem mass tagging, TMT10plex) MS-based proteomics, as described previously. The workflow was created with BioRender.com. b, Number of proteins stereoselectively liganded by one (single; black) versus multiple (red) stereoprobe core configurations. c, Proportion of stereoselectively liganded proteins showing essentiality in the Cancer Dependency Map. d, Heatmap of quantified cysteines in PRKDC showing two cysteines (C1229 and C1499/C1507) displaying distinct stereoselective liganding profiles in cysteine-directed ABPP experiments in Ramos cells. e, Protein-directed ABPP data showing lack of enantioselective enrichment for PRKDC. f, Protein-directed ABPP data showing stereoselective enrichment of PIKFYVE by alkyne WX-03-338 in 22Rv1 cells and blockade of this enrichment by WX-03-57. g, Violin plot showing native-vs-denatured reactivity ratios for cysteine-containing tryptic peptides from stereoselectively liganded proteins with good predicted proteotypicity (DeepMS probability > 0.5) that were either quantified or not quantified in cysteine-directed ABPP experiments performed in native cell proteomes. n=3 biological replicate/cell line; unpaired two-tailed t-test, **** p=0.0001. h, Protein-directed ABPP data showing stereoselective enrichment of FXR1 by WX-03-346 without blockade of this enrichment by WX-03-57. i, Cysteine-directed ABPP data showing greater stereoselective liganding of FXR1_C157 by WX-03-346 (left) versus WX-03-57 (right). j, Pie chart showing fraction of proteins liganded in a stereoselective (blue) or non-stereoselective (green) manner in protein-directed ABPP experiments. For e, f, h, and i, data represent mean values ± SD of n=4 biological replicates.
Extended Data Fig. 5
Extended Data Fig. 5. Characterization of stereoprobe-protein interactions
a, b, Cysteine-directed ABPP data showing stereoselective liganding of PLEK_C250 in Ramos cells by WX-01-06 (a) and WX-02-26 (b) in Ramos cells. c, Protein-directed ABPP data showing stereoselective enrichment of PLEK by WX-01-06 and blockade of this enrichment by WX-02-26. d, Gel-ABPP data demonstrating stereoselective engagement of recombinant WT-PLEK, but not a C250A-PLEK mutant by WX-01-06 (5 μM, 1 h). e, AlphaFold-predicted structure of PLEK showing location of C250 (red) relative to the IP5 binding pocket (blue). f, Cysteine-directed ABPP data showing stereoselective liganding of C210/213 of NFU1 by WX-01-12 and WX-02-46. g, Protein-directed ABPP data showing stereoselective enrichment of NFU1 by WX-01-12 and blockade of this enrichment by WX-02-46. h, Competitive gel-ABPP data showing stereoselective blockade of WX-01-12 reactivity with recombinant WT-NFU1 by WX-02-46 (20 μM, 1 h pre-treatment). i, Gel-ABPP data demonstrating engagement of WT-NFU1 and the C213A-NFU1 mutant, but not the C210A-NFU1 mutant, by WX-01-12. j, CellTiter-Glo data showing pH-dependent impairment in SW480 cell growth by WX-01-12 (5 μM, 72 h). Data are mean values ± SD from three independent experiments. One-way ANOVA with Dunnett’s multiple comparison, **p=0.0023, ***p<0.0001. k, l, Cysteine-directed ABPP data showing stereoselective liganding of TYMS_C195 by WX-01-07 (k) and WX-02-36 (l) in Ramos cells. m, Protein-directed ABPP data showing stereoselective enrichment of recombinant TYMS by WX-01-07 (5 μM, 1 h) and blockade of this enrichment by WX-02-36 (20 μM, 1 h pre-treatment). n, o, Gel-ABPP data showing stereoselective engagement of WT-TYMS, but not a C195-TYMS mutant by WX-01-07 (n) and stereoselective blockade of this engagement by WX-02-36 (o). p, Bar graph showing enantioselective enrichment of TMX1/4, but not TMX2/3 by WX-01-09 from protein-directed ABPP experiments in Ramos cells. For each TMX protein, the signal intensity in WX-01-11-treated cells was set to a value of 1. q, Cysteine-directed ABPP data showing stereoselective liganding of TMX4_C64/67 by WX-01-09 in Ramos cells. r, s, Gel-ABPP data demonstrating engagement of recombinant WT-TMX1 and C59A- and C205A-TMX1 mutants, but not C56A- or C56A/C59A TMX1 mutants (r), and recombinant WT-TMX4 and C67A- and C213A-TMX4 mutants, but not C64A- or C64A/C67A-TMX4 mutants (s) by WX-01-09 (5 μM, 1 h). t, Gel-ABPP confirming stereoselective engagement of recombinant TMX1 and TMX4, but not TMX2 and TMX3, by WX-01-09. u, v, Competitive gel-ABPP data showing concentration-dependent and enantioselective blockade of WX-01-09 (5 μM, 1 h) engagement of TMX1 (u) and TMX4 (v) by WX-02-16 (1 h pre-treatment). Top, representative gel-ABPP data; bottom, quantification of gel-ABPP. Data represent 2 biological replicates. The red asterisk in r represents alkyne liganded and rhodamine tagged species of TMX1 (this corresponds to the signal seen in gel-ABPP above the IB). Proteomic data presented in a-c, g, k- m, and p-q are mean values ± SD of n=4 biological replicates. For d, h, i, n-o, r- t experiments were performed in transfected HEK293T cells as described in Fig. 4b, and data are from a single experiment representative of two experiments; IB = anti-Flag immunoblot, UT= untransfected cells.
Extended Data Fig. 6
Extended Data Fig. 6. Characterization of tryptoline acrylamide stereoprobe-LIMK1 interactions
a, Cysteine-directed ABPP data showing enantioselective liganding of C349 of LIMK1 by alkyne stereoprobes WX-01-10 and WX-01-11 in Ramos cells. b, Cysteine-directed ABPP data showing lack of engagement of LIMK1_C349 by WX-02-26 and WX-02-36. c, Protein-directed ABPP data showing enantioselective enrichment of LIMK1 by WX-01-10 and WX-01-11 that is not blocked by WX-02-26 and WX-02-36, respectively. d, Gel-ABPP data demonstrating engagement of recombinant WT-LIMK1, but not the C349A-LIMK1 mutant by WX-01-11 (5 μM, 1 h). Experiments were performed in transfected HEK293T cells as described in Fig. 4b. e, Sequence alignment of LIMK1 and LIMK2 showing conserved residues (yellow) that are proximal (<15 Å) to the LIMK1-restricted stereoprobe-liganded cysteine C349 (red). f, Crystal structure of LIMK1 (PDB: 8AAU) showing C349 (red) in a pocket adjacent to the ATP (blue) binding site. Highlighted in yellow are residues conserved between LIMK1 and LIMK2 located within 15 Å of LIMK1 C349. g, Enantioselective and concentration-dependent enhancement of BRET signal in an LIMK1 NanoBRET kinase assay by WX-01-10 and WX-01-11 compared to their respective enantiomers WX-01-12 and WX-01-09. Data were generated in HEK293T cells transiently expressing LIMK1-nanoLuciferase fusion protein, where cells were treated with 0.5 μM of the NanoBRET K-10 tracer and different concentrations of stereoprobes for 3 h (data represent mean values for one experiment setup in triplicates). h, NanoBRET kinase assay showing that WX-01-11 increases signals for LIMK1 with the general kinase NanoBRET probe K-10, with the largest effect observed at lower concentrations of the NanoBRET probe. Data represent mean values for one experiment setup in triplicates. i, Enantioselective increase in BRET signal by WX-01-11 in WT- but not C349A-LIMK1 mutant cells. The ATP-binding pocket kinase inhibitor HG-9-91-01 decreased NanoBRET signals for both WT- and C349A-LIMK1 mutant (data represent mean values ± SD, n=3 independent experiments). j, Immunoblot of LIMK1-Nanoluc protein expressed in HEK293T cells showing that alkyne stereoprobes do not affect LIMK1 expression under conditions where they increase NanoBRET signals. For a-c, data represent mean values ± SD for n=4 biological replicates. For d, g-h, j data are from a single experiment representative of two independent experiments with similar results. For d, j, IB = anti-Flag immunoblot, and UT= untransfected cells.
Extended Data Fig. 7
Extended Data Fig. 7. Stereoselective liganding of a conserved cysteine in deubiquitinase paralogs STAMBP and STAMBPL1
a, Protein-directed ABPP data showing stereoselective enrichment of STAMBP by WX-01-08 and WX-03-341 without blockade of this enrichment by the corresponding competitors WX-02-46 and WX-03-60, respectively. b, Cysteine-directed ABPP data showing stereoselective liganding of STAMBP_C264 by WX-01-08, but not WX-03-60. c, Protein-directed ABPP data showing stereoselective enrichment of STAMBPL1 by WX-01-08 and WX-03-341 and blockade of this enrichment by the corresponding competitor stereoprobes WX-02-46 and WX-03-60, respectively. d, Cysteine-directed ABPP data showing stereoselective liganding of STAMBPL1_C266/C276 by WX-03-60. For a-d, data represent mean values ± SD, n=4 biological replicates. e, Left, sequence alignment of STAMBP and STAMBPL1 showing conservation of the stereoprobe-liganded cysteine (C264 in STAMBP and inferred as C276 in STAMBPL1) highlighted in yellow. Right, overlay of the crystal structures of STAMBP (green, PDB: 3RZV) and STAMBPL1 (blue, PDB: 2ZNV) showing location of the conserved cysteines C264/276 (yellow) with respect to the deubiquitinase active site). f, Gel-ABPP data (performed as in Fig. 4c) showing stereoselective liganding of recombinant WT-STAMBP, but not a C264A STAMBP mutant by WX-01-08 (5 μM, 1 h). Experiments were performed in transfected HEK293T cells as described in Fig. 4b. Data are from a single experiment representative of two independent experiments. IB = anti-Flag immunoblot, and UT= untransfected cells.
Extended Data Fig. 8
Extended Data Fig. 8. Leveraging tryptic peptide maps from protein-directed ABPP experiments to deduce stereoselectively liganded residues
a, Sequence of C15orf57 showing the three cysteines (yellow highlight), peptides that were quantified in protein-directed ABPP (red), and the tryptic peptide containing the liganded cysteine, C111 (underlined). b, Competitive gel-ABPP data showing stereoselective blockade of WX-01-12 (5 μM, 1 h) engagement of C15orf57 by WX-02-46 (20 μM, 1 h pre-treatment). c, Competitive gel-ABPP data showing concentration-dependent, enantioselective blockade of WX-03-346 (1 μM, 1 h) engagement of STK39 by WX-03-59 (1 h pre-treatment) (left) and quantitation of these data (right). d, e, Crystal structure of STK39 (PDB: 5D9H) showing location of stereoprobe-liganded cysteine C334 (red) distal to the ATP pocket and highlighted in yellow are residues around C334 (< 15 Å) that are conserved between STK39 and paralog OXSR1 (yellow-highlighted residues also shown in the sequence alignment in e). f, Protein-directed ABPP data showing stereoselective enrichment of AK3 by WX-03-338 and blockade of this enrichment by WX-03-57 in 22Rv1 cells. Data represent mean values ± SD, n=4 biological replicates. g, Tryptic peptide map of AK3 from protein-directed ABPP experiments showing stereoselective enrichment of all quantified AK3 peptides by WX-03-338 except for the peptide containing K34 (red). In the heat map display, tryptic peptide signal intensities were normalized to 100% for the WX-03-338 treatment group. h, Left, cysteine-directed ABPP data showing stereoselective liganding of FOXA1_C258 by WX-02-26 in 22Rv1 cells. Right, protein-directed ABPP data showing stereoselective enrichment of FOXA1 by WX-01-02 and blockade of this enrichment by WX-02-26 in 22Rv1 cells. Data represent mean values ± SD, n=4 biological replicates. i, Tryptic peptide map of FOXA1 from protein-directed ABPP experiments showing stereoselective enrichment of all quantified FOXA1 peptides by WX-01-02 except for the peptide containing C258 (red). In the heat map display, tryptic peptide signal intensities were normalized to 100% for the WX-01-02 treatment group. j, Gel-ABPP data demonstrating stereoselective engagement of recombinant WT-AK3, but not the K34R-AK3 mutant by WX-01-05. Experiments were performed in transfected HEK293T cells as described in Fig. 4b. k, Lysine-directed ABPP showing stereoselective liganding of AK3_K34 by WX-03-57. Data represent mean and individual values from two biological replicates. l, Crystal structure of AK3 (PDB: 6ZJD) showing distal location of K34 relative to the enzyme active site. For b, c, and j, data are from a single experiment representative of at least two independent experiments; IB = anti-Flag immunoblot, UT= untransfected cells.
Extended Data Fig. 9
Extended Data Fig. 9. Stereoselective and site-specific covalent ligands that inhibit the kynurenine biosynthetic enzyme AFMID
a, Molecular docking showing the preferred non-covalent binding pose for WX-01-03 to C28 of AFMID AlphaFold structure (AF-Q63HM1-F1). Highlighted is C28 (blue) of AFMID in which the sulfur atom and the beta carbon of WX-01-03 acrylamide group are 5.92 Å apart. Also highlighted is the catalytic serine, S164 (purple) and the HGGYW motif (green) that forms the oxyanion hole during substrate cleavage. b, Anti-Flag immunoblot showing expression of recombinant WT-, S164A-, C28A-, and C28W-AFMID in HEK293T cells used in enzyme assay in Fig. 4j; UT= untransfected cells, IB=immunoblot. Data is from a single experiment. c, Competitive gel-ABPP data showing enantioselective blockade of fluorophosphonate-rhodamine (1 μM, 1 h) reactivity with WT-AFMID by WX-01-03 (1 h pre-treatment). Data is representative of two independent experiments. d, Public RNAseq data showing relative mRNA expression of AFMID in cell lines of different lineages (data source: https://depmap.org/portal/, 23Q2 release). Highlighted in purple is the liver cell line HepG2 showing high AFMID expression. e, AFMID activity in HepG2 cells stably infected with three different CRISPR/Cas9 control or AFMID guide (sg) RNAs. Cells were treated with DMSO or 0.5 μM stereoprobes (3 h) and AFMID activity measured as described in Fig.4j. f, Alignment of AFMID sequences (https://www.uniprot.org/) from different organisms showing that the residue corresponding to human AFMID_C28 is substituted for serine in mouse (top panel) other species (bottom panel). g, Gel-ABPP data showing stereoselective engagement of a recombinant mouse S26C-AFMID, but not WT-AFMID, by WX-01-03 (5 μM, 1 h). h, Concentration-dependent and stereoselective inhibition of mouse S26C-AFMID, but not WT-AFMID activity, by WX-01-03. For e, h, Data represent average values ± SD, n=3 biological replicates.
Extended Data Fig. 10
Extended Data Fig. 10. Stereoprobes block MAD2L1BP interactions with the spindle assembly checkpoint (SAC) complex
a, Western blots of anti-MAD2L1BP co-immunoprecipitations (Co-IPs) showing stereoselective disruption of MAD2L1BP-MAD2L1/MAD1L1 interactions by WX-03-341 (5–20 μM, 3 h) versus WX-03-339 (20 μM, 3 h) in K562 cells. b, HeLa cells showing CRISPR/Cas9 knockout of MAD2L1BP (top panel, first row) and the reintroduction of WT or C186A-MAD2L1BP into sgMAD2L1BP_01 cells (bottom panel, first row). Red asterisk shows sgControl, sgMAD2L1BP, WT-MAD2L1BP and C186A-MAD2L1BP cell populations used for functional studies in Fig. 5h–m. c, Example of data collection and gating out of cell debris and aggregates on Novocyte for DNA content by PI staining. Gating was strategized to remove irregular events as follows; cell debris were gated out based on side scatter area (SSC-A) and forward scatter area (FSC-A) signal (top panel, left plot), cell aggregates were removed based on forward scatter height (FSC-H) and area (FSC-A) signal (top panel, middle blot). Further removal of aggregates and debris from propidium iodide (PI) positive cells was by PI area (PI-A) and PI height (PI-H) (top panel, right plot). Bottom panel plot shows cell cycle fitting based on the final gate (P3) and table shows the statistics and number of cells in each gate.
Figure 1.
Figure 1.. Alkyne stereoprobes for mapping electrophilic small molecule-protein interactions in cells.
a, Structures of alkynylated tryptoline acrylamide stereoprobes used in this study (black) and the corresponding non-alkyne stereoprobes (red) used as competitors in ABPP experiments. b, In situ reactivity of alkyne stereoprobes (5 μM, 1 h) in 22Rv1 cells as determined by gel-ABPP where stereoprobe-reactive proteins are detected by CuAAC conjugation to an azide-rhodamine reporter group, SDS-PAGE, and in-gel fluorescence scanning. c, Concentration-dependent in situ reactivity of alkyne stereoprobe set 1 in Ramos and 22Rv1 cells (tested at 5 μM and 20 μM, 1 h). Red asterisks mark examples of stereoselective stereoprobe-protein interactions. b, c, data are from a single experiment representative of two independent experiments.
Figure 2.
Figure 2.. Protein-directed ABPP platform for mapping stereoselectively liganded proteins in human cells.
a, Workflow for protein-directed ABPP experiments where the stereoselective enrichment of proteins by alkyne stereoprobes and blockade of this enrichment by corresponding non-alkyne competitor stereoprobes are determined by multiplexed (tandem mass tagging, TMT16plex) MS-based proteomics. Created with BioRender.com. b, Pie chart showing total number of proteins stereoselectively liganded in situ by each stereoconfiguration of tryptoline acrylamide stereoprobes. Note that this number is >271 because 14 proteins show cross reactivity with more than one stereoconfiguration. c, Correlation plots comparing in situ (5 μM, 1 h) and in vitro (10 μM, 1 h) enantioselective protein enrichment values from protein-directed ABPP experiments performed in Ramos cells treated with stereoprobe set 3. d, Quadrant plots highlighting stereoselectively liganded proteins for each stereoconfiguration of alkyne stereoprobe set 1 in Ramos (top) and 22Rv1(bottom) cells. Enantioselectivity (x-axis) is the ratio of enrichment for one stereoisomer vs its enantiomer, and diastereoselectivity (y-axis) is the ratio of enrichment of one stereoisomer vs the average of its two diastereomers. e, Unsupervised clustering of the full stereoprobe interaction profiles for each stereoselectively liganded protein, where clustering was based on the magnitude of competitor stereoprobe blockade of stereoselective enrichment observed for each liganded protein. White spaces represent protein-stereoprobe interactions that did not qualify as stereoselectively enriched by the indicated alkyne stereoprobe. Protein-directed ABPP data represent average values from 2–4 biological replicates per stereoprobe, per cell line.
Figure 3.
Figure 3.. Integrated protein- and cysteine-directed ABPP.
a, Total numbers and stereoselectively liganded fractions of proteins/cysteines quantified by cysteine-directed ABPP in Ramos and 22Rv1 cells. b, Functional class distribution of stereoselectively liganded proteins assigned by Gene Ontology (Panther) and KEGG Brite databases. c, GO-term enrichment analysis for stereoselectively liganded proteins. d, Venn diagram showing fraction of stereoselectively liganded proteins mapped by cysteine- and/or protein-directed ABPP. e, Heatmap showing multiple cysteines (C586, C1488, C1783) in HECTD4 displaying distinct stereoselective liganding profiles in cysteine-directed ABPP experiments. f, Bar graph showing lack of enantioselective enrichment of HECTD4 in protein-directed ABPP experiments. g, Box and Whisker plot showing the relationship between protein size and likelihood of being assigned as liganded in cysteine- or protein-directed ABPP experiments. (Ordinary one-way ANOVA with Tukey’s multiple comparison, ***adjusted p value < 0.0001). Cysteine-directed ABPP: minimum 25.57, maximum 796.4, median 119.0, 25% percentile 83.41, 75% percentile 224.5, bounds 10%-90% percentile (55.23–448.7); Both ABPP platforms: minimum 10.89, maximum 343.5, median 67.50, 25% percentile 46.34, 75% percentile 109.9, bounds 10%-90% percentile (28.46–192.2); protein-directed ABPP: minimum 10.89, maximum 491.9, median 52.02, 25% percentile 35.59, 75% percentile 85.15, bounds 10%-90% percentile (23.37–145.8). h, Violin plot showing MS detection probability (DeepMS score) for cysteine-containing tryptic peptides from stereoselectively liganded proteins that were quantified (right) or not quantified (left) in cysteine-directed ABPP experiments (unpaired two-tailed t-test, **** p=0.0001). i, Protein-directed ABPP data showing stereoselective enrichment of STRBP by WX-03-347 without blockade of this enrichment by WX-03-58. j, Cysteine-directed ABPP data showing stereoselective liganding of STRBP_C142 by WX-03-347 (left), but not WX-03-58 (right). For f, i, j data represent average values ± SD of four independent experiments. k, Pie chart displaying fraction of stereoselectively enriched proteins in protein-directed ABPP experiments that showed (gray; liganded) or did not show (teal; not liganded) blockade of enrichment by non-alkyne competitor stereoprobes or engagement by alkyne and/or competitor stereoprobes in cysteine-directed ABPP experiments. For g and h, data represent all the proteomic datasets generated in this study (n=4 biological replicates for each stereoprobe per ABPP experiment, per cell line).
Figure 4.
Figure 4.. Characterization of stereoprobe-protein interactions.
a, Protein-directed ABPP data showing stereoselective enrichment of C15orf57 by WX-01-12 and blockade of this enrichment by WX-02-46 in Ramos cells. b, Gel-ABPP data demonstrating stereoselective engagement of recombinant WT-C15orf57, but not C111A-C15orf57 by WX-01-12 (5 μM, 1 h). Data represent in situ stereoprobe treatment of HEK293T cells transiently expressing Flag-tagged C15orf57 proteins. ABPP signals were measured by CuAAC conjugation to rhodamine-azide tag followed by SDS-PAGE and in-gel fluorescence scanning. Shown above the gel is the C111-containing tryptic peptide. c, Protein-directed ABPP data showing enantioselective enrichment of STK39, but not paralog OXSR1, by WX-03-346 in Ramos cells. d, Gel-ABPP data demonstrating engagement of WT- and C59A-STK39, but not C334A-STK39, by WX-03-346 (1 μM, 1 h). Shown above the gel is the C334-containing tryptic peptide. e, Function of AFMID in the tryptophan-kynurenine metabolic pathway. IDO, indoleamine 2, 3-dioxygenase; TDO, tryptophan 2, 3-dioxygenase. f, Protein-directed ABPP data showing stereoselective enrichment of AFMID by WX-01-03 and blockade of this enrichment by WX-02-36 in Ramos cells. Data represent average values from 2 biological replicates. g, AlphaFold model of AFMID showing location of C28 (red), catalytic serine S164 (purple), and the HGGYW oxyanion motif (blue). h, i, Gel-ABPP data demonstrating stereoselective engagement of recombinant WT-AFMID, but not C28A-AFMID by WX-01-03 (5 μM, 1 h) (h) and blockade of this engagement by WX-02-36 (20 μM, 1 h) (i). j, N-formylamidase activity of indicated AFMID proteins and effects of WX-01-03 (5 μM, 1 h pre-treatment). AFMID variants were expressed in HEK293T cells, and lysates incubated with N-formylkynurenine (500 μM, 30 min) and the kynurenine product measured by LC-MS/MS. k, Concentration-dependent and stereoselective inhibition of endogenous AFMID activity in HepG2 cells by WX-01-03 (3 h). AFMID activity measured as described in j (2 h incubation). For d, h, i experiments were performed as described in Fig. 4b, and data are representative of at least two independent experiments; IB = anti-Flag immunoblot, UT = untransfected cells. For j, k, data represent mean values ± SD for three independent biological experiments. For a, c, data represent mean values ± SD for four independent biological experiments.
Figure 5.
Figure 5.. Stereoprobes block MAD2L1BP interactions with the spindle assembly checkpoint (SAC) complex.
a, b, Cysteine- (a) and protein- (b) directed ABPP data showing stereoselective engagement of MAD2L1BP (C186) in Ramos cells by WX-03-341 (a) and blockade of WX-03-341 enrichment by WX-03-60 (b) in Ramos cells. Data represent mean values of two (a) or mean values ± SD of four (b) biological replicates. c, d, Gel-ABPP data demonstrating stereoselective engagement of recombinant WT-MAD2L1BP, but not the C186A_MAD2L1BP mutant by WX-03-341 (5 μM, 1 h) (c), and blockade of this engagement (d) by WX-03-60 (1 h, 20 μM pre-treatment) in transfected HEK293T cells. e, Crystal structure of MAD2L1BP (pink)-MAD2L1(purple) complex showing location of C186 (yellow). f, Western blots of anti-MAD2L1BP co-immunoprecipitations (Co-IPs) showing stereoselective disruption of MAD2L1BP-MAD2L1/MAD1L1 interactions by WX-03-341 (5–20 μM, 3 h) versus WX-03-339 (20 μM, 3 h) in Ramos cells. g, Quantification of blotting signals from f. MAD2L1 and MAD1L1 signals were normalized to MAD2L1BP and then to DMSO signals. Data represent mean values ± SD of four biological replicates. h, Western blots of anti-MAD2L1BP co-immunoprecipitations (Co-IPs) showing that disruption of MAD2L1BP-MAD2L1/MAD1L1 interactions is C186 dependent. MAD2L1BP-knockout HeLa cells (sgMAD2L1BP cells) stably transduced with WT- or C186A-MAD2L1BP mutant were treated as described in f. i, Workflow for cell cycle synchronization and monitoring of G2/M transition into G0/G1 in HeLa cells. j, Cell cycle histogram (cell count (y-axis)) versus DNA content (propidium iodide (PI) signal) (x-axis)) showing delayed mitotic exit (red) into G1 (blue) in sgMAD2L1BP and WX-03-341-treated sgControl cells compared to DMSO- or WX-03-339-treated sgControl cells (see Extended Data Fig. 10c for flow cytometry gating information). k, Immunoblotting of cells in j for mitotic markers cyclin B1, phosphorylated histone H3 (ser10), and CDC20. l, m, Cell cycle histogram showing that WX-03-341 effects on mitotic exit are preserved in sgMAD2L1BP HeLa cells ectopically expressing WT- (l), but not C186A-MAD2L1BP (m). For c, d, h j, k, l and m, data are representatives of two independent experiments; IB = anti-Flag immunoblot, UT= untransfected cells. For j, l, and m, bar graphs are means of two biological replicates at 2 h.
Figure 6.
Figure 6.. Schematic for mapping and functionally evaluating stereoprobe-protein interactions in cells.
From left to right, tryptoline acrylamide stereoprobes are screened in human cells by both cysteine- and protein-directed ABPP to generate extensive maps of covalent ligandability, from which proteins showing stereoselective and site-specific interactions with the tryptoline acrylamides can be selected for further biological investigation. In these biology experiments, a tryptoline acrylamide is considered to have on-target functional effects if these activities are not observed in control cells treated with the inactive enantiomer or expressing the stereoprobe-resistant cysteine-to-alanine (C-to-A) mutant protein. Overall, this approach allows for the discovery of stereoselective and site-specific covalent ligand-protein interactions in cells and initial evaluation of the functional consequences of these interactions, providing useful information to guide future efforts to develop more advanced chemical probes for newly discovered ligandable pockets. The top right panel was created with BioRender.com.

References

    1. Chakravarty D; Solit DB, Clinical cancer genomic profiling. Nat Rev Genet 2021, 22 (8), 483–501. - PubMed
    1. Schreiber SL, A Chemical Biology View of Bioactive Small Molecules and a Binder-Based Approach to Connect Biology to Precision Medicines. Isr J Chem 2019, 59 (1–2), 52–59. - PMC - PubMed
    1. Wang ZZ; Shi XX; Huang GY; Hao GF; Yang GF, Fragment-based drug discovery supports drugging 'undruggable' protein-protein interactions. Trends Biochem Sci 2023, 48 (6), 539–552. - PubMed
    1. Denis JD; Hall RJ; Murray CW; Heightman TD; Rees DC, Fragment-based drug discovery: opportunities for organic synthesis. RSC Med Chem 2020, 12 (3), 321–329. - PMC - PubMed
    1. Lundquist KP; Panchal V; Gotfredsen CH; Brenk R; Clausen MH, Fragment-Based Drug Discovery for RNA Targets. ChemMedChem 2021, 16 (17), 2588–2603. - PubMed

Publication types

LinkOut - more resources