. 2024 Sep;25(9):1607-1622.
doi: 10.1038/s41590-024-01914-w. Epub 2024 Aug 13.

Distinctive evolution of alveolar T cell responses is associated with clinical outcomes in unvaccinated patients with SARS-CoV-2 pneumonia

Collaborators, Affiliations

Distinctive evolution of alveolar T cell responses is associated with clinical outcomes in unvaccinated patients with SARS-CoV-2 pneumonia

Nikolay S Markov et al. Nat Immunol. 2024 Sep.

Abstract

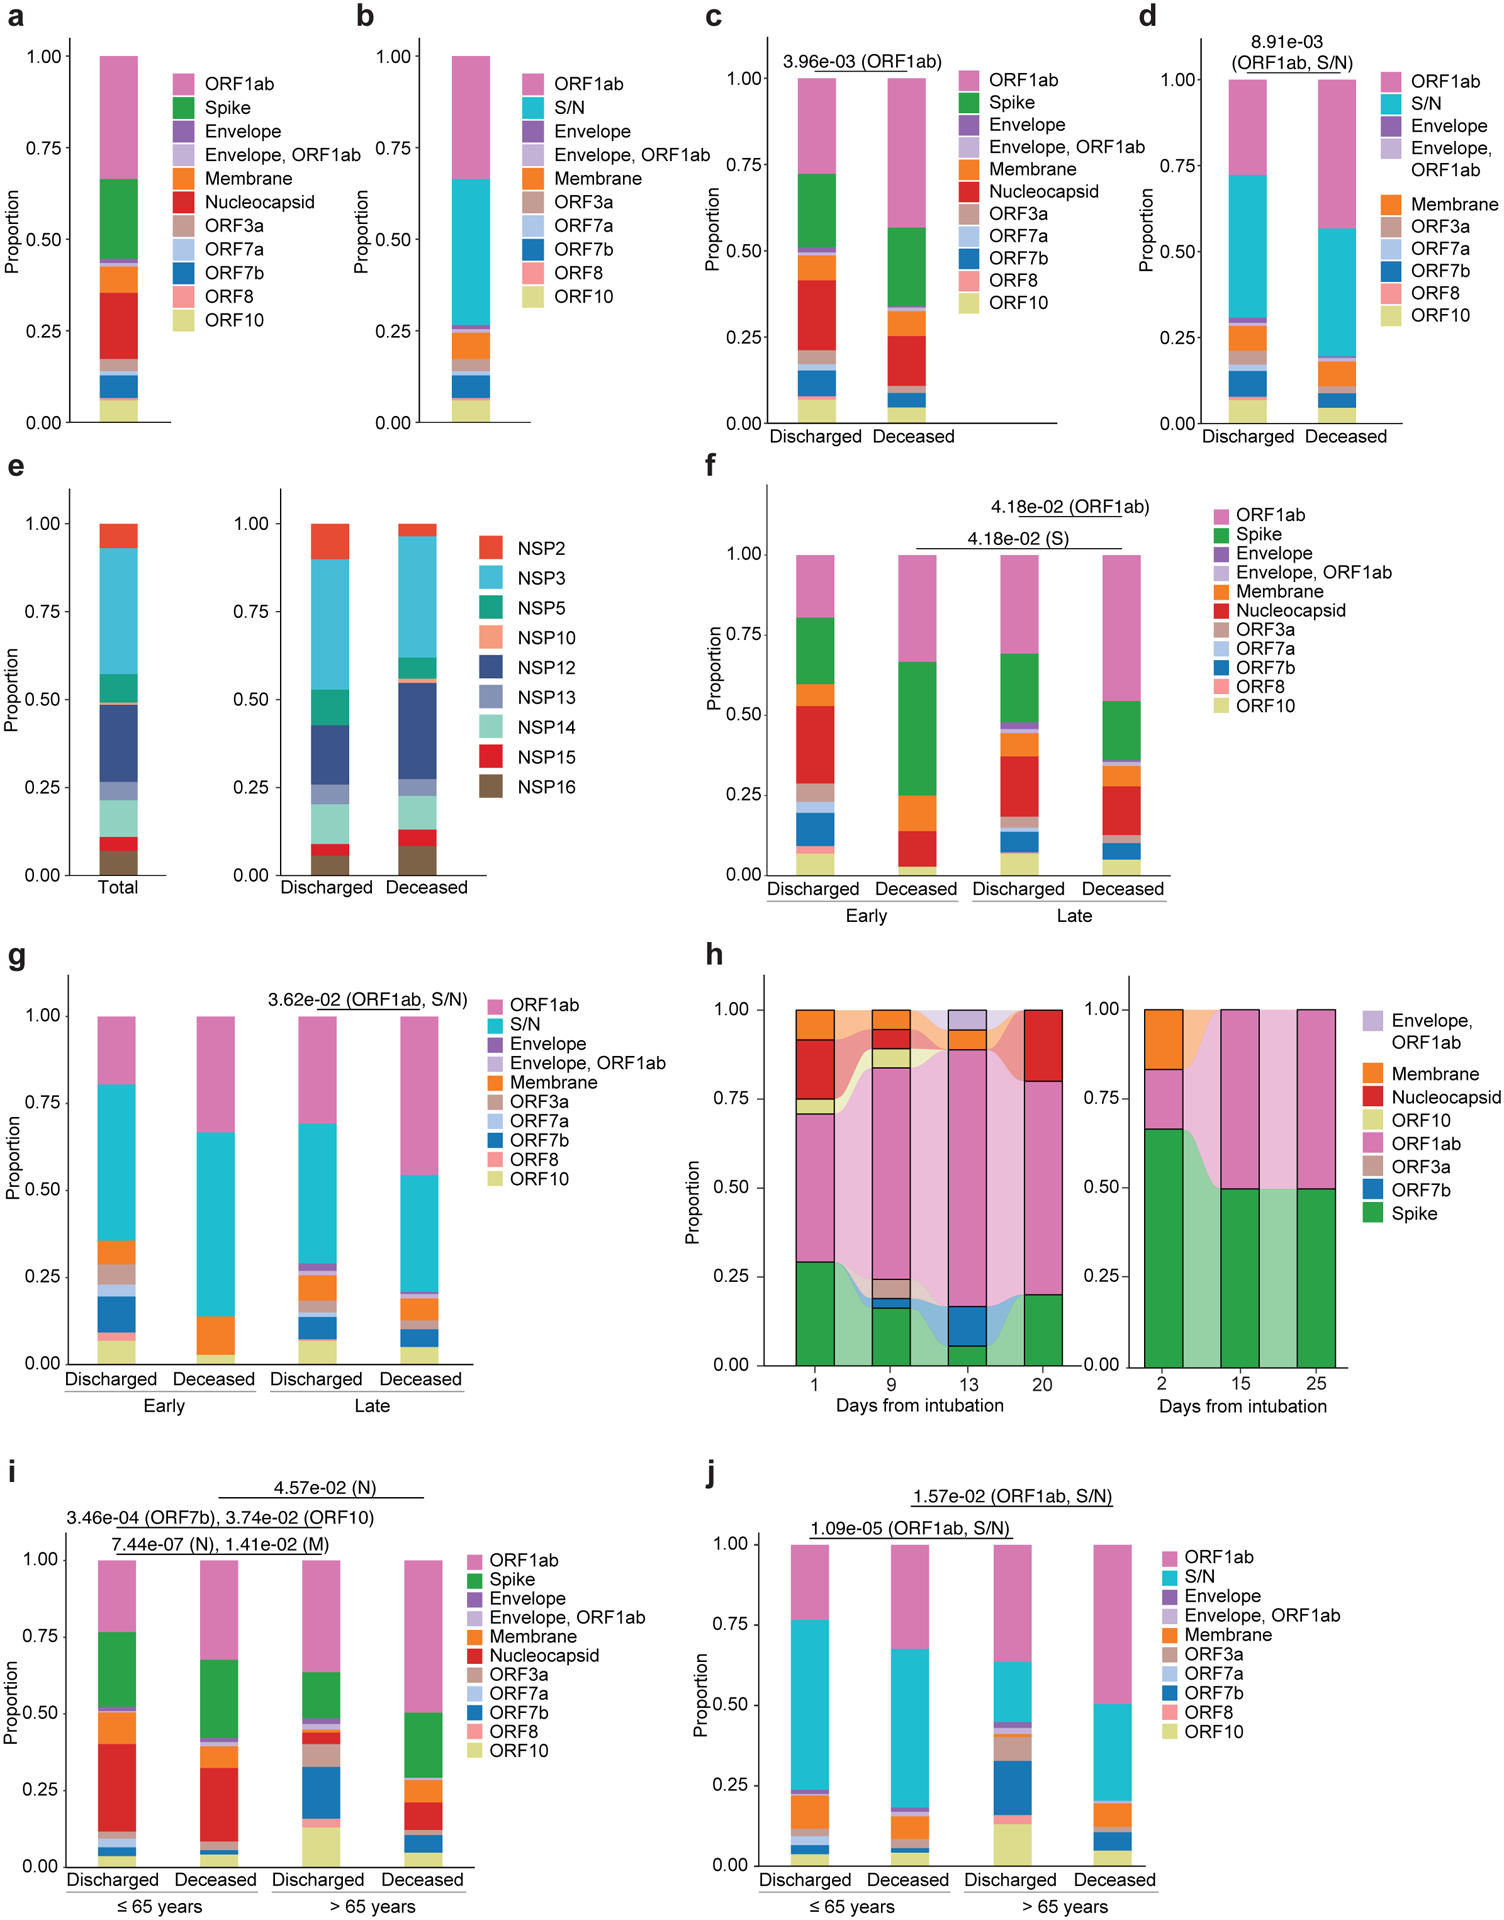
The evolution of T cell molecular signatures in the distal lung of patients with severe pneumonia is understudied. Here, we analyzed T cell subsets in longitudinal bronchoalveolar lavage fluid samples from 273 patients with severe pneumonia, including unvaccinated patients infected with severe acute respiratory syndrome coronavirus 2 (SARS-CoV-2) or with respiratory failure not linked to pneumonia. In patients with SARS-CoV-2 pneumonia, activation of interferon signaling pathways, low activation of the NF-κB pathway and preferential targeting of spike and nucleocapsid proteins early after intubation were associated with favorable outcomes, whereas loss of interferon signaling, activation of NF-κB-driven programs and specificity for the ORF1ab complex late in disease were associated with mortality. These results suggest that in patients with severe SARS-CoV-2 pneumonia, alveolar T cell interferon responses targeting structural SARS-CoV-2 proteins characterize individuals who recover, whereas responses against nonstructural proteins and activation of NF-κB are associated with poor outcomes.


Conflict of interest statement

Competing Interest Statement

BDS holds United States Patent No. US 10,905,706 B2, “Compositions and Methods to Accelerate Resolution of Acute Lung Inflammation”, and serves on the Scientific Advisory Board of Zoe Biosciences, outside of the submitted work. The other authors have no competing interests to declare.

Figures

Extended Data Fig. 1
Extended Data Fig. 1. Graphical abstract and the study cohort
(a) Graphical abstract. (b) CONSORT diagram of patients included in this study. (c) Schematic depicting multi-step analysis of BAL fluid samples with flow cytometry, bulk RNA-sequencing, and bulk TCR-sequencing by diagnosis (NPC, OP, SARS-CoV-2-P, OVP) and T cell subset (CD4+, CD8+, Treg).
Extended Data Fig. 2
Extended Data Fig. 2. SARS-CoV-2-P is characterized by a lymphomonocytic alveolar infiltrate early following intubation
(a) Flow cytometry analysis of BAL immune cell subset composition in CD3ε+CD4+ T cells, CD3ε+CD8+ T cells, Treg cells (CD3ε+CD4+CD25+CD127), monocytes (HLA-DR+CD4+CD206), macrophages (CD206+), and neutrophils (CD15+) indicating whether a given patient was discharged or deceased, the duration of mechanical ventilation (range 0–110 days; blanks indicate chronically ventilated patients), and presence (superinfection) or absence of bacterial infection with columns ordered by diagnosis (n=432 samples (NPC [n=36], OP [n=187], SARS-CoV-2-P [n=165], and OVP [n=44]) and then by days from intubation when the sample was obtained. VAP (ventilator-associated pneumonia) designates samples from NPC or patients with SARS-CoV-2-P or OVP who cleared the virus and then developed bacterial pneumonia. Each column represents a BAL sample. (b) Box plot of percentage of BAL CD4+ T cells detected in BAL fluid samples from diagnosis groups (q < 0.05, pairwise Wilcoxon rank-sum tests with FDR correction). (c) As in b, for CD8+ T cells. (d) As in b, for Treg cells. (e) As in b, for monocytes. (f) As in b, for macrophages. (g) As in b, for neutrophils. (h) Box plot of BAL CD4+ T cell percentages between early (≤48 hours following intubation) and late (>48 hours following intubation) samples by diagnosis (q < 0.05, pairwise Wilcoxon rank-sum tests with FDR correction). (i) As in h, for CD8+ T cells. (j) As in h, for Treg cells. (k) Box plot of BAL CD3+ T cell percentage grouped by the presence or absence of bacterial superinfection in early (≤48 hours following intubation) and late (>48 hours following intubation) SARS-CoV-2-P samples (q < 0.05, pairwise Wilcoxon rank-sum tests with FDR correction). (l) As in i, for monocytes. (m) Spearman correlation analysis between the percentage of BAL monocytes and the duration of mechanical ventilation by diagnosis. (n) As in i, for neutrophils. (o) As in m, for neutrophils. (p) As in k, for neutrophils. (q) As in i, for macrophages. (r) As in m, for macrophages.
Extended Data Fig. 3
Extended Data Fig. 3. Persistent BAL T cell enrichment is associated with discharged status
(a) Box plot of BAL CD4+ T cell percentage by discharged versus deceased status. n=432 samples (NPC [n=36], OP [n=187], SARS-CoV-2-P [n=165], and OVP [n=44]). q <0.05, pairwise Wilcoxon rank-sum tests with FDR correction. (b) As in a, for CD8+ T cells. (c) As in a, for Treg cells. (d) As in a, for monocytes. (e) As in a, for macrophages. (f) As in a, grouped by discharged and deceased status and by early (≤48 hours following intubation) and late (>48 hours following intubation) timing of BAL sampling relative to intubation. (g) As in f, for CD8+ T cells. (h) As in f, for Treg cells. (i) As in f, for monocytes. (j) As in f, for macrophages. (k) As in a, for neutrophils. (l) As in f, for neutrophils.
Extended Data Fig. 4
Extended Data Fig. 4. BAL immune cell subset abundance and phenotype correlate with clinical features
(a) Correlation analysis between the percentage of BAL immune cell subsets and clinical, physiological, and laboratory variables in NPC. No significant values after calculating Spearman rank correlation coefficient with FDR correction. (b) As in a, for OP. (c) As in a, for OVP. (d) Proportion of SARS-CoV-2-P BAL fluid samples, comparing presence or absence of bacterial superinfection with discharged versus deceased status. Nonsignificant by Fisher exact test. (e) Proportion of SARS-CoV-2-P BAL fluid samples, comparing pneumonia episode outcome status (cured, indeterminate, not cured) with discharged versus deceased status (q < 0.05, Fisher exact test with FDR correction). (f) Correlation analysis between BAL CD4+ and CD8+ T cell surface expression of CD127 and HLA-DR and clinical, laboratory, and physiological variables in SARS-CoV-2-P samples. Spearman rank correlation coefficient with FDR correction (q < 0.05 [*]). (g) Left: Correlation plot of CD4+ T cell surface expression of CD127 against the duration of mechanical ventilation. Spearman rank correlation coefficient shown. Shaded area represents 95% CI. Second from left: As in left, for CD4+ T cell surface expression of HLA-DR. Second from right: As in left, for CD8+ T cell surface expression of CD127. Right: As in left, for CD8+ T cell surface expression of HLA-DR.
Extended Data Fig. 5
Extended Data Fig. 5. BAL T cells in SARS-CoV-2-P are transcriptionally enriched for immune processes compared with NPC, OP, and OVP
(a) Number of patients contributing BAL samples for RNA-seq analysis (n=336 samples; NPC [n=38], OP [n=51], SARS-CoV-2-P [n=200], and OVP [n=47]). (b) Proportion of samples grouped by T cell subset and diagnosis. (c) Number of samples grouped by early (≤48 hours following intubation) and late (>48 hours following intubation) timing of BAL sampling relative to intubation or obtained in patients receiving chronic ventilation. (d) Box plot of mean Sequential Organ Failure Assessment (SOFA) scores over the day of the BAL. Nonsignificant after pairwise Wilcoxon rank-sum tests with FDR correction). (e) Proportion of discharged versus deceased patients. Nonsignificant after pairwise χ2 tests for homogeneity of proportions with FDR correction. (f) Proportion of sex (pairwise χ2 tests for homogeneity of proportions with FDR correction). (g) Top: K-means clustering of 975 differentially expressed genes (q < 0.05, likelihood-ratio test with FDR correction) in CD8+ T cell samples. Columns represent unique samples and column headers are color-coded by diagnosis, discharged versus deceased status, duration of mechanical ventilation (range 0–90 days, blanks indicate chronically ventilated patients), and superinfection status with columns ordered by NPC (n=15), OP (n=15), SARS-CoV-2-P (n=72), and OVP (n=23) and then by days from intubation when the sample was obtained. VAP (ventilator-associated pneumonia) designates samples from NPC or patients with SARS-CoV-2-P or OVP who cleared the virus and then developed bacterial pneumonia. Representative genes are shown for each cluster. Bottom: As in top, for CD4+ T cell samples (866 differentially expressed genes) in NPC (n=14), OP (n=23), SARS-CoV-2-P (n=81), and OVP (n=20). (h) Top: GSEA of Hallmark gene sets for the pairwise comparison between SARS-CoV-2-P samples and OVP samples in CD8+ T cells from g, top. Count denotes pathway size after removing genes not detected in the expression dataset. Enrichment denotes significant (q < 0.25 with FDR correction) upregulated (red) and downregulated (blue) pathways by normalized enrichment score. Bottom: As in h, top for CD4+ T cells from g, bottom. (i) Left: Gene ontology (GO) parent term annotation (q < 0.05 with FDR correction) from cluster 2_CD8. Points are color-coded by unique terms and size denotes the number of genes within each GO term. Right: As in left, for cluster 1_CD8. (j) As in I for cluster 1_CD4.
Extended Data Fig. 6
Extended Data Fig. 6. BAL T cells have an activated memory phenotype during severe pneumonia
(a) K-means clustering of 80 differentially expressed genes (q < 0.05, likelihood-ratio test with FDR correction) between NPC (n=9), OP (n=13), SARS-CoV-2-P (n=47), and OVP (n=4) in Treg cell samples. Columns represent unique samples and column headers are color-coded by diagnosis, discharged versus deceased status, duration of mechanical ventilation (range 0–90, blanks indicate chronically ventilated patients), and superinfection status. VAP (ventilator-associated pneumonia) designates samples from NPC or patients with SARS-CoV-2-P or OVP who cleared the virus and then developed bacterial pneumonia. Samples were clustered using Euclidean distance and Ward’s minimum variance linkage method. Representative genes are shown for each cluster. (b) GSEA of Hallmark gene sets for the pairwise comparison between SARS-CoV-2-P samples and NPC, OP, and OVP samples in Treg samples from a. Count denotes pathway size after removing genes not detected in the expression dataset. Enrichment denotes significant (q < 0.25 with FDR correction) upregulated (red) and downregulated (blue) pathways by normalized enrichment score. (c) As in b, for the pairwise comparison between SARS-CoV-2-P samples and OVP samples. (d) Deconvolution analysis showing inferred proportion of BAL CD8+ T cell subsets. Column data labels are as in a. (e) Proportion of inferred BAL CD8+ T cell subsets by diagnosis. (q < 0.05, pairwise Wilcoxon rank-sum tests with FDR correction). (f) Proportion of inferred BAL CD8+ T cell subsets by discharged versus deceased status and early (≤48 hours following intubation) and late (>48 hours following intubation) timing of BAL sampling relative to intubation in SARS-CoV-2-P samples (q < 0.05, pairwise Wilcoxon rank-sum tests with FDR correction). (g) As in d, for CD4+ T cell subsets. (h) As in e, for CD4+ T cell subsets. (i) As in f, for CD4+ T cell subsets.
Extended Data Fig. 7
Extended Data Fig. 7. TCR repertoire diversity is lower in SARS-CoV-2-P samples complicated by superinfection or VAP
(a) Number of patients contributing BAL samples for TCR-seq analysis (n=130 samples; NPC [n=13], OP [n=16], SARS-CoV-2-P [n=73], and OVP [n=28]). (b) Proportion of TCR-seq samples grouped by T cell subset and diagnosis. (c) Number of TCR-seq samples grouped by early (≤48 hours following intubation) and late (>48 hours following intubation) timing of BAL sampling relative to intubation. (d) Box plot of the mean Sequential Organ Failure Assessment (SOFA) scores on the day of BAL sample. Nonsignificant after pairwise Wilcoxon rank-sum tests with FDR correction. (e) Proportion of discharged versus deceased status patients. Nonsignificant after pairwise χ2 tests for homogeneity of proportions with FDR correction. (f) Proportion of sex (pairwise χ2 tests for homogeneity of proportions with FDR correction. (g) TCR richness analysis showing Chao 1 values in combined BAL CD4+ and CD8+ T cells by diagnosis. (q < 0.05, pairwise Wilcoxon rank-sum tests with FDR correction). (h) As in g, grouped by early (≤48 hours following intubation) and late (>48 hours following intubation) timing of BAL sampling relative to intubation. (i) As in g, grouped by discharged versus deceased status. (j) Pearson correlation analysis between TCR richness (Chao 1 values) and patient age in combined BAL CD4+ and CD8+ T cells in SARS-CoV-2-P samples (left) and NPC, OP, and OVP samples (right). Shaded area represents 95% CI. (k) As in j, correlated with the duration of mechanical ventilation. (l) Richness analysis showing Chao 1 values in SARS-CoV-2-P samples grouped by discharged versus deceased status in primary SARS-CoV-2 infection only (top), bacterial superinfection (middle), and VAP (bottom). Wilcoxon rank sum tests.
Extended Data Fig. 8
Extended Data Fig. 8. BAL T cells in SARS-CoV-2-P are virus specific in HLA context
(a) Proportion of HLA-A molecules identified in CD8+ T cells in SARS-CoV-2-P samples (n of patients = 14). (b) As in c, for HLA-B. (c) Left: Proportion of TCRβ (V) gene usage in CD8+ TCR sequences in SARS-CoV-2-P samples (n of patients = 14). Middle: Absolute number of TCRβ sequences for each V region. Right: Representative epitopes from TCR chains exhibiting a count > 5 per dominant gene (TRBV12–3 and TRBV27). (d) As in c, for CD4+ TCR sequences. Right: Dominant genes (TCR count > 30) and representative epitopes are annotated for TRBV6–6 and TRBV20–1. (e) Proportion of HLA-A allele representation for detected CD8+ TCRβ (V) segments. (f) As in e, for HLA-B. (g) Heatmap of association measure of HLA alleles distribution within distinct V genes (1 – normalized Shannon entropy). (h) Proportion of TCRs detected by patient with distinct V gene segments.
Extended Data Fig. 9
Extended Data Fig. 9. Generation probabilities (Pgen) of BAL CD4+ TCRs is lower in SARS-CoV-2-P than in OVP, OP, and NPC
(a) Logarithmic distribution of Pgen for post-GLIPH2-enriched CDR3β amino acid sequences across diagnoses (q < 0.05, pairwise Wilcoxon rank-sum tests with FDR correction). Each dot corresponds to a TCRβ chain. (b) Probability density of the data in a. (c) Logarithmic distribution of Pgen for post-GLIPH2-enriched and cross-referenced CDR3β amino acid sequences to MIRA MHCII dataset in SARS-CoV-2-P and OP. Each dot corresponds to a TCRβ chain. Nonsignificant after Wilcoxon rank-sum test. (d) Probability density of the data in c. (e) Similarity network analysis of BAL CD4+ TCR sequences cross-referenced to MIRA MHCII dataset epitope pools. Nodes represent unique TCR (CDR3β) sequences and are color-coded by diagnosis status (non-SARS-CoV-2-P [NPC, OP, and OVP], SARS-CoV-2, or shared). Edges connect TCR sequences belonging to the same patterns or specificity groups identified through the GLIPH2 algorithm. Dot size represents calculated generation probability (Pgen) of individual TCRβ sequences. Left: Representative TCR sequences from prominent clusters are annotated.
Fig. 1.
Fig. 1.. BAL T cell enrichment is associated with clinical outcome in SARS-CoV-2-P.
(a) Alluvial diagram showing multi-step analysis of BAL samples with flow cytometry (n=432 samples (NPC [n=36], OP [n=187], SARS-CoV-2-P [n=165] and OVP [n=44]), bulk RNA-seq (n=336 samples; NPC [n=38], OP [n=51], SARS-CoV-2-P [n=200] and OVP [n=47]) and bulk TCR-seq (n=130 samples; NPC [n=13], OP [n=16], SARS-CoV-2-P [n=73] and OVP [n=28]). (b) Flow cytometry analysis of BAL immune cell subset composition of CD3ε+CD4+ T cells, CD3ε+CD8+ T cells, CD3ε+CD4+CD25+CD127 Treg cells, HLA-DR+CD4+CD206 monocytes, CD206+ macrophages, and CD15+ neutrophils indicating whether a given patient was discharged or deceased, the duration of mechanical ventilation (range 0–110 days; blanks indicate chronically ventilated patients), and presence (superinfection) or absence of bacterial infection. VAP (ventilator-associated pneumonia) designates samples from NPC or patients with SARS-CoV-2-P or OVP who cleared the virus and then developed bacterial pneumonia. Each column represents a BAL sample. Samples were clustered using Euclidean distance and Ward’s minimum variance linkage method. (c) Percentage of T cells between early (≤48 hours following intubation, n=148) and late (>48 hours following intubation, n=284) in NPC, OP, SARS-CoV-2-P and OVP samples (q < 0.05, pairwise Wilcoxon rank-sum tests with FDR correction). (d) Spearman correlation analysis between the percentage of BAL T cells and the duration of mechanical ventilation in flow cytometry samples as in a, by diagnosis. (e,f) Comparison of the frequency of T cells between patients who were discharged or deceased (e) or sampled early or late (f) as in a (q < 0.05, pairwise Wilcoxon rank-sum tests with FDR correction). (g) Correlation analysis between the percentage of BAL immune cell subsets (CD4+ T cells, CD8+ T cells, Treg cells, monocytes, macrophages and neutrophils) and clinical, physiological and laboratory variables in SARS-CoV-2-P samples with Spearman rank correlation coefficient and FDR correction (q < 0.05 [*], q < 0.01 [**] and q < 0.001 [***]). Abbreviations: PaCO2, partial arterial carbon dioxide pressure; HCO3, bicarbonate; days on MV, days on mechanical ventilation; WBC, peripheral white blood cells; SOFA, Sequential Organ Failure Assessment; CK, creatine kinase; LDH, lactate dehydrogenase; FiO2, fraction of inspired oxygen; CRP, C-reactive protein; P/F, ratio of partial arterial oxygen pressure to fraction of inspired oxygen; COPD, chronic obstructive pulmonary disease; AST, aspartate aminotransferase; PaO2, partial arterial oxygen pressure; Vte, minute ventilation; BMI, body mass index; PEEP, positive end-expiratory pressure.
Fig. 2.
Fig. 2.. BAL T cell IFN and NF-κB responses are associated with discharged and deceased status, respectively.
(a) K-means clustering of 975 differentially expressed genes (DEG) (q < 0.05, likelihood-ratio test with FDR correction) between NPC (n=15), OP (n=15), SARS-CoV-2-P (n=72) and OVP (n=23) in CD8+ T cell samples (top) and 866 differentially expressed genes between NPC (n=14), OP (n=23), SARS-CoV-2-P (n=81) and OVP (n=20) in CD4+ T cell samples (bottom) from discharged or deceased patients on mechanical ventilation (range 0–90 days, blanks indicate chronically ventilated patients), with or without superinfection. VAP (ventilator-associated pneumonia) designates samples from NPC or patients with SARS-CoV-2-P or OVP who cleared the virus and then developed bacterial pneumonia. Columns represent unique samples. Samples were clustered using Euclidean distance and Ward’s minimum variance linkage method. Cluster 1_CD8 (595 DEG), Cluster 2_CD8 (380 DEG), Cluster 1_CD4 (552 DEG) and Cluster 2_CD4 (314 DEG). Representative genes are shown for each cluster. (b) Gene set enrichment analysis (GSEA) of Hallmark gene sets for the pairwise comparison between SARS-CoV-2-P samples and NPC, OP and OVP samples combined in CD8+ T cells (top) and CD4+ T cells (bottom) as in a. Count denotes pathway size after removing genes not detected in the expression dataset. Enrichment denotes significant (q < 0.25 with FDR correction) upregulated (red) and downregulated (blue) pathways by normalized enrichment score. (c) GSEA of genes from SARS-CoV-2-P CD8+ T cells samples (n=72) ranked by Spearman correlation with deceased status as in b. (d) Violin plot of normalized expression values for selected core genes (TNFAIP3, NR4A3) revealed by leading edge analysis driving pathway enrichment signal in c (pairwise Wilcoxon rank-sum tests). (e) GSEA of genes from SARS-CoV-2-P CD8+ T cells samples (n=72) ranked by Spearman correlation with the duration of mechanical ventilation. (f) Correlation analysis of normalized expression for selected core genes (NR4A3, TNFAIP3, IFI44, MKI67) revealed by leading edge analysis as in e, against the duration of mechanical ventilation in SARS-CoV-2-P CD8+ T cells samples (n=72). Shaded area represents 95% CI. (g) GSEA of genes from SARS-CoV-2-P CD4+ T cells (n=81) ranked by Spearman correlation with deceased status as in b. (h) Violin plot of normalized expression values for selected core genes (BATF, IRF4) revealed by leading edge analysis driving pathway enrichment signal in g (pairwise Wilcoxon rank-sum tests). (i) GSEA of genes from SARS-CoV-2-P CD4+ T cells ranked by Spearman correlation with the duration of mechanical ventilation (left) or respiratory system compliance (right). (j) Correlation analysis of selected leading edge gene (IFI44L) against duration of mechanical ventilation and (XAF1) against respiratory system compliance in SARS-CoV-2-P CD4+ T cells samples (n=81). Shaded area represents 95% CI.
Fig 3.
Fig 3.. BAL T cell NF-κB responses are associated with superinfection and worsened severity of illness.
(a,b) GSEA of genes from SARS-CoV-2-P CD4+ T cells samples (n=81) ranked by Spearman correlation with superinfection status (a) and SOFA score (b). Count denotes pathway size after removing genes not detected in the expression dataset. Enrichment denotes significant (q < 0.25 with FDR correction) upregulated (red) and downregulated (blue) pathways by normalized enrichment score. (c) Violin plot of normalized expression values for selected core gene (TGFBI) revealed by leading edge analysis driving pathway enrichment signal in a (pairwise Wilcoxon rank-sum tests). (d) Correlation analysis of normalized expression for selected core gene (FOSB) revealed by leading edge analysis in b, against SOFA score in SARS-CoV-2-P CD4+ T cells samples (n=81). Shaded area represents 95% CI. (e,f) GSEA of genes from SARS-CoV-2-P CD8+ T cells (n=72 samples) ranked by Spearman correlation with superinfection status (e) and and SOFA score (f). (g) Violin plot of normalized expression values for selected core gene (TNFRSF9, TNFAIP3, DUSP2, PLK1) revealed by leading edge analysis driving pathway enrichment signal in e. (h) Correlation analysis of normalized expression for selected core gene (TNFAIP3, NR4A3, PLK1, CDKN3) revealed by leading edge analysis in f, against SOFA score in SARS-CoV-2-P CD8+ T cells samples (n=72). (i) GSEA of genes from SARS-CoV-2-P CD8+ T cells (n=72 samples) ranked by Spearman correlation with respiratory system compliance. (j) Correlation analysis of normalized expression for selected core gene (TOP2A, XAF1, TNFAIP3, NR4A3) revealed by leading edge analysis in i, against respiratory system compliance in SARS-CoV-2-P CD8+ T cells samples (n=72). Shaded area represents 95% CI.
Fig 4.
Fig 4.. IFN signaling dominates the early BAL T cell response in SARS-CoV-2-P.
(a) RNA-seq of CD4+ T cells comparing early (n=18) versus late (n=63) samples (top) and CD8+ T cell early (n=17) versus late (n=55) samples (bottom) from 46 patients with SARS-CoV-2-P. Significantly upregulated genes in early samples are shown in red, and significantly upregulated genes in late samples are shown in blue (q < 0.05, likelihood-ratio tests with FDR correction). Genes shown in gray are not significantly differentially expressed. Representative significant genes are annotated. (b) Longitudinal analysis of IFN-stimulated genes in combined CD4+ and CD8+ T cells in SARS-CoV-2-P (n=153 samples from n=52 patients) discharged or deceased, with or without superinfection. Severity of illness (SOFA score), cumulative steroid dose (mg of hydrocortisone), C-reactive protein (CRP), D-dimer, viral load (Ct value) and ordered by duration of mechanical ventilation are indicated. Columns represent unique T cell samples. Blanks indicate missing values. (c) Comparison of SARS-CoV-2 viral load (Ct value) in discharged versus deceased and early versus late sampling in SARS-CoV-2-P samples (n=46; q < 0.05, pairwise Wilcoxon rank-sum tests with FDR correction). (d) Bar plot showing the number of discharged versus deceased and early versus late SARS-CoV-2-P with a Ct value above the limit of detection (>40). (e) Correlation analysis of SARS-CoV-2 Ct values and duration of mechanical ventilation in discharged versus deceased SARS-CoV-2-P with Spearman rank correlation coefficient. Shaded area represents 95% CI.
Fig. 5.
Fig. 5.. The BAL T cell response to SARS-CoV-2-P is pathogen specific.
(a) Network analysis of CD8+ TCR sequences in SARS-CoV-2-P (n=35) and OVP (n=15) samples by viral pathogen. Nodes represent unique TCR (CDR3β) sequences. Edges connect TCRs belonging to the same patterns or specificity groups. (b) As in a for SARS-CoV-2-P (n=35) and combined OVP (n=15) samples. (c) As in b for SARS-CoV-2-P samples (n=35). (d) Bar plot of proportion of inferred CD4+ T cell responses from MIRA dataset by SARS-CoV-2 protein in n=12 patients and n=22 samples. (e) Network analysis of shared CD4+ TCR sequences recognizing SARS-CoV-2 epitopes. Nodes represent SARS-CoV-2-P patients (n=12), edges represent shared TCR sequences by at least two patients mapped to a MIRA MHCII dataset epitope pool and width of edges (magnitude) denotes total number of shared TCR sequences. (f) Immunoprevalence of inferred SARS-CoV-2 epitopes (n=8) in SARS-CoV-2-P patients (n=12) represented as percentage (%) (left) and total percentage of TCR sequences inferred to recognize a given SARS-CoV-2 epitope (n=8) in SARS-CoV-2-P patients (right). * denotes other epitopes are present within MIRA MHCII dataset peptide pool. (g) Network analysis of CD4+ TCR sequences in SARS-CoV-2-P (n=36) and OVP (n=10) samples by viral pathogen. Nodes represent unique TCR (CDR3β) sequences. Edges connect TCRs belonging to the same patterns or specificity groups. (h) Network analysis of CD4+ TCR sequences in SARS-CoV-2-P (n=36) and combined OVP (n=10) samples. (i) Network analysis of CD4+ TCR sequences in SARS-CoV-2-P (n=36) samples.
Fig. 6.
Fig. 6.. BAL CD8+ T cells targeting non-structural proteins associate with deceased status.
(a) Proportion of CD8+ T cell inferred antigen targets by SARS-CoV-2 protein in n=14 patients and n=29 samples. (b) Proportion of CD8+ T cell inferred antigen targets by SARS-CoV-2 protein, with grouping of Spike and Nucleocapsid (S/N), as in a. (c) Proportion of SARS-CoV-2 inferred antigen targets by SARS-CoV-2 protein in discharged (n=9 patients, n=15 samples) versus deceased (n=5 patients, n=14 samples) patients. q-value < 0.05, row wise Fisher exact tests with FDR correction (per antigen). (d) Proportion of SARS-CoV-2 inferred antigen targets by SARS-CoV-2 protein with grouping of S and N (S/N) as in c. q-value < 0.05, row wise Fisher exact tests with FDR correction (per S/N and ORF1ab antigens). (e) Proportion of CD8+ T cell inferred antigen targets for the nonstructural proteins (NSP) within the ORF1ab complex in n=13 patients, n=24 samples (left) and proportion of CD8+ T cell antigen targets for NSP in discharged (n=8 patients, n=12 samples) and deceased (n=5 patients, n=12 samples) (right) patients. (f) Proportion of CD8+ T cell inferred antigen targets in early and late samples in discharged and deceased SARS-CoV-2-P patients (discharged, early = 5; deceased, early = 2; discharged, late = 6; deceased, late = 5). Sample numbers (discharged, early = 5; deceased, early = 2; discharged, late = 10; deceased, late = 12). q-value < 0.05, row wise Fisher exact tests with FDR correction (per antigen for late and deceased sample groups). (g) Proportion of CD8+ T cell inferred antigen targets with grouping of S and N (S/N) as in f. q-value < 0.05, row wise Fisher exact tests with FDR correction (per S/N and ORF1ab antigens for late and deceased groups). (h) Alluvial plots depicting the evolution of CD8+ T cell inferred antigen targets in Patient J (deceased) (top) and patient D (deceased) (bottom) (i) Proportion of CD8+ T cell antigen targets by age (≤65 years versus >65 years) in discharged versus deceased patients (discharged, ≤65 years = 6; deceased, ≤65 years = 2; discharged, >65 years = 3; deceased, >65 years = 3); samples (discharged, ≤65 years = 10; deceased, ≤65 years = 6; discharged, >65 years = 5; deceased, >65 years = 8). q-value < 0.05, row wise Fisher exact tests with FDR correction (per antigen). (j) Proportion of CD8+ T cell antigen targets as in i, with grouping of S and N (S/N). q-value < 0.05, row wise Fisher exact tests with FDR correction (per S/N and ORF1ab antigens).
Fig. 7.
Fig. 7.. Immunodominance and immunoprevalence of ORF1ab epitope targeting by BAL CD8+ T cells associate with deceased status.
(a) Network analysis of shared CD8+ TCR sequences recognizing SARS-CoV-2 epitopes. Nodes represent SARS-CoV-2-P patients (n=14), edges represent shared TCR sequences by at least two patients mapped to a MIRA MHCI dataset epitope pool and width of edges (magnitude) denotes total number of shared TCR sequences. (b) Network analysis of shared CD8+ TCR sequences recognizing SARS-CoV-2 epitopes as in a for discharged SARS-CoV-2-P patients (n=9). (c) Immunoprevalence of inferred SARS-CoV-2 epitopes (n=21) in discharged patients represented as percentage (%) (left) and total percentage of TCR sequences inferred to recognize a given SARS-CoV-2 epitope (n=21) in discharged patients (right). (d) Network analysis of shared CD8+ TCR sequences recognizing SARS-CoV-2 epitopes as in a for deceased patients (n=5). (e) Immunoprevalence of inferred SARS-CoV-2 epitopes (n=27) in deceased patients represented as percentage (%) (left) and total percentage of TCR sequences inferred to recognize a given SARS-CoV-2 epitope (n=27 epitopes) in deceased patients (right). (f) Predicted SARS-CoV-2 epitope binding affinity to patient TCR sequences, restricted to patient-specific HLA molecules. Percentile rank denotes predicted affinity strength with percentile ranks <1% and <5% denote strong and weak MHC binder sequences, respectively. Gray tiles represent epitopes not detected within a given patient. Column labels are color-coded by patient, binary outcome, and HLA alleles. Row labels are color-coded by SARS-CoV-2 antigens. M (Membrane), 7b (ORF7b), 10 (OFR10). * denotes that other epitopes are present within the MIRA MHCI dataset peptide pool.
Fig. 8.
Fig. 8.. Generation probabilities (Pgen) of BAL CD8+ TCRs are associated with outcomes.
(a,b) Logarithmic distribution of Pgen (a) and probability density (b) for GLIPH2-enriched CDR3β amino acid sequences across OVP, SARS-CoV-2-P, OP and NPC (q < 0.05, pairwise Wilcoxon rank-sum tests with FDR correction). Each dot corresponds to a TCRβ chain. (c) Logarithmic distribution of Pgen for GLIPH2-enriched and cross-referenced CDR3β amino acid sequences to MIRA MHCI dataset in discharged or deceased across OVP, SARS-CoV-2-P, OP and NPC patients. (d,e) Logarithmic distribution of Pgen (d) and probability density (e) for GLIPH2-enriched and cross-referenced CDR3β amino acid sequences to MIRA MHCI dataset across OVP, SARS-CoV-2-P, OP, and NPC (q < 0.05, pairwise Wilcoxon rank-sum tests with FDR correction). (f) Logarithmic distribution of Pgen for GLIPH2-enriched and cross-referenced CDR3β amino acid sequences to MIRA MHCI dataset in discharged or deceased, and early and late samples across OVP, SARS-CoV-2-P, OP and NPC patients. (g) Conserved sequence similarity between dominant BAL CD8+ T cell inferred SARS-CoV-2 epitopes and human coronaviruses (HCoV). Columns represent SARS-CoV-2 epitopes grouped and color-coded by antigen region. Rows are color-coded by distinct HCoV. Pairwise similarity denotes percentage of sequence homology between viruses. An average sequence homology percentage across all HCoV for each SARS-CoV-2 epitope is depicted as a dot in the column header. (h) Pairwise sequence similarity scores between SARS-CoV-2 epitopes and closest matching epitopes from HCoV. q < 0.05, pairwise Wilcoxon rank-sum tests with FDR correction. (i) Similarity network analysis of BAL CD8+ TCR sequences cross-referenced to MIRA MHCI dataset epitope pools. Nodes represent TCR (CDR3β) sequences unique in non-SARS-CoV-2-P (NPC, OP and OVP) or SARS-CoV-2-P or shared TCR (CDR3β) sequences. Edges connect TCR sequences belonging to the same patterns or specificity groups identified through the GLIPH2 algorithm. Dot size represents calculated generation probability (Pgen) of individual TCRβ sequences. Representative TCR sequences from prominent clusters are annotated.

Update of

Similar articles

Cited by

References

    1. Budinger GRS, Misharin AV, Ridge KM, Singer BD & Wunderink RG Distinctive features of severe SARS-CoV-2 pneumonia. J. Clin. Invest 131 (2021). - PMC - PubMed
    1. Gao CA et al. Machine learning links unresolving secondary pneumonia to mortality in patients with severe pneumonia, including COVID-19. J. Clin. Invest 133 (2023). - PMC - PubMed
    1. Grant RA et al. Circuits between infected macrophages and T cells in SARS-CoV-2 pneumonia. Nature 590, 635–641 (2021). - PMC - PubMed
    1. Rydyznski Moderbacher C et al. Antigen-specific adaptive immunity to SARS-CoV-2 in acute COVID-19 and associations with age and disease severity. Cell 183, 996–1012 (2020). - PMC - PubMed
    1. Markov NS et al. SCRIPT CarpeDiem Dataset: demographics, outcomes, and per-day clinical parameters for critically ill patients with suspected pneumonia (version 1.1.0). PhysioNet; 2023.

Methods References

    1. Grant RA et al. Circuits between infected macrophages and T cells in SARS-CoV-2 pneumonia. Nature 590, 635–641 (2021). - PMC - PubMed
    1. Pickens CO et al. Bacterial Superinfection Pneumonia in Patients Mechanically Ventilated for COVID-19 Pneumonia. Am. J. Respir. Crit. Care Med 204, 921–932 (2021). - PMC - PubMed
    1. Gao CA et al. Machine learning links unresolving secondary pneumonia to mortality in patients with severe pneumonia, including COVID-19. J. Clin. Invest 133 (2023). - PMC - PubMed
    1. Pickens CI et al. An Adjudication Protocol for Severe Pneumonia. Open Forum Infect Dis 10, ofad336 (2023). - PMC - PubMed
    1. Starren JB, Winter AQ & Lloyd-Jones DM Enabling a Learning Health System through a Unified Enterprise Data Warehouse: The Experience of the Northwestern University Clinical and Translational Sciences (NUCATS) Institute. Clin. Transl. Sci 8, 269–271 (2015). - PMC - PubMed